| Issue |
A&A
Volume 687, July 2024
|
|
|---|---|---|
| Article Number | A201 | |
| Number of page(s) | 9 | |
| Section | Stellar structure and evolution | |
| DOI | https://doi.org/10.1051/0004-6361/202346377 | |
| Published online | 15 July 2024 | |
A census of new globular clusters in the Galactic bulge
1
Universidade Federal do Rio Grande do Sul, Departamento de Astronomia, CP 15051, Porto Alegre 91501-970, Brazil
2
Università di Padova, Dipartimento di Astronomia, Vicolo dell’Osservatorio 2, 35122 Padova, Italy
3
INAF-Osservatorio Astronomico di Padova, Vicolo dell’Osservatorio 5, 35122 Padova, Italy
4
Centro di Ateneo di Studi e Attività Spaziali “Giuseppe Colombo” – CISAS, Via Venezia 15, 35131 Padova, Italy
5
Universidade de São Paulo, IAG, Rua do Matão 1226, Cidade Universitária, São Paulo 05508-900, Brazil
e-mail: This email address is being protected from spambots. You need JavaScript enabled to view it.
6
Astronomical Observatory, University of Warsaw, Al. Ujazdowskie 4, 00-478 Warszawa, Poland
Received:
10
March
2023
Accepted:
20
April
2024
Abstract
Context. The number of known globular clusters in the Galactic bulge has been increasing steadily thanks to different new surveys.
Aims. The aim of this study is to provide a census of the newly revealed globular clusters in the Galactic bulge, and analyze their characteristics.
Methods. In recent years, many globular clusters have been discovered or identified. The stellar populations to which they belong are indicated in their original studies: they are mostly bulge clusters, with some identified as disk or halo members. We collected 41 new globular clusters revealed in the last decade and compared them to the known bulge clusters.
Results. The new clusters are intrinsically faint with MV of around −6.0 mag. The distance to the Sun of the ensemble of well-known and new bulge clusters is compatible with the Galactocentric distance measurements from the Galactic black hole location. The ensemble sample shows metallicity peaks at [Fe/H] ∼ −1.08 ± 0.35 and −0.51 ± 0.25 dex, confirming previous findings. The age–metallicity relation of the new clusters younger than 10 Gyr is compatible with that of the ex situ samples of the dwarf galaxies Sagittarius, Canis Majoris, and Gaia-Enceladus-Sausage. The clusters with ages between 11.5 and 13.5 Gyr show no age–metallicity relation, because they are all old. This is compatible with their formation in situ in the early Galaxy.
Key words: Galaxy: bulge / globular clusters: general
© The Authors 2024
 Open Access article, published by EDP Sciences, under the terms of the Creative Commons Attribution License (https://creativecommons.org/licenses/by/4.0), which permits unrestricted use, distribution, and reproduction in any medium, provided the original work is properly cited.
This article is published in open access under the Subscribe to Open model. This email address is being protected from spambots. You need JavaScript enabled to view it. to support open access publication.
1. Introduction
The Galactic bulge probably formed due to early mergers within the ΛCDM scenario, and its present configuration was completed later with a buckling bar (e.g., Queiroz et al. 2020, 2021, see also review by Barbuy et al. 2018a).
The origin of globular clusters (GCs) in the Galactic bulge has become better understood in recent years, thanks to the proper motion measurements from the (and references therein Gaia Collaboration 2023), which allow one to examine their orbits. The nature of the GCs in the Galaxy having two branches in the age–metallicity relation (AMR) was revealed through the derivation of relative ages from ACS/HST data by Marín-Franch et al. (2009). The age–metallicity bifurcation using their data is clearly seen in Fig. 10 from Barbuy et al. (2009), for example, which shows one branch with the old clusters, in principle formed in situ in the early Galactic bulge, and another branch with the younger ones. This scenario was completed by Forbes & Bridges (2010), making evident that the AMR of the younger clusters fits well that of the dwarf galaxies Sagittarius and Canis Majoris, indicating that they should be accreted ex situ clusters, whereas the older clusters are all old and were formed early on in the history of our Galaxy. According to Forbes (2020), 73 of the known GCs were formed in situ, very early in the Galaxy’s history, and 87 were accreted from dwarf galaxies that merged with the Galaxy. Similar classifications were proposed by Massari et al. (2019), Kruijssen et al. (2020), Pérez-Villegas et al. (2020, hereafter PV20) Callingham et al. (2022), Horta et al. (2023), and Belokurov & Kravtsov (2024). These authors show the contrast between the age–metallicity plot of in situ clusters, and that of dwarf galaxies0]We have received a question mark citation [?] in sentence “see also the discussion on this”. Please check and update with the exact citation.200]Please note that the Ref. “Belokurov & Kravtsov (2024)” is cited in the text, but has not provided in the references list. Please include this in the reference list or remove the citations.
Bica et al. (2016) identified 43 well-known GCs that would belong to the Galactic bulge, based on an angular distance to the Galactic center lower than 20°, a distance to the Galactic center lower than 3.5 kpc, and a metallicity of [Fe/H] > −1.5 dex. It is interesting to point out the consideration of metallicity by Geisler et al. (2023), suggesting that clusters with metallicities lower than [Fe/H] ≲ −1.5 dex should be identified as more probably being halo clusters. Recently, Horta et al. (2023) and Belokurov & Kravtsov (2024) classified clusters as in situ or ex situ using ages, metallicities, detailed chemistry, total energy, and the z component of the orbital angular momentum.
The sample of Milky Way GCs is still incomplete, as was pointed out, for example, by Ivanov et al. (2005), Kurtev et al. (2008), and Bica et al. (2019), and progress in the detection of newly identified GCs has been made in recent years. Most of the newly revealed clusters were detected in the last five years, due to a combination of the VVV (Minniti et al. 2010) and VVVX surveys (Borissova et al. 2018) in J, H, KS, and proper motions from Gaia Data Release 3 (DR3; Gaia Collaboration 2023), which allowed decontamination from field stars.
The present work deals with the faint and in general low-mass clusters revealed by several surveys, such as VVV/VVVX in the near-infrared and WISE (Wright et al. 2010) in the mid-infrared. A number of new confirmed and candidate GCs are now in the process of being identified or having their existences confirmed, and metallicity, reddening, age, distance, and kinematical information is being derived. Bica et al. (2019) present a catalog of Galactic clusters and associations, and compile 200 GCs, plus 94 GC candidates. Baumgardt & Vasiliev (2021, hereafter BV21) and Vasiliev & Baumgardt (2021) report a list of known GCs, and derived their distances by making use of Gaia DR3 (Gaia Collaboration 2023) proper motions, including some objects in common with the list presented in this paper, as is described below.
In order to study these objects, we compiled the literature data for 39 confirmed clusters and two GC candidates, with 19 of them located in the bulge, considerably increasing the previous number of known bulge clusters (Bica et al. 2016).
A compilation of newly revealed clusters is described in Sect. 2. Previously identified bulge clusters, with updated data, are reported in Sect. 3. Ages, distances, and metallicities are analyzed in Sect. 4. Conclusions are drawn in Sect. 5.
2. New globular clusters identified in the Galactic bulge
In Table 1 we report 39 newly identified GCs and two GC candidates, basically since the last release of the Harris (1996, 2010 edition1, hereafter H10) catalog, and in particular since the Bica et al. (2016) review. The table lists coordinates, reddening, distance, metallicity, age, proper motions, absolute magnitudes, and an indication of the stellar populations to which they belong. Most of them can be identified as bulge clusters on the basis of coordinates and distance.
Literature data on the 41 newly identified GCs and candidates, reporting coordinates, reddening, distance to the Sun, metallicity, age, proper motions, magnitudes, and assignation to a Galactic stellar population.
Below, we provide a few comments on some individual clusters. Among the new clusters by Camargo (2018) and Camargo & Minniti (2019), for which proper motions are not explicitly given in the papers, but rather shown in plots, Camargo 1102, 1103, and 1104 have a different proper motion relative to the field; Camargo 1107, 1108, and 1109, on the other hand, have an indistinguishable proper motion, but deep VVV color-magnitude diagrams (CMDs), which suggests that they are real clusters. We note, however, that Gran et al. (2019) discard these clusters and dozens of Minniti clusters based on Gaia DR2 and VVV photometry and proper motions, validating only VVV-CL001 (Minniti et al. 2011) and VVV-CL002 (Moni Bidin et al. 2011). Gran et al. (2019) state, however, that for these candidates to be real they must have low mass and/or low concentration, or proper motions similar to the field stars (which happens frequently up to 5 mas yr−1 in their appendix figures). We prefer to move only Camargo 1105 and 1106 to the bottom of Table 1 as candidates, and wait for spectroscopy and deeper photometry before definitely confirming or discarding the other Camargo candidates, see also Dongwook et al. (2022)
Horta et al. (2023) and Belokurov & Kravtsov (2024) have presented evidence of clusters having formed in situ or having been accreted. Most of the new clusters are not included in the studies, but one case is of particular interest: FSR 1758. Myeong et al. (2019) and Vasiliev & Baumgardt (2021) have shown, based on its retrograde orbit and other properties, that FSR 1758 was accreted from the Sequoia dwarf galaxy.
Gran et al. (2022) report radial velocities and orbit calculations and conclude that Gran 1 is a bulge GC, formed in situ and that Gran 2, 3, and 5 might have their origin in the Gaia-Enceladus-Sausage structure. Belokurov & Kravtsov (2024) instead classify the latter clusters as having formed in situ.
It is also important to point out the measurement of radial velocities with the IGRINS/Gemini spectrograph by Garro et al. (2023), and the calculation of orbits. They find that Patchick 125 and Patchick 126 are bulge (or halo) clusters, that Ferrero 54, Gaia 2, and Patchick 122 should be disk clusters, and that VVV-CL160 is close to the Galactic center but orbits beyond the solar circle, and therefore has an unclear origin.
Finally, we note that the new clusters that lie outside the range of distances studied here, the ones that have metallicities lower than [Fe/H] ≤ −1.5 dex, and those classified as halo or disk members, are excluded from the plots showing the location of clusters in galactic coordinates, as well as from the metallicity and distance distributions. This amounts to 22 clusters that are not considered; that is, 19 new clusters are included as bulge members.
The reported data were retrieved from the individual papers with the given references. For five of them, distances are also provided, based on Gaia data, by Vasiliev & Baumgardt (2021).
Radial velocities are only available for a few clusters, reported in Table 2.
Radial velocities available for the new clusters.
Minniti et al. (2021b) report another 13 cluster candidates that should be further studied: VVV-CL154, and Minniti 20, 39, 40, 46, 47, 54, 55, 56, 57, 58, 59, and 60, detected in the VVV survey.
3. Previously identified bulge sample
As was mentioned above, Bica et al. (2016) presented a review of GCs that have characteristics of belonging to the Galactic bulge, specified as: (a) an angular distance to the Galactic center lower than 20°, (b) a distance to the Galactic center shorter than 3.5 kpc, and (c) a metallicity of [Fe/H] > −1.5 dex. Table 3 revises the data available for the 42 GCs identified as belonging to the bulge populations by Bica et al. (2016). In particular, metallicities have been derived for many of them in recent years using high-resolution spectroscopy. We note that for Terzan 5 we adopt the mean of [Fe/H] = −0.3 dex, corresponding to the dominant population of the various populations, which are estimated to have [Fe/H] = 0.25, −0.3, −0.8 dex (Massari et al. 2014); this is compatible with Origlia & Rich (2004). Likewise, for Liller 1 we also adopt a mean of [Fe/H] = −0.3 dex, which is that of the dominant population and a mean from −0.48 and +0.27 dex (Crociati et al. 2023), and compatible with Origlia et al. (2002). The coordinates of these clusters, not reported in Table 3, can be found in H10; likewise the quantities AKs,  , and μδ are given by Vasiliev & Baumgardt (2021).
Bulge GCs from Bica et al. (2016), with distances, ages, and metallicity values from the literature, in order of right ascension.
Distances are reported and given in four different sources, which is useful because there are some discrepant values in the literature. The final distances are adopted from PV20.
The ages were also retrieved from the literature, and are provided in Table 3. Many of the sample objects were observed after the 1990s and different techniques were used to derive their ages. For the sake of homogeneity, we only considered the studies with resolved photometry. Most of the CMDs are from HST observations. Exceptions are the deep near-infrared data in KS versus J − KS from Kerber et al. (2019) and Saracino et al. (2016) that used the Gemini imager with adaptive optics, and the observations of UKS 1 with the VVV survey; the latter is not deep, reaching just above the turnoff. The isochrone fitting procedures in Kerber et al. (2019), Ortolani et al. (2019a), Oliveira et al. (2020), Fernández-Trincado et al. (2020), and Souza et al. (2021, 2023) employed a statistical Bayesian method with the SIRIUS code (Souza et al. 2020), based on grids of Dartmouth (Dotter et al. 2008) and/or BaSTI isochrones (Pietrinferni et al. 2006), and a similar procedure was applied by Kerber et al. (2018). Cohen et al. (2021) used the fiducial lines of both the studied clusters and well-known clusters with reliable age determinations to derive their relative ages. Bruzual et al. (1997) employed the early Padova isochrones (Bressan et al. 1993), whereas Renzini et al. (2018) employed the Victoria-Regina code and isochrones (VandenBerg et al. 2014). Saracino et al. (2016), Ferraro et al. (2021), and Pallanca et al. (2021) employed fiducial lines and χ2 minimization to fit isochrones, employing the models mentioned above.
Age determinations using other methods, such as the magnitude difference between the horizontal branch and the main sequence turnoff, integrated spectra models, and MV calibrations of RR Lyrae stars, were not considered. The ages range from 11.5 to 13.5 Gyr, with an average age of 12.5 Gyr, in agreement with a mean of 12.3 Gyr from Oliveira et al. (2020). Fifteen clusters with no age determination are mostly low-mass and very reddened.
In Table 3 we identify the clusters classified as bulge members according to their orbits by Pérez-Villegas et al. (2020), identified by a B. We also indicate, in Tables 1 and 3, the classification of having been formed in situ or accreted, based on the total energy, E, and z component of the orbital angular momentum and further calibrated using the [Al/Fe] abundance ratio, by Belokurov & Kravtsov (2024), indicated by I or A, corresponding to “in situ” or “accreted.”
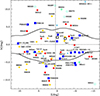 |
Fig. 1. Location in Galactic coordinates of bulge clusters, including a) projected bulge globular clusters (cf. Bica et al. 2016), represented by filled circles, with [Fe/H] > −0.8 (red); −1.3 < [Fe/H] < −0.8 (gold); [Fe/H] < −1.3 (blue); halo clusters: aquamarine open circles; cluster farther from the Galactic center than RC > 4.5 kpc: green open squares; b) candidate clusters (open black squares); c) newly confirmed clusters located in the region (blue filled squares). The Galactic center is illustrated by the blue filled circle. Contours correspond to COBE/DIRBE outline of the bulge from Weiland et al. (1994), and adapted from Jönsson et al. (2017). |
In Fig. 1 the location of the bulge clusters is plotted in galactic coordinates, ℓ and b, in degrees. This figure is an update of Fig. 3 from Barbuy et al. (2018a), including a) the bulge GCs Bica et al. 2016, b) candidate clusters, and c) newly confirmed clusters. All of the objects from lists b) and c) are new relative to a). UKS 1 is now included as a previously known cluster: it was not included as such in Bica et al. (2016) for the reason that its distance was a limiting case. It still is, but it is a typical bulge cluster in terms of CMD, which justifies its inclusion in the list; its true distance remains an open question.
There are two cases of clusters that had previously been identified at the time of the Bica et al. (2016) review but that had essentially no data, and that have since been observed and characterized in recent surveys, as is shown in Table 1. These clusters are VVV-CL002 and Kronberger 49, and they are plotted in the figures as new clusters. Therefore, we consider hereafter 42 well-known clusters, comprising those from Bica et al. (2016), except for VVV-CL002 and Kronberger 49, which we took out from Table 3, in addition to UKS 1.
4. Parameters of the new sample
4.1. Metallicity and mass
The sample clusters have lower masses than the well-known GCs, as is indicated by their integrated absolute magnitudes, with most of them with MV fainter than −7.0 mag. This is clearly seen in Fig. 2, where only clusters that have an MV value available are included. This figure shows that the new clusters all have low masses relative to the other two samples. It is therefore unlikely that massive clusters are still missing, but there could still be massive clusters with low density that remain undetected. Other low mass clusters probably also remain undetected due to crowding and high extinction. It can be seen in the right panel of Fig. 2 that the low-luminosity tail of the globular cluster luminosity function (GCLF) is non-Gaussian, given an extended tail of low-mass clusters (see also the discussion on this matter by Jordán et al. 2007).
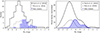 |
Fig. 2. Absolute magnitude, MV, of the new cluster sample compared to the literature. Left panel: histogram of the 36 of the 41 new clusters from Table 1 with available MV (solid blue histogram), compared to H10 (156 clusters, solid black histogram) and bulge clusters Bica et al. (2016), 42 clusters) plus UKS 1 (dashed gray histogram). Right panel: Kernel density estimation of the three distributions, with a Gaussian kernel and normalized y axis. A low-luminosity tail is seen in the three samples between MV ∼ −5 and −4 mag. |
Figure 3 shows the metallicity distribution of bulge clusters, including the well-known bulge clusters reported in Table 3, together with the new sample clusters listed in Table 1, excluding the halo, halo intruder, and disk clusters, clusters that have [Fe/H] ≲ −1.5 dex (in order to be compatible with the selection criteria of bulge clusters defined in Bica et al. 2016), and clusters that have distances out of the range of 4 ≲ d⊙ ≲ 11 kpc.
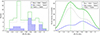 |
Fig. 3. Metallicities of full sample of bulge clusters. Left panel: histogram of metallicity including the 42 well-known bulge clusters from Bica et al. (2016) and the new sample clusters, excluding clusters classified as belonging to the halo and disk, those that have [Fe/H] < −1.5 dex, and clusters that have distances out of the range of 4 < d⊙ < 11 kpc. A histogram combining both samples is also shown in green. Right panel: Kernel density estimation, showing the distribution peaks independently of the bin size: Bica et al. (2016) with peaks in −1.05 and −0.40 dex, the new cluster sample with peaks in −1.20 and −0.55 dex, and the combined sample with a higher peak consistent with Bica et al. (2016) but with a smaller peak shifted to a more metal-poor value (dashed lines: −1.08 ± 0.35 and −0.51 ± 0.25 dex). |
The left panel shows the histogram of metallicity and the right panel kernel density estimations. From the right panel of Fig. 3 the combined bulge sample (Tables 1 and 3) show peaks at [Fe/H] ∼ −1.08 ± 0.35 and −0.51 ± 0.25 dex. The more metal-poor peak is in agreement with that of Bica et al. (2016), whereas the more metal-rich peak is shifted by ∼0.1 dex compared to Bica et al. (2016) due to the large number of new clusters with [Fe/H] ∼ −0.6 dex. The new clusters alone have peaks at [Fe/H] ∼ −0.55 dex, coincident with the full sample, and at a lower metallicity of [Fe/H] ∼ −1.2 dex, but with low statistics.
The seven new halo clusters are all more metal-poor than [Fe/H] < −1.3 dex, except for VVV-CL003. VVV-CL001 is more metal-poor than any halo cluster, with [Fe/H] ∼ −2.45 dex (Fernández-Trincado et al. 2021b), and it has been suggested, owing to its orbit, that it belongs to a massive dwarf galaxy such as Gaia-Enceladus-Sausage (GES; Belokurov et al. 2018; Helmi et al. 2018) or Sequoia (Seq.; Massari et al. 2019) that merged with the Galaxy at an early time. Another cluster with such low metallicity in the bulge is ESO 280-SC06 (Ortolani et al. 2000), which was recently studied spectroscopically, revealing a metallicity of [Fe/H] = −2.48 dex by Simpson (2018), and reported to be associated with the Gaia-Enceladus-Sausage (Massari et al. 2019) dwarf galaxy.
The bulge field surveys GIBS (Zoccali et al. 2017) and ARGOS (Ness et al. 2013) show peaks at [Fe/H] ∼ +0.3, −0.4 dex and [Fe/H] ∼ +0.15, −0.25, and −0.7 dex, respectively. The combined sample of bulge clusters shows compatibility between bulge clusters and the field at [Fe/H] ∼ −0.5 dex from Zoccali et al. (2017), and [Fe/H] ∼ −0.7 dex from Ness et al. (2013). The more metal-poor peak at [Fe/H] ∼ −1.1 dex already pointed out in Bica et al. (2016) is confirmed here.
4.2. Ages
Regarding ages, only 28 of the new sample clusters have values of age and metallicity reported in the literature.
The ages were obtained from the visual fitting of isochrones. The CMDs are not deep, with those from VVV data reaching KS ∼ 17 − 18 mag. in the best cases; those from WISE data are shallow, with KS ∼ 14 − 15 mag. Garro et al. (2022b) give an age uncertainty of ±2 Gyr, while Fernández-Trincado et al. (2022) give ±3 Gyr. We can adopt a general uncertainty of ±2 − 3 Gyr. In order to have a comparison sample of clusters formed in situ, and another sample formed ex situ, we adopt the selection by Forbes & Bridges (2010) and Forbes (2020), with data updated in Kruijssen et al. (2019), and Limberg et al. (2022). These samples were intended to verify an AMR of the new clusters from Table 1.
Figure 4 compares the complete sample of well-known bulge clusters, plus the new sample, to clusters from the dwarf galaxies Sagittarius and Canis Majoris listed in Forbes & Bridges (2010), and from Gaia-Enceladus-Sausage listed in Limberg et al. (2022).
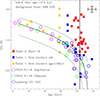 |
Fig. 4. Metallicity vs. age for the new clusters that have these values available, compared with the Bica et al. (2016) sample, and with the Sagittarius and Canis Majoris clusters identified in Forbes & Bridges (2010) labeled as FB10, with updates from Kruijssen et al. (2019) labeled as K+19, and Gaia-Enceladus-Sausage with clusters identified in Limberg et al. (2022). Bulge clusters from Table 3 are represented by filled red squares; old clusters from Table 1 by filled blue squares; clusters from Table 1 younger than 10 Gyr by filled gold squares; clusters from Sagittarius by open magenta circles; clusters from Canis Majoris by open green circles; clusters from GSE by open blue circles; ages of 12.5 ± 0.3 Gyr by black lines; and the model and uncertainties from Forbes & Bridges (2010) by green lines. The old bulge clusters are all old and show no AMR, as is indicated by the straight black line with an age of 12.0 Gyr. Dark green curves represent the best fit of the AMR to the GSE sample from Limberg et al. (2022), and ±3σ curves. The lower age limits for five of the new clusters are represented by arrows. The error bar in the upper right corner indicates the typical errors of 0.2 dex in [Fe/H] and 1.0 Gyr in age. |
Figure 4 gives a metallicity versus age for the new clusters that have these values available, excluding seven clusters that have no measurement of proper motion and/or radial velocity. They are compared with the Bica et al. (2016) sample, and with the Sagittarius and Canis Majoris clusters identified in Forbes & Bridges (2010), and updates from Kruijssen et al. (2019), plus Gaia-Enceladus-Sausage clusters and the age–metallicity curve from Limberg et al. (2022). This figure shows that all known in situ bulge clusters are older than > 11.5 Gyr, and do not follow an AMR, as is shown by the solid line at 12.5 Gyr. This is the case of a fraction of the new clusters, whereas the other clusters follow the AMR of the ex situ clusters from the dwarf galaxies. Although the age–metallicity curves of different dwarf galaxies are somewhat different, as can be seen for example in Fig. 9 of Callingham et al. (2022), they are sufficiently close for us to plot that relation from Gaia-Enceladus-Sausage.
For a deeper study, better derivations of ages with deeper photometric data are needed. We also note that for AMRs it is important to have relative ages, as well as homogeneous derivations of ages, as is discussed by, for example, Dotter et al. (2011), VandenBerg et al. (2013), and Leaman et al. (2013). We recognize that there are likely systematic differences between the different studies that are at least as large as the assigned random errors. However, a homogenization of ages cannot be found in the literature for either the well-known bulge clusters or the newly identified clusters.
Finally, radial velocity measurements are required to study the cluster orbits. Therefore, no firm conclusion can be drawn yet for the clusters with ages estimated to be lower than 10 Gyr, but in principle they are compatible with an ex situ origin.
4.3. Distances
Figure 5 shows the histogram and distribution of distances to the Sun for the new bulge clusters (Table 1) compared with the compiled distances from Bica et al. (2016, Table 3) and with the full cluster sample. The samples are the same as in Fig. 3 except for the cluster Glimpse02, which has no available distance in the literature.
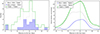 |
Fig. 5. Distribution of distances of the same cluster sample as in Fig. 3. Despite having the same smoothing, the kernel density estimations are noisier than the metallicity ones, but show that the Bica et al. (2016) and the full samples share a peak around 8.0 − 8.1 kpc, as was expected. |
The histogram of new clusters shows two peaks at 7.2 and 8.5 kpc, but the kernel density estimation shows them as a smooth distribution centered around 8.0 kpc. This configuration of the histogram remains for different distance bins. The full cluster sample preserves the distance distribution from Bica et al. (2016), with a peak around 8.0 − 8.1 kpc and a tail pointing to smaller distances. The peak is compatible, within 0.2 kpc, with the Galactic Black Hole distance of dGCenter = 8.178 ± 0.013stat. ± 0.022sys. kpc (GRAVITY Collaboration 2019). More recently, Arakelyan et al. (2018) have found 8.2 kpc using GCs and dwarf galaxies, but although this might appear obvious now, it was not the case with the data available at the time of our estimation of dGCenter = 7.5 kpc (Bica et al. 2006). Bland-Hawthorn & Gerhard (2016) and Griv et al. (2023) provide a historical review of this value.
There is another issue regarding distances, which is the selective-to-total absorption RV value. While the subject is debated, the recent papers by Nataf et al. (2013), Nataf (2016), and Nataf et al. (2021) lean toward a low reddening slope with RV = 2.5. Pottasch & Bernard-Salas (2013), on the other hand, oppose this conclusion (see Stenborg 2016), based on the analysis of spectra of planetary nebulae in the Galactic bulge (at b ∼ 3 − 6°). These authors conclude with a strong statement: “The suggestion that RV is different in the Galactic bulge is incorrect. The reasons for this are discussed”. A reddening problem is also suggested by Vasiliev & Baumgardt (2021), comparing Gaia Early DR3 parallaxes with optical distances of bulge clusters. The inverted parallaxes give longer distances than the optical ones.
Some questions remain, however, such as why we should have such an anomalous reddening law. There is no evidence around the Sun of a reddening law with RV < 3. We may eventually have much higher values.
Another question is whether we have an additional problem of a limiting distance, or a peculiar cloud, between us and the bulge, and in that case where it is. Nataf et al. (2021) discusses a peculiar “great dark lane” when citing Minniti et al. (2014), but there is no theoretical support for this, and it would need very large dust grains. The point is not negligible, because it can also introduce a bias in the age measurements with the isochrones, inducing a trend of age versus Galactocentric distance.
The comparison of the Gaia Early DR3 distances by BV21 with those given in the literature for the new clusters, however, does not help because of the uncertainties in the parallaxes.
5. Conclusions
We compiled a sample of 39 new GCs and two candidates, mostly in the Galactic bulge, which have been identified since the Harris (1996, 2010 edition) catalog and Bica et al. (2016). The number of confirmed bulge GCs in the Galaxy has considerably increased, with the difference being that the new clusters have very low masses. The new full sample of bulge clusters shows a metallicity distribution with peaks at [Fe/H] = −1.08 ± 0.35 and −0.51 ± 0.25 dex.
The age–metallicity plot shows two different aspects: all well-known bulge clusters are older than 11.5 Gyr, and 13 of the new clusters are in this category; that is, they are all old and no AMR is seen, as has been shown by studies in the literature, such as those by Forbes & Bridges (2010), Forbes (2020), Kruijssen et al. (2020), and Callingham et al. (2022).
For the 11 clusters younger than 11.5 Gyr, the AMR appears to be compatible with that of the ex situ dwarf galaxies Sagittarius, Canis Majoris, and Gaia-Enceladus-Sausage.
Finally, we conclude that it is likely that very few, if any, other massive GCs in the Galactic bulge are still to be found, although we cannot exclude that massive clusters with low densities remain undetected. Given the dense environment, it is expected that some of the lowest mass clusters could also be dispersing, and thus be missed in the dense bulge field.
A next step in the study of these clusters should be spectroscopic analyses, in particular to derive their radial velocities. This will allow us to derive their orbits and to better understand their origin.
Acknowledgments
We are grateful to the referee for very helpful suggestions, and to Stefano O. Souza for helpful comments. EB and BB acknowledge partial financial support from CAPES – Finance code 001, CNPq and FAPESP. SO acknowledges support from PRIN MIUR2022 Progetto “CHRONOS” (PI: S. Cassisi) financed by the European Union – Next Generation EU, the support of the University of Padova, DOR Piotto 2022, Italy. RAPO acknowledges the FAPESP PhD fellowship 2018/22181-0. Note added in proof. After having this paper accepted, we became aware of a paper dealing with a similar subject by Garro et al. (2024). Our approach is dedicated to the globular clusters of the Galactic bulge, while their approach is directed to the full sample of Galactic globular clusters.
References
- Alves-Brito, A., Barbuy, B., Zoccali, M., et al. 2006, A&A, 460, 269 [NASA ADS] [CrossRef] [EDP Sciences] [Google Scholar]
- Arakelyan, N. R., Pilipenko, S. V., & Libeskind, N. I. 2018, MNRAS, 481, 918 [NASA ADS] [CrossRef] [Google Scholar]
- Barbá, R. H., Minniti, D., Geisler, D., et al. 2019, ApJ, 870, L24 [CrossRef] [Google Scholar]
- Barbuy, B., Ortolani, S., & Bica, E. 1997, A&AS, 122, 483 [NASA ADS] [CrossRef] [EDP Sciences] [Google Scholar]
- Barbuy, B., Ortolani, S., & Bica, E. 1998, A&AS, 132, 333 [NASA ADS] [CrossRef] [EDP Sciences] [Google Scholar]
- Barbuy, B., Ortolani, S., Bica, E., & Desidera, S. 1999a, A&A, 348, 783 [NASA ADS] [Google Scholar]
- Barbuy, B., Renzini, A., Ortolani, S., Bica, E., & Guarnieri, M. D. 1999b, A&A, 341, 539 [NASA ADS] [Google Scholar]
- Barbuy, B., Zoccali, M., Ortolani, S., et al. 2009, A&A, 507, 405 [NASA ADS] [CrossRef] [EDP Sciences] [Google Scholar]
- Barbuy, B., Cantelli, E., Vemado, A., et al. 2016, A&A, 591, A53 [NASA ADS] [CrossRef] [EDP Sciences] [Google Scholar]
- Barbuy, B., Chiappini, C., & Gerhard, O. 2018a, ARA&A, 56, 223 [Google Scholar]
- Barbuy, B., Muniz, L., Ortolani, S., et al. 2018b, A&A, 619, A178 [NASA ADS] [CrossRef] [EDP Sciences] [Google Scholar]
- Barbuy, B., Cantelli, E., Muniz, L., et al. 2021, A&A, 654, A29 [NASA ADS] [CrossRef] [EDP Sciences] [Google Scholar]
- Baumgardt, H., & Vasiliev, E. 2021, MNRAS, 505, 5957 [NASA ADS] [CrossRef] [Google Scholar]
- Belokurov, V., & Kravtsov, A. 2024, MNRAS, 528, 3198 [CrossRef] [Google Scholar]
- Belokurov, V., Erkal, D., Evans, N. W., Koposov, S. E., & Deason, A. J. 2018, MNRAS, 478, 611 [Google Scholar]
- Bica, E., Ortolani, S., & Barbuy, B. 1994, A&A, 283, 67 [NASA ADS] [Google Scholar]
- Bica, E., Ortolani, S., & Barbuy, B. 1996, A&AS, 120, 153 [NASA ADS] [CrossRef] [EDP Sciences] [Google Scholar]
- Bica, E., Bonatto, C., Barbuy, B., & Ortolani, S. 2006, A&A, 450, 105 [NASA ADS] [CrossRef] [EDP Sciences] [Google Scholar]
- Bica, E., Ortolani, S., & Barbuy, B. 2016, PASA, 33, e028 [Google Scholar]
- Bica, E., Pavani, D. B., Bonatto, C. J., & Lima, E. F. 2019, AJ, 157, 12 [Google Scholar]
- Bland-Hawthorn, J., & Gerhard, O. 2016, ARA&A, 54, 529 [Google Scholar]
- Borissova, J., Ivanov, V. D., Lucas, P. W., et al. 2018, MNRAS, 481, 3902 [NASA ADS] [CrossRef] [Google Scholar]
- Bressan, A., Fagotto, F., Bertelli, G., & Chiosi, C. 1993, A&AS, 100, 647 [NASA ADS] [Google Scholar]
- Bruzual, G., Barbuy, B., Ortolani, S., et al. 1997, AJ, 114, 1531 [NASA ADS] [CrossRef] [Google Scholar]
- Butler, E., Kunder, A., Prudil, Z., et al. 2024, ApJ, 963, L33 [NASA ADS] [CrossRef] [Google Scholar]
- Callingham, T. M., Cautun, M., Deason, A. J., et al. 2022, MNRAS, 513, 4107 [NASA ADS] [CrossRef] [Google Scholar]
- Camargo, D. 2018, ApJ, 860, L27 [Google Scholar]
- Camargo, D., & Minniti, D. 2019, MNRAS, 484, L90 [Google Scholar]
- Carretta, E., Bragaglia, A., Gratton, R., D’Orazi, V., & Lucatello, S. 2009, A&A, 508, 695 [NASA ADS] [CrossRef] [EDP Sciences] [Google Scholar]
- Carretta, E., Cohen, J. G., Gratton, R. G., & Behr, B. B. 2001, AJ, 122, 1469 [NASA ADS] [CrossRef] [Google Scholar]
- Cohen, R. E., Bellini, A., Casagrande, L., et al. 2021, AJ, 162, 228 [NASA ADS] [CrossRef] [Google Scholar]
- Crestani, J., Alves-Brito, A., Bono, G., Puls, A. A., & Alonso-García, J. 2019, MNRAS, 487, 5463 [Google Scholar]
- Crociati, C., Valenti, E., Ferraro, F. R., et al. 2023, ApJ, 951, 17 [NASA ADS] [CrossRef] [Google Scholar]
- Dias, B., Barbuy, B., Saviane, I., et al. 2016, A&A, 590, A9 [NASA ADS] [CrossRef] [EDP Sciences] [Google Scholar]
- Dias, B., Palma, T., Minniti, D., et al. 2022, A&A, 657, A67 [NASA ADS] [CrossRef] [EDP Sciences] [Google Scholar]
- Dongwook, L., Koch-Hansen, A. J., Sang-Hyun, C., & Seungsoo, H. 2022, A&A, 666, A62 [NASA ADS] [CrossRef] [EDP Sciences] [Google Scholar]
- Dotter, A., Chaboyer, B., Jevremović, D., et al. 2008, ApJS, 178, 89 [Google Scholar]
- Dotter, A., Sarajedini, A., & Anderson, J. 2011, ApJ, 738, 74 [NASA ADS] [CrossRef] [Google Scholar]
- Ernandes, H., Dias, B., Barbuy, B., et al. 2019, A&A, 632, A103 [EDP Sciences] [Google Scholar]
- Fernández-Trincado, J. G., Zamora, O., Souto, D., et al. 2019, A&A, 627, A178 [Google Scholar]
- Fernández-Trincado, J. G., Minniti, D., Beers, T. C., et al. 2020, A&A, 643, A145 [Google Scholar]
- Fernández-Trincado, J. G., Beers, T. C., Minniti, D., et al. 2021a, A&A, 647, A64 [EDP Sciences] [Google Scholar]
- Fernández-Trincado, J. G., Minniti, D., Souza, S. O., et al. 2021b, ApJ, 908, L42 [Google Scholar]
- Fernández-Trincado, J. G., Minniti, D., Garro, E. R., & Villanova, S. 2022, A&A, 657, A84 [NASA ADS] [CrossRef] [EDP Sciences] [Google Scholar]
- Ferraro, F. R., Massari, D., Dalessandro, E., et al. 2016, ApJ, 828, 75 [NASA ADS] [CrossRef] [Google Scholar]
- Ferraro, F. R., Pallanca, C., Lanzoni, B., et al. 2021, Nat. Astron., 5, 311 [Google Scholar]
- Forbes, D. A. 2020, MNRAS, 493, 847 [Google Scholar]
- Forbes, D. A., & Bridges, T. 2010, MNRAS, 404, 1203 [NASA ADS] [Google Scholar]
- Gaia Collaboration (Vallenari, A., et al.) 2023, A&A, 674, A1 [NASA ADS] [CrossRef] [EDP Sciences] [Google Scholar]
- Garro, E. R., Minniti, D., Gómez, M., et al. 2020, A&A, 642, L19 [EDP Sciences] [Google Scholar]
- Garro, E. R., Minniti, D., Gómez, M., et al. 2021, A&A, 649, A86 [NASA ADS] [CrossRef] [EDP Sciences] [Google Scholar]
- Garro, E. R., Minniti, D., Alessi, B., et al. 2022a, A&A, 659, A155 [NASA ADS] [CrossRef] [EDP Sciences] [Google Scholar]
- Garro, E. R., Minniti, D., Gómez, M., et al. 2022b, A&A, 658, A120 [NASA ADS] [CrossRef] [EDP Sciences] [Google Scholar]
- Garro, E. R., Minniti, D., Gómez, M., et al. 2022c, A&A, 662, A95 [NASA ADS] [CrossRef] [EDP Sciences] [Google Scholar]
- Garro, E. R., Fernández-Trincado, J. G., Minniti, D., et al. 2023, A&A, 669, A136 [NASA ADS] [CrossRef] [EDP Sciences] [Google Scholar]
- Garro, E. R., Minniti, D., & Fernández-Trincado, J. G., 2024, A&A, in press https://doi.org/10.1051/0004-6361/202347389 [Google Scholar]
- Geisler, D., Villanova, S., O’Connell, J. E., et al. 2021, A&A, 652, A157 [NASA ADS] [CrossRef] [EDP Sciences] [Google Scholar]
- Geisler, D., Parisi, M. C., Dias, B., et al. 2023, A&A, 669, A115 [NASA ADS] [CrossRef] [EDP Sciences] [Google Scholar]
- González-Díaz, D., Fernández-Trincado, J. G., Villanova, S., et al. 2023, MNRAS, 526, 6274 [CrossRef] [Google Scholar]
- Gran, F., Zoccali, M., Contreras Ramos, R., et al. 2019, A&A, 628, A45 [NASA ADS] [CrossRef] [EDP Sciences] [Google Scholar]
- Gran, F., Zoccali, M., Saviane, I., et al. 2022, MNRAS, 509, 4962 [Google Scholar]
- Gran, F., Kordopatis, G., Zoccali, M., et al. 2024, A&A, 683, A167 [NASA ADS] [CrossRef] [EDP Sciences] [Google Scholar]
- GRAVITY Collaboration (Abuter, R., et al.) 2019, A&A, 625, L10 [NASA ADS] [CrossRef] [EDP Sciences] [Google Scholar]
- Griv, E., Jiang, I.-G., Majaess, D., & Minniti, D. 2023, Astrophys. Space Sci., 368 [CrossRef] [Google Scholar]
- Guarnieri, M. D., Ortolani, S., Montegriffo, P., et al. 1998, A&A, 331, 70 [NASA ADS] [Google Scholar]
- Harris, W. E. 1996, AJ, 112, 1487 [Google Scholar]
- Helmi, A., Babusiaux, C., Koppelman, H. H., et al. 2018, Nature, 563, 85 [Google Scholar]
- Horta, D., Schiavon, R. P., Mackereth, J. T., et al. 2023, MNRAS, 520, 5671 [NASA ADS] [CrossRef] [Google Scholar]
- Husser, T.-O., Latour, M., Brinchmann, J., et al. 2020, A&A, 635, A114 [NASA ADS] [CrossRef] [EDP Sciences] [Google Scholar]
- Ivanov, V. D., Kurtev, R., & Borissova, J. 2005, A&A, 442, 195 [NASA ADS] [CrossRef] [EDP Sciences] [Google Scholar]
- Johnson, C. I., Caldwell, N., Rich, R. M., Pilachowski, C. A., & Hsyu, T. 2016, AJ, 152, 21 [Google Scholar]
- Jönsson, H., Ryde, N., Schultheis, M., & Zoccali, M. 2017, A&A, 598, A101 [NASA ADS] [CrossRef] [EDP Sciences] [Google Scholar]
- Jordán, A., McLaughlin, D. E., Côté, P., et al. 2007, ApJS, 171, 101 [CrossRef] [Google Scholar]
- Kerber, L. O., Nardiello, D., Ortolani, S., et al. 2018, ApJ, 853, 15 [Google Scholar]
- Kerber, L. O., Libralato, M., Souza, S. O., et al. 2019, MNRAS, 484, 5530 [Google Scholar]
- Kruijssen, J. M. D., Pfeffer, J. L., Reina-Campos, M., Crain, R. A., & Bastian, N. 2019, MNRAS, 486, 3180 [Google Scholar]
- Kruijssen, J. M. D., Pfeffer, J. L., Chevance, M., et al. 2020, MNRAS, 498, 2472 [NASA ADS] [CrossRef] [Google Scholar]
- Kurtev, R., Ivanov, V. D., Borissova, J., & Ortolani, S. 2008, A&A, 489, 583 [NASA ADS] [CrossRef] [EDP Sciences] [Google Scholar]
- Leaman, R., VandenBerg, D. A., & Mendel, J. T. 2013, MNRAS, 436, 122 [Google Scholar]
- Limberg, G., Souza, S. O., Pérez-Villegas, A., et al. 2022, ApJ, 935, 109 [NASA ADS] [CrossRef] [Google Scholar]
- Marín-Franch, A., Aparicio, A., Piotto, G., et al. 2009, ApJ, 694, 1498 [Google Scholar]
- Massari, D., Mucciarelli, A., Ferraro, F. R., et al. 2014, ApJ, 795, 22 [NASA ADS] [CrossRef] [Google Scholar]
- Massari, D., Koppelman, H. H., & Helmi, A. 2019, A&A, 630, L4 [NASA ADS] [CrossRef] [EDP Sciences] [Google Scholar]
- Meissner, F., & Weiss, A. 2006, A&A, 456, 1085 [CrossRef] [EDP Sciences] [Google Scholar]
- Meléndez, J., Barbuy, B., Bica, E., et al. 2003, A&A, 411, 417 [NASA ADS] [CrossRef] [EDP Sciences] [Google Scholar]
- Minniti, D., Lucas, P. W., Emerson, J. P., et al. 2010, Nat. Astron., 15, 433 [NASA ADS] [Google Scholar]
- Minniti, D., Hempel, M., Toledo, I., et al. 2011, A&A, 527, A81 [NASA ADS] [CrossRef] [EDP Sciences] [Google Scholar]
- Minniti, D., Saito, R. K., Gonzalez, O. A., et al. 2014, A&A, 571, A91 [NASA ADS] [CrossRef] [EDP Sciences] [Google Scholar]
- Minniti, D., Schlafly, E. F., Palma, T., et al. 2018, ApJ, 866, 12 [Google Scholar]
- Minniti, D., Fernández-Trincado, J. G., Gómez, M., et al. 2021a, A&A, 650, L11 [NASA ADS] [CrossRef] [EDP Sciences] [Google Scholar]
- Minniti, D., Fernández-Trincado, J. G., Smith, L. C., et al. 2021b, A&A, 648, A86 [NASA ADS] [CrossRef] [EDP Sciences] [Google Scholar]
- Minniti, D., Palma, T., Camargo, D., et al. 2021c, A&A, 652, A129 [NASA ADS] [CrossRef] [EDP Sciences] [Google Scholar]
- Minniti, D., Matsunaga, N., Fernández-Trincado, J. G., et al. 2024, A&A, 683, A150 [NASA ADS] [CrossRef] [EDP Sciences] [Google Scholar]
- Moni Bidin, C., Mauro, F., Geisler, D., et al. 2011, A&A, 535, A33 [NASA ADS] [CrossRef] [EDP Sciences] [Google Scholar]
- Montecinos, C., Villanova, S., Muñoz, C., & Cortés, C. C. 2021, MNRAS, 503, 4336 [NASA ADS] [CrossRef] [Google Scholar]
- Muñoz, C., Geisler, D., Villanova, S., et al. 2018, A&A, 620, A96 [Google Scholar]
- Myeong, G. C., Vasiliev, E., Iorio, G., Evans, N. W., & Belokurov, V. 2019, MNRAS, 488, 1235 [Google Scholar]
- Nataf, D. M. 2016, PASA, 33, e024 [CrossRef] [Google Scholar]
- Nataf, D. M., Gould, A., Fouqué, P., et al. 2013, ApJ, 769, 88 [Google Scholar]
- Nataf, D. M., Cassisi, S., Casagrande, L., Yuan, W., & Riess, A. G. 2021, ApJ, 910, 121 [NASA ADS] [CrossRef] [Google Scholar]
- Ness, M., Freeman, K., Athanassoula, E., et al. 2013, MNRAS, 430, 836 [NASA ADS] [CrossRef] [Google Scholar]
- Obasi, C., Gómez, M., Minniti, D., & Alonso-García, J. 2021, A&A, 654, A39 [NASA ADS] [CrossRef] [EDP Sciences] [Google Scholar]
- Oliveira, R. A. P., Souza, S. O., Kerber, L. O., et al. 2020, ApJ, 891, 37 [Google Scholar]
- Oliveira, R. A. P., Ortolani, S., Barbuy, B., et al. 2022, A&A, 657, A123 [NASA ADS] [CrossRef] [EDP Sciences] [Google Scholar]
- Origlia, L., & Rich, R. M. 2004, AJ, 127, 3422 [Google Scholar]
- Origlia, L., Rich, R. M., & Castro, S. 2002, AJ, 123, 1559 [Google Scholar]
- Ortolani, S., Barbuy, B., & Bica, E. 1994, A&AS, 108, 653 [NASA ADS] [Google Scholar]
- Ortolani, S., Bica, E., & Barbuy, B. 1997, A&A, 326, 614 [NASA ADS] [Google Scholar]
- Ortolani, S., Barbuy, B., & Bica, E. 1999a, A&AS, 136, 237 [NASA ADS] [CrossRef] [EDP Sciences] [Google Scholar]
- Ortolani, S., Barbuy, B., Bica, E., et al. 1999b, A&A, 350, 840 [NASA ADS] [Google Scholar]
- Ortolani, S., Bica, E., & Barbuy, B. 1999c, A&AS, 138, 267 [NASA ADS] [CrossRef] [EDP Sciences] [Google Scholar]
- Ortolani, S., Bica, E., & Barbuy, B. 2000, A&A, 361, L57 [NASA ADS] [Google Scholar]
- Ortolani, S., Barbuy, B., Bica, E., Zoccali, M., & Renzini, A. 2007, A&A, 470, 1043 [NASA ADS] [CrossRef] [EDP Sciences] [Google Scholar]
- Ortolani, S., Bonatto, C., Bica, E., Barbuy, B., & Saito, R. K. 2012, AJ, 144, 147 [Google Scholar]
- Ortolani, S., Held, E. V., Nardiello, D., et al. 2019a, A&A, 627, A145 [NASA ADS] [CrossRef] [EDP Sciences] [Google Scholar]
- Ortolani, S., Nardiello, D., Pérez-Villegas, A., Bica, E., & Barbuy, B. 2019b, A&A, 622, A94 [NASA ADS] [CrossRef] [EDP Sciences] [Google Scholar]
- Pallanca, C., Lanzoni, B., Ferraro, F. R., et al. 2021, ApJ, 913, 137 [NASA ADS] [CrossRef] [Google Scholar]
- Peñaloza, F., Pessev, P., Vaśquez, S., et al. 2015, PASP, 127, 329 [CrossRef] [Google Scholar]
- Pérez-Villegas, A., Barbuy, B., Kerber, L. O., et al. 2020, MNRAS, 491, 3251 [Google Scholar]
- Pietrinferni, A., Cassisi, S., Salaris, M., & Castelli, F. 2006, ApJ, 642, 797 [Google Scholar]
- Pottasch, S. R., & Bernard-Salas, J. 2013, A&A, 550, A35 [NASA ADS] [CrossRef] [EDP Sciences] [Google Scholar]
- Queiroz, A. B. A., Anders, F., Chiappini, C., et al. 2020, A&A, 638, A76 [NASA ADS] [CrossRef] [EDP Sciences] [Google Scholar]
- Queiroz, A. B. A., Chiappini, C., Perez-Villegas, A., et al. 2021, A&A, 656, A156 [NASA ADS] [CrossRef] [EDP Sciences] [Google Scholar]
- Renzini, A., Gennaro, M., Zoccali, M., et al. 2018, ApJ, 863, 16 [NASA ADS] [CrossRef] [Google Scholar]
- Rich, R. M., Ortolani, S., Bica, E., & Barbuy, B. 1998, AJ, 116, 1295 [Google Scholar]
- Ryu, J., & Lee, M. G. 2018, ApJ, 863, L38 [NASA ADS] [CrossRef] [Google Scholar]
- Saracino, S., Dalessandro, E., Ferraro, F. R., et al. 2016, ApJ, 832, 48 [Google Scholar]
- Saviane, I., Da Costa, G. S., Held, E. V., et al. 2012, A&A, 540, A27 [NASA ADS] [CrossRef] [EDP Sciences] [Google Scholar]
- Simpson, J. D. 2018, MNRAS, 477, 4565 [NASA ADS] [CrossRef] [Google Scholar]
- Simpson, J. D., De Silva, G., Martell, S. L., Navin, C. A., & Zucker, D. B. 2017, MNRAS, 472, 2856 [NASA ADS] [CrossRef] [Google Scholar]
- Souza, S. O., Kerber, L. O., Barbuy, B., et al. 2020, ApJ, 890, 38 [Google Scholar]
- Souza, S. O., Valentini, M., Barbuy, B., et al. 2021, A&A, 656, A78 [NASA ADS] [CrossRef] [EDP Sciences] [Google Scholar]
- Souza, S. O., Ernandes, H., Valentini, M., et al. 2023, A&A, 671, A45 [NASA ADS] [CrossRef] [EDP Sciences] [Google Scholar]
- Stenborg, T. N. 2016, PhD Thesis, Macquarie University, Department of Physics and Astronomy, Australia [Google Scholar]
- VandenBerg, D. A., Brogaard, K., Leaman, R., & Casagrande, L. 2013, ApJ, 775, 134 [Google Scholar]
- VandenBerg, D. A., Bergbusch, P. A., Ferguson, J. W., & Edvardsson, B. 2014, ApJ, 794, 72 [NASA ADS] [CrossRef] [Google Scholar]
- Vasiliev, E., & Baumgardt, H. 2021, MNRAS, 505, 5978 [NASA ADS] [CrossRef] [Google Scholar]
- Vásquez, S., Saviane, I., Held, E. V., et al. 2018, A&A, 619, A13 [Google Scholar]
- Villanova, S., Moni Bidin, C., Mauro, F., Munoz, C., & Monaco, L. 2017, MNRAS, 464, 2730 [Google Scholar]
- Villanova, S., Monaco, L., Geisler, D., et al. 2019, ApJ, 882, 174 [NASA ADS] [CrossRef] [Google Scholar]
- Weiland, J. L., Arendt, R. G., Berriman, G. B., et al. 1994, ApJ, 425, L81 [NASA ADS] [CrossRef] [Google Scholar]
- Wright, E. L., Eisenhardt, P. R. M., Mainzer, A. K., et al. 2010, AJ, 140, 1868 [Google Scholar]
- Zoccali, M., Barbuy, B., Hill, V., et al. 2004, A&A, 423, 507 [NASA ADS] [CrossRef] [EDP Sciences] [Google Scholar]
- Zoccali, M., Vasquez, S., Gonzalez, O. A., et al. 2017, A&A, 599, A12 [NASA ADS] [CrossRef] [EDP Sciences] [Google Scholar]
All Tables
Literature data on the 41 newly identified GCs and candidates, reporting coordinates, reddening, distance to the Sun, metallicity, age, proper motions, magnitudes, and assignation to a Galactic stellar population.
Bulge GCs from Bica et al. (2016), with distances, ages, and metallicity values from the literature, in order of right ascension.
All Figures
|
Fig. 1. Location in Galactic coordinates of bulge clusters, including a) projected bulge globular clusters (cf. Bica et al. 2016), represented by filled circles, with [Fe/H] > −0.8 (red); −1.3 < [Fe/H] < −0.8 (gold); [Fe/H] < −1.3 (blue); halo clusters: aquamarine open circles; cluster farther from the Galactic center than RC > 4.5 kpc: green open squares; b) candidate clusters (open black squares); c) newly confirmed clusters located in the region (blue filled squares). The Galactic center is illustrated by the blue filled circle. Contours correspond to COBE/DIRBE outline of the bulge from Weiland et al. (1994), and adapted from Jönsson et al. (2017). |
| In the text | |
|
Fig. 2. Absolute magnitude, MV, of the new cluster sample compared to the literature. Left panel: histogram of the 36 of the 41 new clusters from Table 1 with available MV (solid blue histogram), compared to H10 (156 clusters, solid black histogram) and bulge clusters Bica et al. (2016), 42 clusters) plus UKS 1 (dashed gray histogram). Right panel: Kernel density estimation of the three distributions, with a Gaussian kernel and normalized y axis. A low-luminosity tail is seen in the three samples between MV ∼ −5 and −4 mag. |
| In the text | |
|
Fig. 3. Metallicities of full sample of bulge clusters. Left panel: histogram of metallicity including the 42 well-known bulge clusters from Bica et al. (2016) and the new sample clusters, excluding clusters classified as belonging to the halo and disk, those that have [Fe/H] < −1.5 dex, and clusters that have distances out of the range of 4 < d⊙ < 11 kpc. A histogram combining both samples is also shown in green. Right panel: Kernel density estimation, showing the distribution peaks independently of the bin size: Bica et al. (2016) with peaks in −1.05 and −0.40 dex, the new cluster sample with peaks in −1.20 and −0.55 dex, and the combined sample with a higher peak consistent with Bica et al. (2016) but with a smaller peak shifted to a more metal-poor value (dashed lines: −1.08 ± 0.35 and −0.51 ± 0.25 dex). |
| In the text | |
|
Fig. 4. Metallicity vs. age for the new clusters that have these values available, compared with the Bica et al. (2016) sample, and with the Sagittarius and Canis Majoris clusters identified in Forbes & Bridges (2010) labeled as FB10, with updates from Kruijssen et al. (2019) labeled as K+19, and Gaia-Enceladus-Sausage with clusters identified in Limberg et al. (2022). Bulge clusters from Table 3 are represented by filled red squares; old clusters from Table 1 by filled blue squares; clusters from Table 1 younger than 10 Gyr by filled gold squares; clusters from Sagittarius by open magenta circles; clusters from Canis Majoris by open green circles; clusters from GSE by open blue circles; ages of 12.5 ± 0.3 Gyr by black lines; and the model and uncertainties from Forbes & Bridges (2010) by green lines. The old bulge clusters are all old and show no AMR, as is indicated by the straight black line with an age of 12.0 Gyr. Dark green curves represent the best fit of the AMR to the GSE sample from Limberg et al. (2022), and ±3σ curves. The lower age limits for five of the new clusters are represented by arrows. The error bar in the upper right corner indicates the typical errors of 0.2 dex in [Fe/H] and 1.0 Gyr in age. |
| In the text | |
|
Fig. 5. Distribution of distances of the same cluster sample as in Fig. 3. Despite having the same smoothing, the kernel density estimations are noisier than the metallicity ones, but show that the Bica et al. (2016) and the full samples share a peak around 8.0 − 8.1 kpc, as was expected. |
| In the text | |
Current usage metrics show cumulative count of Article Views (full-text article views including HTML views, PDF and ePub downloads, according to the available data) and Abstracts Views on Vision4Press platform.
Data correspond to usage on the plateform after 2015. The current usage metrics is available 48-96 hours after online publication and is updated daily on week days.
Initial download of the metrics may take a while.