Fig. 4.

Download original image
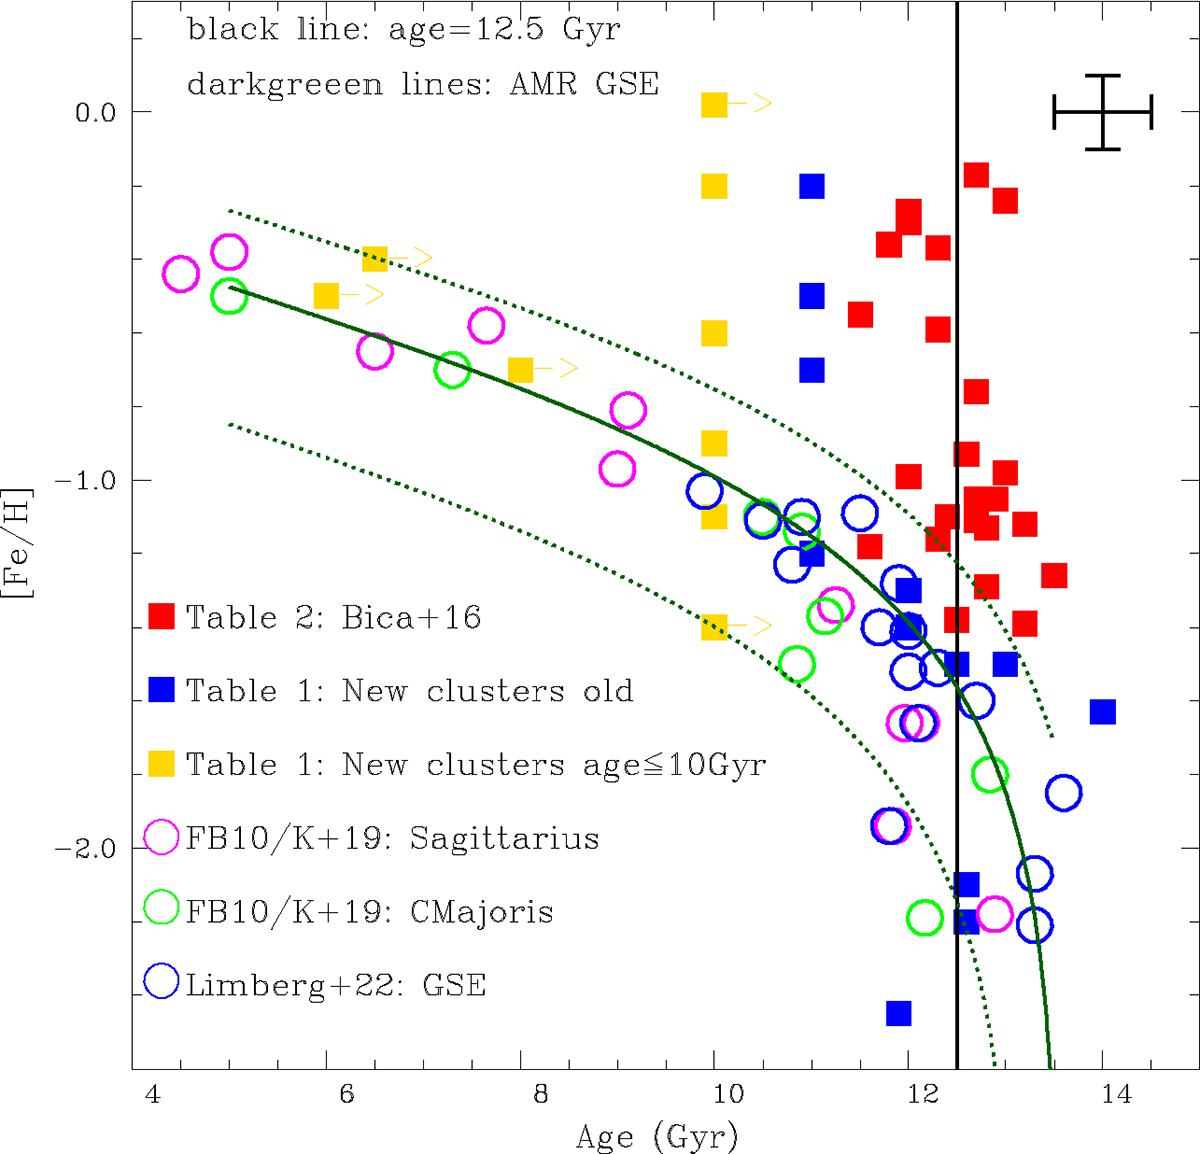
Metallicity vs. age for the new clusters that have these values available, compared with the Bica et al. (2016) sample, and with the Sagittarius and Canis Majoris clusters identified in Forbes & Bridges (2010) labeled as FB10, with updates from Kruijssen et al. (2019) labeled as K+19, and Gaia-Enceladus-Sausage with clusters identified in Limberg et al. (2022). Bulge clusters from Table 3 are represented by filled red squares; old clusters from Table 1 by filled blue squares; clusters from Table 1 younger than 10 Gyr by filled gold squares; clusters from Sagittarius by open magenta circles; clusters from Canis Majoris by open green circles; clusters from GSE by open blue circles; ages of 12.5 ± 0.3 Gyr by black lines; and the model and uncertainties from Forbes & Bridges (2010) by green lines. The old bulge clusters are all old and show no AMR, as is indicated by the straight black line with an age of 12.0 Gyr. Dark green curves represent the best fit of the AMR to the GSE sample from Limberg et al. (2022), and ±3σ curves. The lower age limits for five of the new clusters are represented by arrows. The error bar in the upper right corner indicates the typical errors of 0.2 dex in [Fe/H] and 1.0 Gyr in age.
Current usage metrics show cumulative count of Article Views (full-text article views including HTML views, PDF and ePub downloads, according to the available data) and Abstracts Views on Vision4Press platform.
Data correspond to usage on the plateform after 2015. The current usage metrics is available 48-96 hours after online publication and is updated daily on week days.
Initial download of the metrics may take a while.


