| Issue |
A&A
Volume 686, June 2024
|
|
|---|---|---|
| Article Number | L12 | |
| Number of page(s) | 8 | |
| Section | Letters to the Editor | |
| DOI | https://doi.org/10.1051/0004-6361/202450566 | |
| Published online | 12 June 2024 | |
Letter to the Editor
Recovery of the X-ray polarisation of Swift J1727.8−1613 after the soft-to-hard spectral transition
1
Astronomical Institute of the Czech Academy of Sciences, Boční II 1401/1, 14100 Praha 4, Czech Republic
e-mail: This email address is being protected from spambots. You need JavaScript enabled to view it.
2
Department of Physics and Astronomy, 20014 University of Turku, Finland
3
Nordita, KTH Royal Institute of Technology and Stockholm University, Hannes Alfvéns väg 12, 10691 Stockholm, Sweden
4
Space Research Institute, Russian Academy of Sciences, Profsoyuznaya 84/32, 117997 Moscow, Russia
5
NASA Marshall Space Flight Center, Huntsville, AL 35812, USA
6
Dipartimento di Matematica e Fisica, Università degli Studi Roma Tre, Via della Vasca Navale 84, 00146 Roma, Italy
7
School of Mathematics, Statistics, and Physics, Newcastle University, Newcastle upon Tyne NE1 7RU, UK
8
INAF Istituto di Astrofisica e Planetologia Spaziali, Via del Fosso del Cavaliere 100, 00133 Roma, Italy
9
INAF Osservatorio Astronomico di Cagliari, Via della Scienza 5, 09047 Selargius, (CA), Italy
10
Physics Department, McDonnell Center for the Space Sciences, and Center for Quantum Leaps, Washington University in St. Louis, St. Louis, MO 63130, USA
11
Université Grenoble Alpes, CNRS, IPAG, 38000 Grenoble, France
12
INAF Istituto di Astrofisica Spaziale e Fisica Cosmica, Via U. La Malfa 153, 90146 Palermo, Italy
13
Center for Astrophysics | Harvard & Smithsonian, 60 Garden Street, Cambridge, MA 02138, USA
14
Anton Pannekoek Institute for Astronomy, Amsterdam, Science Park 904, 1098 NH, The Netherlands
15
Astronomical Institute, Faculty of Mathematics and Physics, Charles University, V Holešovičkách 2, 18000 Prague 8, Czech Republic
16
Department of Physics, University of Warwick, Gibbet Hill Road, Coventry CV4 7AL, UK
17
X-ray Astrophysics Laboratory, NASA Goddard Space Flight Center, Greenbelt, MD 20771, USA
18
California Institute of Technology, Pasadena, CA 91125, USA
19
Agenzia Spaziale Italiana, Via della Scienza 5, 09047 Selargius (CA), Italy
20
Dipartimento di Fisica e Astronomia, Università degli Studi di Padova, Via Marzolo 8, 35131 Padova, Italy
21
Dipartimento di Fisica, Università degli Studi di Milano, Via Celoria 16, 20133 Milano, Italy
22
Instituto de Astrofísica de Canarias, 38205 La Laguna, Tenerife, Spain
23
Departamento de Astrofísica, Universidad de La Laguna, 38206 La Laguna, Tenerife, Spain
24
Department of Physics and Astronomy, Louisiana State University, Baton Rouge, LA 70803, USA
25
Physics Department, Tor Vergata University of Rome, Via della Ricerca Scientifica 1, 00133 Rome, Italy
26
INFN – Rome Tor Vergata, Via della Ricerca Scientifica 1, 00133 Rome, Italy
27
Graduate Institute of Astronomy, National Central University, 300 Zhongda Road, Zhongli, Taoyuan 32001, Taiwan
28
Laboratory for Space Research, The University of Hong Kong, Cyberport 4, Hong Kong
29
National Astronomical Observatories, Chinese Academy of Sciences, 20A Datun Road, 100101 Beijing, PR China
30
Kapteyn Astronomical Institute, University of Groningen, PO Box 800 9700 AV Groningen, The Netherlands
Received:
30
April
2024
Accepted:
22
May
2024
Abstract
We report on the detection of X-ray polarisation in the black-hole X-ray binary Swift J1727.8−1613 during its dim hard spectral state by the Imaging X-ray Polarimetry Explorer (IXPE). This is the first detection of X-ray polarisation at the transition from the soft to the hard state in an X-ray binary. We find an averaged 2–8 keV polarisation degree of (3.3 ± 0.4)% and a corresponding polarisation angle of 3° ±4°, which matches the polarisation detected during the rising stage of the outburst, in September–October 2023, within 1σ uncertainty. The observational campaign complements previous studies of this source and enables comparison of the X-ray polarisation properties of a single transient across the X-ray hardness-intensity diagram. The complete recovery of the X-ray polarisation properties, including the energy dependence, came after a dramatic drop in the X-ray polarisation during the soft state. The new IXPE observations in the dim hard state at the reverse transition indicate that the accretion properties, including the geometry of the corona, appear to be strikingly similar to the bright hard state during the outburst rise despite the X-ray luminosities differing by two orders of magnitude.
Key words: accretion / accretion disks / black hole physics / polarization / X-rays: binaries / X-rays: individuals: Swift J1727.8−1613
© The Authors 2024
 Open Access article, published by EDP Sciences, under the terms of the Creative Commons Attribution License (https://creativecommons.org/licenses/by/4.0), which permits unrestricted use, distribution, and reproduction in any medium, provided the original work is properly cited.
This article is published in open access under the Subscribe to Open model. This email address is being protected from spambots. You need JavaScript enabled to view it. to support open access publication.
1. Introduction
Black-hole X-ray binary systems (BHXRBs) are unique cosmic laboratories for studying accretion physics in strong gravity. Particularly in the X-ray band, these systems are known to abruptly change their spectral and timing properties on timescales of weeks to months, implying changes in their innermost accretion configuration. In the X-ray hardness-intensity diagram, BHXRBs typically follow a hysteresis behaviour, resulting in a q-like curve that spans more than an order of magnitude in both directions with anti-clockwise evolution, often repeating multiple cycles (e.g. Remillard & McClintock 2006).
In the ‘hard’ state, the X-ray spectrum is dominated by a power law, originating from multiple Compton up-scatterings of low-energy disc or synchrotron seed photons in a hot optically thin corona or inner hot accretion flow (Sunyaev & Titarchuk 1980; Zdziarski & Gierliński 2004; Done et al. 2007; Poutanen & Veledina 2014). Most of the known BHXRBs are transients, exhibiting a strong and sudden increase in X-ray flux in a hard spectral state, before transiting through ‘intermediate’ states to the ‘soft’ state (e.g. Belloni 2010). Such a transition occurs when there is a relative decrease in the hard power-law contribution with respect to the thermal emission from the accretion disc (Shakura & Sunyaev 1973; Novikov & Thorne 1973), the latter becoming dominant in the soft state. The hard state is usually associated with a significant accretion disc truncation up to a few tens of gravitational radii from the central stellar-mass black hole and with a presence of radio-emitting relativistic jets in polar directions (e.g. Fender et al. 2004; Done et al. 2007; Belloni 2010). Conversely, the soft state is characterised by a geometrically thin and optically thick accretion disc that extends to the innermost stable circular orbit and by quenched radio emission. After the X-ray flux decays, typically by about an order of magnitude from its peak outburst values, BHXRBs exhibit a reversed transition towards a power-law-dominated X-ray spectrum, and a re-launch of collimated bipolar radio ejecta is observed. Finally, the ‘dim hard’ state is reached, and sources decay towards quiescence.
In late August 2023, several teams reported a bright outburst (∼7 Crab in the 2–20 keV energy range) of a new X-ray transient, Swift J1727.8−1613 (Kennea 2023; Negoro et al. 2023). Subsequent X-ray spectroscopy (Liu et al. 2023; Sunyaev et al. 2023; Peng et al. 2024), signatures of type-C quasi-periodic oscillations (QPOs; Palmer & Parsotan 2023; Draghis et al. 2023; Bollemeijer et al. 2023a; Zhao et al. 2024), properties of the emitted radio jet (Miller-Jones et al. 2023; Bright et al. 2023), and optical spectroscopy (Mata Sánchez et al. 2024) all suggested a BHXRB classification. This was further confirmed by the anticipated transition through intermediate states towards the soft state over the next month (Trushkin et al. 2023; Ingram et al. 2024), which was accompanied by quenching of the QPOs (Bollemeijer et al. 2023b) and a subsequent decrease in the 2–20 keV flux by more than two orders of magnitude between October 2023 and February 2024 (Svoboda et al. 2024). Monitor of All-sky X-ray Image (MAXI; Matsuoka et al. 2009) revealed that the source, while still displaying relatively high X-ray photon rates (0.2 ph s−1 cm−2 in 2–20 keV), began its transition towards the dim hard state around 2024 March 11 (Podgorný et al. 2024). The onset of the reverse transition was immediately confirmed by a corresponding radio detection of the compact jet (Russell et al. 2024) with the Australia Telescope Compact Array.
X-ray polarimetry is known for its potential to unravel the innermost accretion geometry (e.g. Rees 1975; Connors & Stark 1977; Sunyaev & Titarchuk 1985; Haardt & Matt 1993; Matt 1993; Poutanen & Svensson 1996; Dovčiak et al. 2008). The many theoretical studies can now be confronted with data from observations with the Imaging X-ray Polarimetry Explorer (IXPE; launched in December 2021; Weisskopf et al. 2022), which enables 2–8 keV linear polarisation degree (PD) and polarisation angle (PA) measurements with remarkable precision. The BHXRB Cyg X-1 was observed by IXPE in its hard state (with a PD of ∼4% in the 2–8 keV band; Krawczynski et al. 2022) and its subsequent highly variable soft state (PD of ∼2% in 2–8 keV; Dovčiak et al. 2023; Steiner et al., in prep.). The PA in both periods was aligned with the observed projected radio jet directions within the uncertainties, indicating that a coronal plasma elongated in the accretion disc plane was the cause of the detected polarisation (e.g. Poutanen & Svensson 1996; Ursini et al. 2022; Krawczynski & Beheshtipour 2022). Analogous results for X-ray polarisation from a Comptonised power law were also reported for the active galactic nuclei NGC 4151 (Gianolli et al. 2023) and IC 4329A (Ingram et al. 2023).
Swift J1727.8−1613 was first observed by IXPE in the hard to hard-intermediate state close to the outburst peak (Veledina et al. 2023) and multiple times in the subsequent intermediate states (Ingram et al. 2024). The averaged 2–8 keV PD decreased monotonically from ∼4% to ∼3%. The IXPE-measured PA was in all cases aligned with the radio, sub-millimetre, and optical PA (Ingram et al. 2024; Vrtilek et al. 2023; Kravtsov et al. 2023), indicating a similar alignment with the projected time-averaged jet orientation and similar coronal properties to the sources mentioned above. In all of the aforementioned IXPE polarisation observations, either the measured polarisation fraction was statistically favoured to increase with energy between 2–8 keV, with the associated PA consistent with being constant with energy, or the energy dependence of the polarisation was unconstrained.
More recently, the source was also observed by IXPE during its soft state (Svoboda et al. 2024). It was caught in an already decaying phase, with the X-ray flux about two orders of magnitude lower than during the peak of the outburst. Compared to the hard and intermediate states of Swift J1727.8−1613, this observation revealed a substantial drop in the X-ray polarisation, showing only an averaged 2–8 keV 1.2% upper limit on the PD, which indicates that the polarisation properties sensitively correspond to the changes in the spectral state. The upper limit of the PD is consistent with the expectations of polarisation coming from emission from an optically thick accretion disc at low or intermediate inclination.
In this Letter we report on a new IXPE observation of Swift J1727.8−1613, performed during its dim hard state just after the soft-to-hard transition. Comparison with the previous IXPE observations provides the until now missing X-ray polarimetric measurement at the end of the BHXRB’s outburst, enabling us to compare X-ray polarimetric properties of a single source across the entire hardness-intensity diagram for the first time.
2. Observations and data reduction
2.1. MAXI
The MAXI monitoring of Swift J1727.8−1613 (Matsuoka et al. 2009) allowed us to characterise its broadband X-ray spectral properties on a daily basis. Using the MAXI ‘on-demand’ service, in the same way as in Svoboda et al. (2024), we traced the evolution of the source on the hardness-intensity diagram. The results are shown in Fig. 1 from the beginning of its outburst on 2023 August 24 until 2024 April 22. The position of the source during all previous IXPE observations, 1–7 (Veledina et al. 2023; Ingram et al. 2024; Svoboda et al. 2024), and the new observation, 8, is indicated. The MAXI data confirm that IXPE newly observed Swift J1727.8−1613 in the dim hard state, after which the source continued to decay towards quiescence. During the last IXPE exposure, the time-averaged X-ray luminosity was about two orders of magnitude lower than during its peak outburst, but the X-ray hardness was close to that in IXPE observation 3.
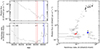 |
Fig. 1. Evolution of the flux and hardness ratio of Swift J1727.8−1613. The photon flux in the 2–20 keV range is shown in the upper-left panel. The hardness ratio, i.e. the ratio of the photon flux in the 4–10 and 2–4 keV bands, is shown in the lower-left panel. The fluxes are the 3-day averages from MAXI. The hardness-intensity diagram (right) goes from the beginning of the outburst until 2024 April 22. We indicate the initial five observations in the hard and intermediate states by IXPE (described in detail in Veledina et al. 2023; Ingram et al. 2024) as black stars, labelled 1–5. The two observations in the soft state (described in detail in Svoboda et al. 2024) are marked by the red triangles, labelled 6 and 7. The new IXPE observation in the dim hard state, reported in this paper, is marked by the blue diamond symbol and labelled 8. |
2.2. IXPE
The IXPE mission (Weisskopf et al. 2022) operates with three detector units (DUs) on board. The reported new IXPE observation of Swift J1727.8−1613 in the dim hard state (ObsID: 03005801) was taken between UTC 15:46:55 on 2024 April 3 and UTC 02:24:41 on 2024 April 8, with a total live time of 202 ks. The Level-2 data were downloaded from the HEASARC archive. We used the xpselect tool from the IXPEOBSSIM software (version 31.0.1; Baldini et al. 2022) to filter the source region, which was selected as a circle with a radius of 100″. We did not subtract the background, because the source was sufficiently bright (Di Marco et al. 2023). The weighted Stokes I, Q, and U spectra were obtained with the xselect tool from the HEASOFT package (version 6.33.1), using the command extract “SPECT” stokes=SIMPLE. We used the HEASOFT tool ixpecalcarf on the event and attitude files of each DU (weight=2, i.e. simple weighting) to work with the most up-to-date IXPE responses (v13). We did not re-bin the original IXPE data for the analysis below. We used the 2–8 keV energy range.
For the spectro-polarimetric analysis, we used XSPEC (version 12.14.0; Arnaud 1996). All reported uncertainties are at the 68.3% confidence level for one model parameter if not mentioned otherwise.
3. Results
In this section we provide a time-integrated analysis of the IXPE data of Swift J1727.8–1613 across observation 8. The IXPE light curve is shown in Fig. A.1. The flux decays during the observation but no strong spectral variability is detected, and therefore, we proceeded with the analysis of the time-integrated spectra. We followed the steps for the spectro-polarimetric analysis that were used in Veledina et al. (2023), Ingram et al. (2024), and Svoboda et al. (2024). We performed a joint spectro-polarimetric fit of the Stokes I, Q, and U spectra from all three DUs, tying the individual model parameters between the DUs except a cross-normalisation constant factor, const, that accounts for the different absolute flux calibration of each DU. We used the tbabs model (Wilms et al. 2000) to account for line-of-sight absorption. We fixed the hydrogen column density, NH = 0.24 × 1022 cm−2, to the value obtained from the spectral fit of the soft-state X-ray spectrum (Svoboda et al. 2024). Given the limited spectral capability of IXPE, we only assumed two major spectral components in the total 2–8 keV range. The thermal component is represented by the diskbb model and contains a multi-temperature disc blackbody emission with peak temperature kTin and a normalisation parameter. The Comptonised emission is represented by the powerlaw model with a photon index Γ. The averaged 2–8 keV polarisation properties were obtained with a simple phenomenological model, polconst, that assumes a constant PD and PA with energy in a given range. The full XSPEC notation of the model is
 (1)
(1)
Using the total 2–8 keV range, we obtained χ2/d.o.f. = 1329/1333. The best-fit spectral parameter values are listed in Table 1. The unfolded Stokes I, Q, and U spectra are shown in Fig. 2, along with the best-fit model and residuals. The spectrum is well described by a relatively hard power law with a photon index Γ ≈ 1.7, with a very low contribution from the thermal component in the 2–8 keV range (< 2% in flux). For polarisation model polconst, we get PD = (3.3 ± 0.4) % and PA = 3° ±4°. Figure 3 shows the obtained 2D contours from XSPEC for different confidence levels between the 2–8 keV PD and PA in a polar plot.
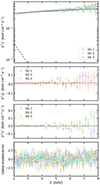 |
Fig. 2. X-ray time-averaged spectra of Swift J1727.8–1613 in the dim hard state (observation 8), as obtained from IXPE DU 1, DU 2, and DU 3. We show the unfolded Stokes parameters I, Q, and U, multiplied by E2, alongside the best-fit Model (1) from XSPEC. The total model is shown with solid lines for all Stokes parameters. For Stokes I, we also display the diskbb component (with dashed lines) and the powerlaw component (with dotted lines) to illustrate that the contribution of the thermal component was very low in the 2–8 keV band, according to the IXPE data. The bottom panel shows the fit residuals. The Q and U data were re-binned by energy for plotting purposes only (using the XSPEC command setplot rebin 10.0 5). |
To examine the energy dependence of the detected X-ray polarisation, we fixed all parameter values from the best fit of Model (1) at the 2–8 keV energy range except for the polconst parameters, which were allowed to vary. With ΔE = 1 keV energy binning, we fitted Model (1) for each energy bin between 2 and 8 keV. The energy-dependent PD and PA are shown in Fig. 3 and compared to the previously reported energy-dependent results for observations 3 and 4 from Ingram et al. (2024), obtained in a similar way.
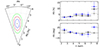 |
Fig. 3. Polarisation results from IXPE. Left: averaged PD and PA in the 2–8 keV band, as obtained from XSPEC with Model (1) for observation 8, including the contours of the 68.3% (blue), 95.5% (red), and 99.7% (green) confidence levels. The PA of 0° corresponds to the north direction, with positive values increasing eastwards. Right: PD and PA as a function of energy, as obtained from XSPEC with Model (1) for the same observation, 8 (blue diamonds). For comparison, we also show the energy dependence of polarisation for observations 3 (black circles) and 4 (grey squares) from Ingram et al. (2024), obtained in a similar way. The uncertainties are given at the 68.3% confidence level for one model parameter. |
To test whether the data from observation 8 favour a linear change in polarisation with energy over a constant-polarisation energy profile, we compared the best fit with Model (1) at 2–8 keV with the same model, but using pollin instead of polconst:
 (2)
(2)
The pollin model has four parameters that set PD(E)=PD1 + PDslope(E − 1 keV) and PA(E)=PA1 + PAslope(E − 1 keV). We verified that letting PAslope vary does not significantly improve χ2 compared to freezing it to zero, and hence we froze PAslope to zero for the rest of the analysis. Following Ingram et al. (2024), we defined a new parameter, PD5 = PD1 + 4PDslope, so that the constant PD we fit is shifted to 5 keV (in the middle of the 2–8 keV IXPE bandpass) instead of the original 1 keV. We obtained χ2/d.o.f. = 1323/1332. The best-fit spectral parameter values did not vary from Model (1) within the uncertainties. The best-fit polarisation values were PD5 = (4.8 ± 0.7)%, PDslope = (1.0 ± 0.4)% keV−1, and PA1 = 1° ±4°. These results mean that the second fit with pollin is only marginally preferred over the polconst model. We performed an F test between the two best-fit solutions (as in Ingram et al. 2024) and conclude that the PD increases with energy at a 2.5σ confidence.
4. Discussion
We observe the same X-ray polarisation properties in the hard (and hard-intermediate) state of Swift J1727.8−1613 during the rising and decaying stages of the outburst, within 1σ uncertainties (Veledina et al. 2023; Ingram et al. 2024). The energy-dependent values of PD and PA closely resemble the previous hard-state observations, showing a slight increase in PD with energy and a rather constant PA. Similar polarisation properties were also reported for the BHXRB Cyg X-1 in the hard state (Krawczynski et al. 2022) and for the nucleus of NGC 4151 (Gianolli et al. 2023), indicating a common accretion geometry. The new results suggest that the optically thin Comptonising medium in the decaying hard state of Swift J1727.8−1613 is elongated in the accretion disc plane – perpendicular to the presumed time-averaged radio jet direction in the rising hard state. Unfortunately, due to the relative radio faintness of the source during the reverse transition (Russell et al. 2024), radio polarisation measurements were not carried out (the radio PD of a compact jet is expected to only be < 1–3%, i.e. below the sensitivity limits of the observations that were reported; Fender 2006). Figure 4 shows the averaged 2–8 keV PD and PA of Swift J1727.8−1613 versus X-ray hardness, as measured by IXPE from the beginning of its outburst, including the new observation. Despite the source being two orders of magnitude less luminous during observation 8 than during the outburst peak, the X-ray polarisation data in the dim hard state are consistent with the trend of an increasing PD and a constant PA with increasing X-ray spectral hardness, which was previously reported for the hard-to-soft transition (Ingram et al. 2024; Svoboda et al. 2024). The source experienced a significant drop in X-ray polarisation fraction when reaching the soft state. This supports the basic deduction from X-ray spectroscopy that the physical properties of the accretion flow changed between the canonical hard and soft states (Svoboda et al. 2024).
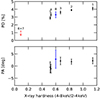 |
Fig. 4. PD and PA averaged in the 2–8 keV band as a function of X-ray hardness for all IXPE observations of Swift J1727.8−1613, as measured by IXPE. This plot is an update of Fig. 5 from Svoboda et al. (2024). The red arrow signifies the 1.2% upper limit on the PD (with the PA unconstrained) at the 99% confidence level, as obtained in the soft state (observations 6 and 7 combined; Svoboda et al. 2024). Observation 8, of the dim hard state, is shown in blue. Observations 1–5, of the peak outburst (Veledina et al. 2023; Ingram et al. 2024), are shown in black. |
BHXRB transients are known to follow the q-shape track in the hardness-intensity diagram (Belloni 2010). An interesting feature is the presence of hysteresis in their path: the source attains the same hardness (corresponding to the same spectral slope) at different luminosities. For Swift J1727.8−1613, this difference reaches two orders of magnitude. For the spectrum shaped by thermal Comptonisation, its spectral index is mostly determined by two parameters: the Thomson optical depth of the hot medium, τT, and the electron temperature, kTe (e.g. Beloborodov 1999). Secondary effects are imposed by the characteristic energy of seed photons and the geometry. Here we considered the slab geometry, which gives the maximal PD for fixed other parameters. For the observed two-orders-of-magnitude drop in luminosity in Swift J1727.7−1613, it is natural to expect a change in the parameters of the hot medium, while preserving the spectral slope. Because the τT of the hot medium is expected to drop linearly with the decrease in the mass accretion rate, Ṁ (e.g. Eq. (11) in Yuan & Narayan 2014), the electron temperature has to increase to conserve the spectral slope; a lower scattering probability is compensated for by a higher energy shift in each scattering order. The decrease in τT leads to an increase in PD for photons scattered many times in the medium (e.g. Sunyaev & Titarchuk 1985). On the other hand, an increase in kTe induces stronger aberration effects, leading to a drop in the PD (Poutanen 1994). This means that the spectral slope and the PD depend mostly on the same two parameters, and the mutual cancellation of their effect on both the spectral index and PD, if at all possible, may require some fine-tuning.
To find the conditions whereby Γ and the PD can be the same despite the orders-of-magnitude different luminosities, we computed a set of Comptonisation models in a slab geometry with the seed soft synchrotron photons peaking at 1 eV (Veledina et al. 2013; Poutanen & Veledina 2014; Yuan & Narayan 2014). That could be relevant for 30 Schwarzschild radii, assuming a certain distribution of the magnetic field and optical depth in the hot accretion flow (Eqs. (3) and (13) in Veledina et al. 2013), but the exact number has a minor effect on the resulting PD since in the IXPE range we see high scattering orders. Thus, the only parameters of the problem are kTe and τT. Simulations were done using the compps code (Poutanen & Svensson 1996; Veledina & Poutanen 2022; Poutanen et al. 2023). The Comptonisation spectra observed at inclination i = 45° were fitted in the 2–8 keV energy band with a power law to determine Γ, and the PD was read at 4 keV. The contours of constant Γ and PD are shown in Fig. 5. We see that there are indeed two solutions corresponding to the observed values of Γ and PD; the τT of the two solutions differ by a factor of 10. If the corresponding Ṁ also differs by the same factor, we have to conclude that the luminosity scales as Ṁ2, as is predicted for advection-dominated accretion flows (Narayan & Yi 1995). Our model also predicts that kTe ∼ 250 keV in the dim hard state, implying that no spectral cutoff should be observed up to ∼300 keV.
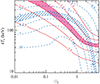 |
Fig. 5. Contour plot of constant photon index, Γ (solid red), and the PD in percent (dashed blue) on the plane electron temperature, kTe, versus Thomson optical depth, τT, computed for Comptonisation in a slab observed at inclination i = 45°. The pink band represents the range Γ = 1.7–1.9, which corresponds to the hard state spectra observed in Swift J1727.8−1613. The blue hatched band corresponds to the PD of 3–4% observed during observations 3, 4, and 8. The two bands cross each other in two regions where τT differs by an order of magnitude. |
We note that very similar polarisation signatures could be obtained for the case when seed photons are coming from the truncated disc, as long as the characteristic peak energy is considerably lower than the softest energy probed by IXPE (see e.g. Fig. S9 in Krawczynski et al. 2022). On the other hand, if the corona lies on top of the (non-truncated) disc, whose seed photon peak is close to the IXPE range (e.g. as found in a fit to the bright hard state spectrum by Peng et al. 2024), the first Compton scattering order, which has polarisation perpendicular to the disc axis, would be clearly visible at ∼2–3 keV. Higher scattering orders are then polarised along the corona axis (in our case, the disc axis), and hence we expect to have a strong energy dependence of the PD in the IXPE range, potentially even a change in sign of the polarisation (i.e. a rotation of the PA by 90°; Poutanen & Svensson 1996; Krawczynski et al. 2022; Krawczynski & Beheshtipour 2022; Poutanen et al. 2023), but neither of these signatures are observed.
We note that the simulations presented above account for neither general nor special relativistic effects related to the bulk motion of the gas in the close vicinity of a black hole, nor for the effects of non-local scattering. Further observations, especially in the hard X-ray range, as well as more detailed modelling are needed to test our conclusions.
Acknowledgments
We thank the IXPE operation team for their efforts in scheduling the observation. IXPE is a joint US and Italian mission. The US contribution is supported by the National Aeronautics and Space Administration (NASA) and led and managed by its Marshall Space Flight Center (MSFC), with industry partner Ball Aerospace (contract NNM15AA18C). The Italian contribution is supported by the Italian Space Agency (Agenzia Spaziale Italiana, ASI) through contract ASI-OHBI-2022-13-I.0, agreements ASI-INAF-2022-19-HH.0 and ASI-INFN-2017.13-H0, and its Space Science Data Center (SSDC) with agreements ASI-INAF-2022-14-HH.0 and ASI-INFN 2021-43-HH.0, and by the Istituto Nazionale di Astrofisica (INAF) and the Istituto Nazionale di Fisica Nucleare (INFN) in Italy. This research used data products provided by the IXPE Team (MSFC, SSDC, INAF, and INFN) and distributed with additional software tools by the High-Energy Astrophysics Science Archive Research Center (HEASARC), at NASA Goddard Space Flight Center (GSFC). This research has used the MAXI data provided by RIKEN, JAXA, and the MAXI team. J.Pod., J.S., M.D., and S.R.D. thank GACR project 21-06825X for the support and institutional support from RVO:67985815. A.V. thanks the Academy of Finland grant 355672 and the Minobrnauki grant 23-075-67362-1-0409-000105 for support. Nordita is supported in part by NordForsk. S.B., F.C. and F.M. thank the INAF grant 1.05.23.05.06: “Spin and Geometry in accreting X-ray binaries: The first multi frequency spectro-polarimetric campaign”. A.I. acknowledges support from the Royal Society. The work of G.Matt, F.M., L.M., and R.T. is partially supported by the PRIN grant 2022LWPEXW of the Italian Ministry of University and Research (MUR). P.-O.P. thanks the French Space Agency (CNES). M.B. acknowledges the support from GAUK project No. 102323. V.K. acknowledges support from the Finnish Cultural Foundation. G.Mas. acknowledges financial support from the European Union’s Horizon Europe research and innovation programme under the Marie Skłodowska-Curie grant agreement No. 101107057. T.M-D. acknowledges support from the Spanish Agencia estatal de investigación via PID2021-124879NB-I00. Y.Z. acknowledges support from the Dutch Research Council (NWO) Rubicon Fellowship, file No. 019.231EN.021.
References
- Arnaud, K. A. 1996, in Astronomical Data Analysis Software and Systems V, eds. G. H. Jacoby, & J. Barnes (San Francisco: ASP), ASP Conf. Ser., 101, 17 [NASA ADS] [Google Scholar]
- Baldini, L., Bucciantini, N., Lalla, N. D., et al. 2022, SoftwareX, 19, 101194 [NASA ADS] [CrossRef] [Google Scholar]
- Belloni, T. M. 2010, in The Jet Paradigm (Berlin: Springer Verlag), Lect. Notes Phys., 794, 53 [NASA ADS] [CrossRef] [Google Scholar]
- Beloborodov, A. M. 1999, in High Energy Processes in Accreting Black Holes, eds. J. Poutanen, & R. Svensson (San Francisco: ASP), ASP Conf. Ser., 161, 295 [Google Scholar]
- Bollemeijer, N., Uttley, P., Buisson, D., et al. 2023a, ATel, 16247, 1 [NASA ADS] [Google Scholar]
- Bollemeijer, N., Uttley, P., Buisson, D., et al. 2023b, ATel, 16273, 1 [NASA ADS] [Google Scholar]
- Bright, J., Farah, W., Fender, R., et al. 2023, ATel, 16228, 1 [NASA ADS] [Google Scholar]
- Connors, P. A., & Stark, R. F. 1977, Nature, 269, 128 [Google Scholar]
- Di Marco, A., Soffitta, P., Costa, E., et al. 2023, AJ, 165, 143 [CrossRef] [Google Scholar]
- Done, C., Gierliński, M., & Kubota, A. 2007, A&A Rev, 15, 1 [CrossRef] [Google Scholar]
- Dovčiak, M., Muleri, F., Goosmann, R. W., Karas, V., & Matt, G. 2008, MNRAS, 391, 32 [CrossRef] [Google Scholar]
- Dovčiak, M., Steiner, J. F., Krawczynski, H., & Svoboda, J. 2023, ATel, 16084, 1 [Google Scholar]
- Draghis, P. A., Miller, J. M., Homan, J., et al. 2023, ATel, 16219, 1 [NASA ADS] [Google Scholar]
- Fender, R. 2006, in Compact stellar X-ray sources, eds. W. Lewin, & M. van der Klis (Cambridge: Cambridge University Press), Cambridge Astrophysics Series, 39, 381 [NASA ADS] [CrossRef] [Google Scholar]
- Fender, R. P., Belloni, T. M., & Gallo, E. 2004, MNRAS, 355, 1105 [NASA ADS] [CrossRef] [Google Scholar]
- Gianolli, V. E., Kim, D. E., Bianchi, S., et al. 2023, MNRAS, 523, 4468 [NASA ADS] [CrossRef] [Google Scholar]
- Haardt, F., & Matt, G. 1993, MNRAS, 261, 346 [NASA ADS] [CrossRef] [Google Scholar]
- Ingram, A., Ewing, M., Marinucci, A., et al. 2023, MNRAS, 525, 5437 [CrossRef] [Google Scholar]
- Ingram, A., Bollemeijer, N., Veledina, A., et al. 2024, ApJ, in press, [arXiv:2311.05497] [Google Scholar]
- Kennea, J. A., & Swift Team 2023, GRB Coordinates Network, 34540, 1 [Google Scholar]
- Kravtsov, V., Nitindala, A. P., Veledina, A., et al. 2023, ATel, 16245, 1 [NASA ADS] [Google Scholar]
- Krawczynski, H., & Beheshtipour, B. 2022, ApJ, 934, 4 [NASA ADS] [CrossRef] [Google Scholar]
- Krawczynski, H., Muleri, F., Dovčiak, M., et al. 2022, Science, 378, 650 [NASA ADS] [CrossRef] [Google Scholar]
- Liu, H. Y., Li, D. Y., Pan, H. W., et al. 2023, ATel, 16210, 1 [NASA ADS] [Google Scholar]
- Mata Sánchez, D., Muñoz-Darias, T., Armas Padilla, M., Casares, J., & Torres, M. A. P. 2024, A&A, 682, L1 [NASA ADS] [CrossRef] [EDP Sciences] [Google Scholar]
- Matsuoka, M., Kawasaki, K., Ueno, S., et al. 2009, PASJ, 61, 999 [Google Scholar]
- Matt, G. 1993, MNRAS, 260, 663 [NASA ADS] [CrossRef] [Google Scholar]
- Miller-Jones, J. C. A., Sivakoff, G. R., Bahramian, A., & Russell, T. D. 2023, ATel, 16211, 1 [NASA ADS] [Google Scholar]
- Narayan, R., & Yi, I. 1995, ApJ, 452, 710 [NASA ADS] [CrossRef] [Google Scholar]
- Negoro, H., Serino, M., Nakajima, M., et al. 2023, GRB Coordinates Network, 34544, 1 [Google Scholar]
- Novikov, I. D., & Thorne, K. S. 1973, Black Holes (Les Astres Occlus) (New York: Gordon& Breach), 343 [Google Scholar]
- Palmer, D. M., & Parsotan, T. M. 2023, ATel, 16215, 1 [NASA ADS] [Google Scholar]
- Peng, J.-Q., Zhang, S., Shui, Q.-C., et al. 2024, ApJ, 960, L17 [CrossRef] [Google Scholar]
- Podgorný, J., Svoboda, J., & Dovciak, M. 2024, ATel, 16541, 1 [Google Scholar]
- Poutanen, J. 1994, ApJS, 92, 607 [NASA ADS] [CrossRef] [Google Scholar]
- Poutanen, J., & Svensson, R. 1996, ApJ, 470, 249 [CrossRef] [Google Scholar]
- Poutanen, J., & Veledina, A. 2014, Space Sci. Rev., 183, 61 [CrossRef] [Google Scholar]
- Poutanen, J., Veledina, A., & Beloborodov, A. M. 2023, ApJ, 949, L10 [NASA ADS] [CrossRef] [Google Scholar]
- Rees, M. J. 1975, MNRAS, 171, 457 [NASA ADS] [CrossRef] [Google Scholar]
- Remillard, R. A., & McClintock, J. E. 2006, ARA&A, 44, 49 [Google Scholar]
- Russell, T. D., Carotenuto, F., Miller-Jones, J. C. A., et al. 2024, ATel, 16552, 1 [NASA ADS] [Google Scholar]
- Shakura, N. I., & Sunyaev, R. A. 1973, A&A, 24, 337 [NASA ADS] [Google Scholar]
- Sunyaev, R. A., & Titarchuk, L. G. 1980, A&A, 86, 121 [NASA ADS] [Google Scholar]
- Sunyaev, R. A., & Titarchuk, L. G. 1985, A&A, 143, 374 [NASA ADS] [Google Scholar]
- Sunyaev, R. A., Mereminskiy, I. A., Molkov, S. V., et al. 2023, ATel, 16217, 1 [NASA ADS] [Google Scholar]
- Svoboda, J., Dovčiak, M., Steiner, J. F., et al. 2024, ApJ, 966, L35 [NASA ADS] [CrossRef] [Google Scholar]
- Trushkin, S. A., Bursov, N. N., Nizhelskij, N. A., & Tsybulev, P. G. 2023, ATel, 16289, 1 [NASA ADS] [Google Scholar]
- Ursini, F., Matt, G., Bianchi, S., et al. 2022, MNRAS, 510, 3674 [NASA ADS] [CrossRef] [Google Scholar]
- Veledina, A., & Poutanen, J. 2022, Polarization of Comptonized Emission in Slab Geometry (Zenodo) [Google Scholar]
- Veledina, A., Poutanen, J., & Vurm, I. 2013, MNRAS, 430, 3196 [NASA ADS] [CrossRef] [Google Scholar]
- Veledina, A., Muleri, F., Dovčiak, M., et al. 2023, ApJ, 958, L16 [NASA ADS] [CrossRef] [Google Scholar]
- Vrtilek, S. D., Gurwell, M., McCollough, M., & Rao, R. 2023, ATel, 16230, 1 [NASA ADS] [Google Scholar]
- Weisskopf, M. C., Soffitta, P., Baldini, L., et al. 2022, JATIS, 8, 026002 [NASA ADS] [Google Scholar]
- Wilms, J., Allen, A., & McCray, R. 2000, ApJ, 542, 914 [Google Scholar]
- Yuan, F., & Narayan, R. 2014, ARA&A, 52, 529 [NASA ADS] [CrossRef] [Google Scholar]
- Zdziarski, A. A., & Gierliński, M. 2004, Progr. Theor. Phys. Suppl., 155, 99 [NASA ADS] [CrossRef] [Google Scholar]
- Zhao, Q.-C., Tao, L., Li, H.-C., et al. 2024, ApJ, 961, L42 [NASA ADS] [CrossRef] [Google Scholar]
Appendix A: Time analysis
Figure A.1 shows the IXPE light curve in 2–8 keV during observation 8 of Swift J1727.8−1613. The count rate systematically decreased during this observation by about 30%. We show in the same figure that the hardness ratio slightly increased in the meantime, as the source underwent the last phase of the soft-to-hard state transition.
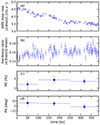 |
Fig. A.1. Time analysis of the IXPE data. (a) IXPE light curve in the 2–8 keV band during observation 8 of Swift J1727.8−1613 with a time bin of 1 ks. (b) Evolution of the IXPE hardness ratio between the 4–8 and 2–4 keV bands. (c) and (d): 2–8 keV PD and PA from IXPE data, respectively, determined using Model (1) in XSPEC in the corresponding restricted time ranges. |
To test whether the X-ray polarisation properties of the source changed between the beginning and the end of observation 8, we performed the same analysis in the 2–8 keV energy range as described in Sect. 3 but for a restricted time range. Using Model (1) in XSPEC, we obtained χ2/dof = 1383/1333, 1396/1333, and 1428/1333 for the time bins 0–100, 100–250, and 250–384 ks since the beginning of observation 8, respectively. The best-fit spectral parameter values are reported in Table A.1. The resulting best-fit PD and PA values are shown in Fig. A.1 for the corresponding time bins. The polarisation properties do not show any significant variation with time despite the nearly monotonically decreasing flux during the observation. However, to claim any spectro-polarimetric properties changing with time within a certain statistical confidence, a more detailed timing analysis is required, preferably using multiple observatories. Such analysis is beyond the scope of this Letter and will be done in a follow-up work.
Best-fit spectral parameter values of the joint IXPE spectro-polarimetric fit in XSPEC with Model (1) for the data restricted to 0–100, 100–250, and 250–384 ks after the start of observation 8.
All Tables
Best-fit spectral parameter values of the joint IXPE spectro-polarimetric fit in XSPEC with Model (1) for the data restricted to 0–100, 100–250, and 250–384 ks after the start of observation 8.
All Figures
|
Fig. 1. Evolution of the flux and hardness ratio of Swift J1727.8−1613. The photon flux in the 2–20 keV range is shown in the upper-left panel. The hardness ratio, i.e. the ratio of the photon flux in the 4–10 and 2–4 keV bands, is shown in the lower-left panel. The fluxes are the 3-day averages from MAXI. The hardness-intensity diagram (right) goes from the beginning of the outburst until 2024 April 22. We indicate the initial five observations in the hard and intermediate states by IXPE (described in detail in Veledina et al. 2023; Ingram et al. 2024) as black stars, labelled 1–5. The two observations in the soft state (described in detail in Svoboda et al. 2024) are marked by the red triangles, labelled 6 and 7. The new IXPE observation in the dim hard state, reported in this paper, is marked by the blue diamond symbol and labelled 8. |
| In the text | |
|
Fig. 2. X-ray time-averaged spectra of Swift J1727.8–1613 in the dim hard state (observation 8), as obtained from IXPE DU 1, DU 2, and DU 3. We show the unfolded Stokes parameters I, Q, and U, multiplied by E2, alongside the best-fit Model (1) from XSPEC. The total model is shown with solid lines for all Stokes parameters. For Stokes I, we also display the diskbb component (with dashed lines) and the powerlaw component (with dotted lines) to illustrate that the contribution of the thermal component was very low in the 2–8 keV band, according to the IXPE data. The bottom panel shows the fit residuals. The Q and U data were re-binned by energy for plotting purposes only (using the XSPEC command setplot rebin 10.0 5). |
| In the text | |
|
Fig. 3. Polarisation results from IXPE. Left: averaged PD and PA in the 2–8 keV band, as obtained from XSPEC with Model (1) for observation 8, including the contours of the 68.3% (blue), 95.5% (red), and 99.7% (green) confidence levels. The PA of 0° corresponds to the north direction, with positive values increasing eastwards. Right: PD and PA as a function of energy, as obtained from XSPEC with Model (1) for the same observation, 8 (blue diamonds). For comparison, we also show the energy dependence of polarisation for observations 3 (black circles) and 4 (grey squares) from Ingram et al. (2024), obtained in a similar way. The uncertainties are given at the 68.3% confidence level for one model parameter. |
| In the text | |
|
Fig. 4. PD and PA averaged in the 2–8 keV band as a function of X-ray hardness for all IXPE observations of Swift J1727.8−1613, as measured by IXPE. This plot is an update of Fig. 5 from Svoboda et al. (2024). The red arrow signifies the 1.2% upper limit on the PD (with the PA unconstrained) at the 99% confidence level, as obtained in the soft state (observations 6 and 7 combined; Svoboda et al. 2024). Observation 8, of the dim hard state, is shown in blue. Observations 1–5, of the peak outburst (Veledina et al. 2023; Ingram et al. 2024), are shown in black. |
| In the text | |
|
Fig. 5. Contour plot of constant photon index, Γ (solid red), and the PD in percent (dashed blue) on the plane electron temperature, kTe, versus Thomson optical depth, τT, computed for Comptonisation in a slab observed at inclination i = 45°. The pink band represents the range Γ = 1.7–1.9, which corresponds to the hard state spectra observed in Swift J1727.8−1613. The blue hatched band corresponds to the PD of 3–4% observed during observations 3, 4, and 8. The two bands cross each other in two regions where τT differs by an order of magnitude. |
| In the text | |
|
Fig. A.1. Time analysis of the IXPE data. (a) IXPE light curve in the 2–8 keV band during observation 8 of Swift J1727.8−1613 with a time bin of 1 ks. (b) Evolution of the IXPE hardness ratio between the 4–8 and 2–4 keV bands. (c) and (d): 2–8 keV PD and PA from IXPE data, respectively, determined using Model (1) in XSPEC in the corresponding restricted time ranges. |
| In the text | |
Current usage metrics show cumulative count of Article Views (full-text article views including HTML views, PDF and ePub downloads, according to the available data) and Abstracts Views on Vision4Press platform.
Data correspond to usage on the plateform after 2015. The current usage metrics is available 48-96 hours after online publication and is updated daily on week days.
Initial download of the metrics may take a while.