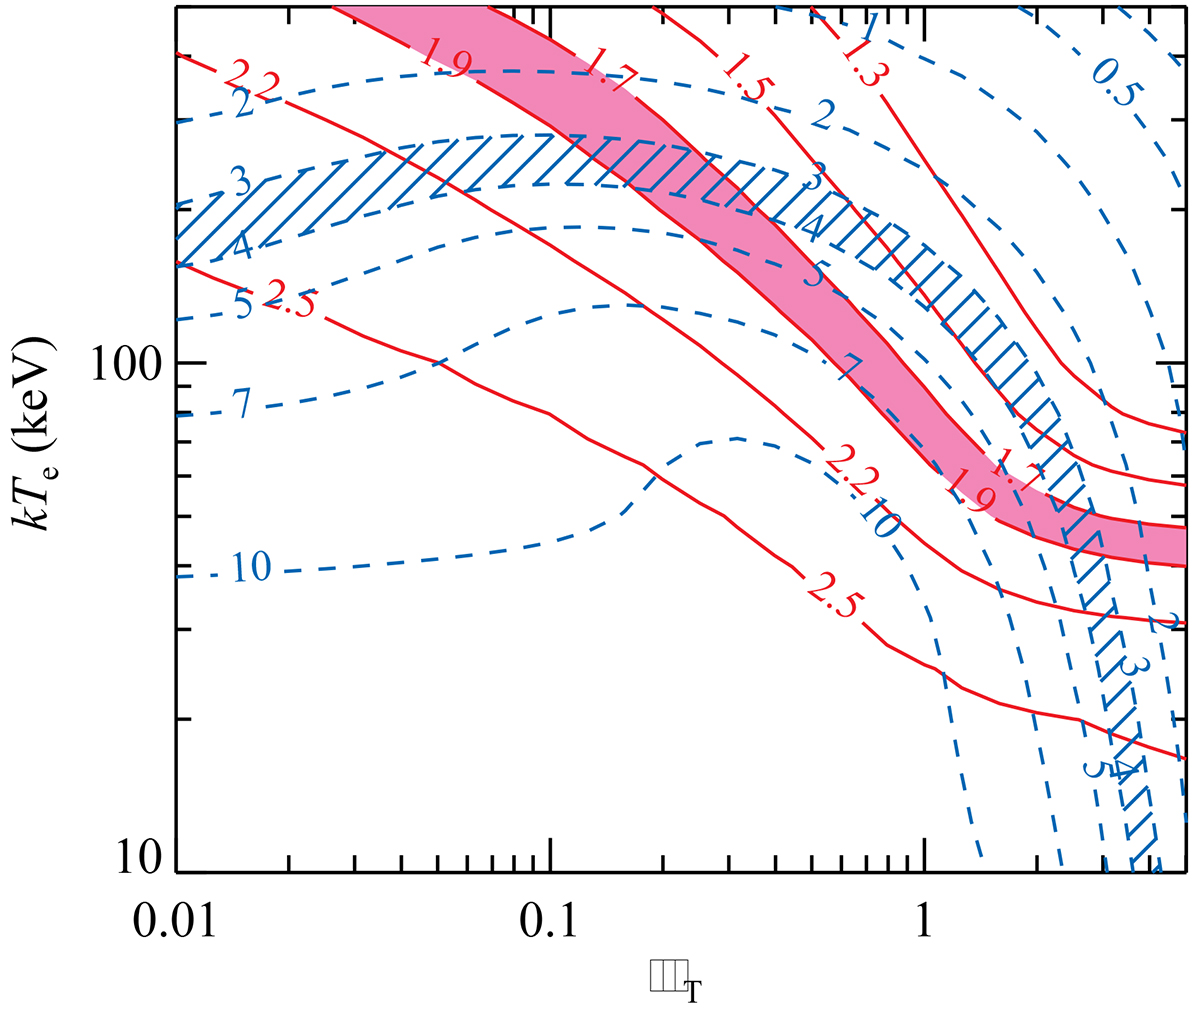
Fig. 5.
Download original image
Contour plot of constant photon index, Γ (solid red), and the PD in percent (dashed blue) on the plane electron temperature, kTe, versus Thomson optical depth, τT, computed for Comptonisation in a slab observed at inclination i = 45°. The pink band represents the range Γ = 1.7–1.9, which corresponds to the hard state spectra observed in Swift J1727.8−1613. The blue hatched band corresponds to the PD of 3–4% observed during observations 3, 4, and 8. The two bands cross each other in two regions where τT differs by an order of magnitude.
Current usage metrics show cumulative count of Article Views (full-text article views including HTML views, PDF and ePub downloads, according to the available data) and Abstracts Views on Vision4Press platform.
Data correspond to usage on the plateform after 2015. The current usage metrics is available 48-96 hours after online publication and is updated daily on week days.
Initial download of the metrics may take a while.