Fig. 4.
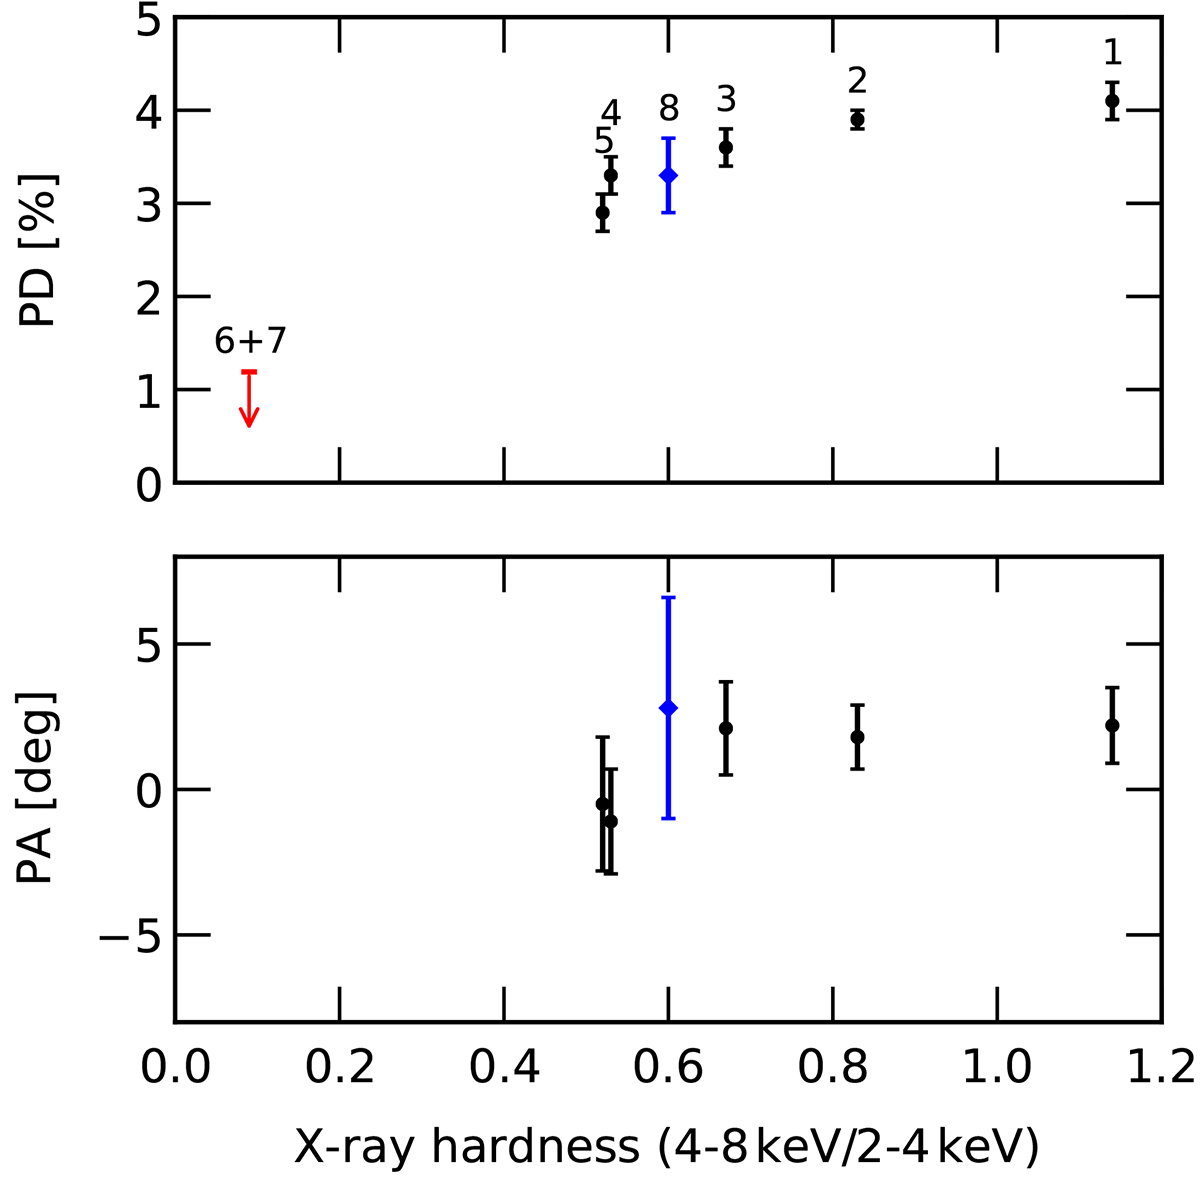
Download original image
PD and PA averaged in the 2–8 keV band as a function of X-ray hardness for all IXPE observations of Swift J1727.8−1613, as measured by IXPE. This plot is an update of Fig. 5 from Svoboda et al. (2024). The red arrow signifies the 1.2% upper limit on the PD (with the PA unconstrained) at the 99% confidence level, as obtained in the soft state (observations 6 and 7 combined; Svoboda et al. 2024). Observation 8, of the dim hard state, is shown in blue. Observations 1–5, of the peak outburst (Veledina et al. 2023; Ingram et al. 2024), are shown in black.
Current usage metrics show cumulative count of Article Views (full-text article views including HTML views, PDF and ePub downloads, according to the available data) and Abstracts Views on Vision4Press platform.
Data correspond to usage on the plateform after 2015. The current usage metrics is available 48-96 hours after online publication and is updated daily on week days.
Initial download of the metrics may take a while.