| Issue |
A&A
Volume 686, June 2024
|
|
|---|---|---|
| Article Number | A143 | |
| Number of page(s) | 7 | |
| Section | Interstellar and circumstellar matter | |
| DOI | https://doi.org/10.1051/0004-6361/202348816 | |
| Published online | 07 June 2024 | |
Episodicity in accretion-ejection processes associated with IRAS 15398-3359
1
Instituto Argentino de Radioastronomía, CCT-La Plata (CONICET),
C.C.5, 1894,
Villa Elisa,
Argentina
e-mail: eguzman@iar.unlp.edu.ar
2
European Southern Observatory,
Alonso de Cordova 3107, Casilla 19, Vitacura,
Santiago,
Chile
3
National Radio Astronomy Observatory,
520 Edgemont Rd.,
Charlottesville,
VA
22903,
USA
Received:
1
December
2023
Accepted:
15
March
2024
Context. The protostar IRAS 15398-3359 is associated with a bipolar molecular outflow ejected in an nearly northeast-southwest (NE–SW) direction, which has been extensively studied. Previous episodic accretion events have been suggested by this source. Furthermore, the analysis of the morphology and kinematics of the molecular outflow revealed the presence of four 12CO (2–1) bipolar elliptical shock-like structures identified in both lobes. These structures seem to trace different ejections inclined ~10° from each other on the plane of the sky. This led to the hypothesis that the outflow axis likely precesses and launches material episodically.
Aims. Since several authors reached the conclusion of the same episodicity scenario by independent observations, IRAS 15398-3359 has become an ideal target to empirically analyze the relationship between accretion and ejection processes.
Methods. We analyzed ALMA archive observations in Band 6, revealing the presence of low-velocity (<3.5 km s−1) emission from the 12CO (2−1) line to the south and north of the protostar. We studied the morphology and kinematics of the gas; our study seems to support the hypothesis of a precessing episodic outflow.
Results. The ALMA observations reveal a north–south (N–S) outflow most likely associated with the IRAS 15398-3359 protostellar system. This outflow could be older than the well-studied NE–SW outflow. The orientation of the N–S outflow is 50°–60° on the plane of the sky away from that of the NE–SW outflow. We also analyzed the spectral energy distribution of a far away young star and preliminarily discard it as the driver of the SE outflow remnants.
Conclusions. The new observations support the hypothesis of strong episodic accretion-ejection events in IRAS 15398-3359, accompanied by dramatic changes in the orientation of its ejection axis, implying that all the outflows in the region may have been driven by the same protostar.
Key words: ISM: jets and outflows / submillimeter: ISM
© The Authors 2024
 Open Access article, published by EDP Sciences, under the terms of the Creative Commons Attribution License (https://creativecommons.org/licenses/by/4.0), which permits unrestricted use, distribution, and reproduction in any medium, provided the original work is properly cited.
This article is published in open access under the Subscribe to Open model. Subscribe to A&A to support open access publication.
1 Introduction
Young stellar outflows are believed to extract angular momentum in protostellar disks, allowing material to accrete onto the central protostar. However, the link between accretion and ejection is difficult to reach observationally due to the confusion among disk, envelope, outflow, and accretion processes; the small scales within the disk; and the inaccuracies of mass estimates. Hence, accretion processes are far from being understood (although, see a few empirical works connecting accretion and ejection processes: Ellerbroek et al. 2013; Kim et al. 2024), and, at the same time, many outflows show perturbations moving them away from the traditional view of the well-behaved bipolar outflow (Cunningham et al. 2009; Vazzano et al. 2021). In this regard, the precession in outflows has usually been related to dynamical interactions of binaries or multiples. However, this effect can be caused in several ways, such as (1) the orbital motion of a binary system, (2) the tidal effect in the disk by a non-coplanar companion, (3) the warp of the inner disk from which the jet is launched, and (4) the misalignment between the spin of the disk and the axis of outflowing ejection (see, e.g., Kwon et al. 2015; Young et al. 2022, and references therein). Precession has been reported in outflows from low-mass protostars such as HH30, HH46-47, or L1157 (Anglada et al. 2007; Arce et al. 2013; Kwon et al. 2015).
Multiple outflows arising apparently from a single young stellar system have been found mostly toward high-mass star-forming regions (e.g., Cepheus A HW2 Cunningham et al. 2009). The so-called binary jets have also been reported to be associated with young low-mass stars (e.g., Murphy et al. 2008), with L1551 IRS5 as a striking example of two jets ejected by two protostars separated by 50 au (e.g., Rodríguez et al. 2003). Although the most straightforward explanation for the multiple outflows is to have as many driving objects as bipolar ejections, in certain cases it has been speculated that two outflows can be driven from the same young star (Kwon et al. 2015; Cunningham et al. 2009). This can be possible if the outflows are sequentially ejected in time and in different directions. The change of direction could be due, for instance, to the tidal interaction of a non-coplanar companion (as in the case of Cepheus A HW2; Cunningham et al. 2009; Zapata et al. 2013). Other plausible scenarios could also explain such extreme systems.
The protostar IRAS 15398-3359 and its associated molecular outflow have been extensively studied. It is a young, low-mass, Class 0 protostellar object located in the Lupus I star-forming region at RA, Dec (J2000) = 15:43:02, −34:09:07. Recent calculations of Lupus I distances based on Gaia DR2 data have revealed that this cloud is located at 153±5pc (Santamaría-Miranda et al. 2021), which is in agreement with the distance derived by Sanchis et al. (2020). IRAS 15398-3359 was first identified by Heyer & Graham (1989). Its associated outflow was first reported by Tachihara et al. (1996) and mapped in several CO transitions by van Kempen et al. (2009b) via single-dish observations.
From high angular-resolution observations of H2CO and CCH obtained with ALMA, Oya et al. (2014) detected the molecular outflow extending in the northeast-southwest (NE-SW) direction (PA 220°) and derived an inclination angle of 20° with respect to the plane of the sky. They estimated an upper limit of 0.09 M⊙ for the protostellar mass. Using SO ALMA observations, Okoda et al. (2018) suggested the presence of a molecular gas disk, which was recently resolved out by Thieme et al. (2023) into a 31.2 au radius structure. In this last work, the authors dynamically derived a protostellar mass of 0.022 M⊙, which is in good agreement with that estimated by Yen et al. (2017) and Okoda et al. (2018). This lower mass value makes IRAS 15398-3359 an object between the proto-brown dwarf and the very low-mass regime. Furthermore, the reported envelope mass ranges from 0.5 (van Kempen et al. 2009a) to 1.2 M⊙ (Jørgensen et al. 2013), suggesting protostellar growth in the future.
Jørgensen et al. (2013) and Bjerkeli et al. (2016) suggested previous episodic accretion events by this source. Jørgensen et al. (2013) detected a H13CO+ ring structure of about 150–200 au around the protostar. The lack of H13CO+ inside the ring is not consistent with the current heating rate of the central pro-tostar. These authors propose that the H13CO+ would have been removed by a chemical reaction with H2O, sublimated from dust grains during an accretion burst that occurred 102–103 years ago. Bjerkeli et al. (2016) also provided evidence for a past accretion event via the study of HDO(10,1 – 00,0). The authors found this molecule is only detected in the region closest to the pro-tostar, and they suggest the fact that the water in the grains was released during a recent accretion burst as a possible explanation. Furthermore, the analysis of the morphology and kinematics of the NE-SW molecular outflow reveal the presence of four pairs of counter-aligning, elliptical, shock-like structures identified in both lobes (Vazzano et al. 2021). These structures seem to trace different ejections inclined ~10° from each other. This led to the hypothesis that the outflow axis likely precesses and launches material episodically. Since several authors reached the conclusion of the same episodicity scenario by independent observations (Jørgensen et al. 2013; Bjerkeli et al. 2016; Vazzano et al. 2021), IRAS 15398-3359 has become an ideal target to empirically analyze the relationship between accretion and ejection processes.
From ALMA 12m array observations in Band 6, Okoda et al. (2021) detect the arc-like structure in H2CO, SiO, CH3OH, and SO crossing the NE–SW molecular outflow in a direction roughly perpendicular. They propose that the observed feature could be part of a relic outflow ejection, previously launched by IRAS 15398-3359. They interpret the difference in the ejection direction of this relic with respect to the direction of the NE–SW outflow as induced by variations in the angular momentum of the episodically accreting gas. These variations could produce a drastic change in the direction of outflow ejection. Alternatively, Vazzano et al. (2021) reveal a complex of 12CO (2–1) and SO (JN=65, 54) arc-like structures, 10″–20″ southeast of the protostar’s location. Some of these structures present bow-shock shapes with tips pointing toward IRAS 15398-3359, suggesting a possible origin linked to the emission of an outflow associated with the source 2MASS 15430576-3410004, placed about 1′ southeast of IRAS 15398-3359, Okoda et al. (2021) interpreted these arc-like features as coming out from a possible second outflow associated with IRAS 15398-3359. In the present contribution, we analyzed recent ALMA archive observations, revealing the presence of redshifted and blueshifted low-velocity gas detected north and south of IRAS 15398-3359, respectively. This confirms the existence of another outflow driven by this pro-tostellar system. We studied the morphology and kinematics of the gas, which seems to support the hypothesis of a precessing episodic outflow.
2 ALMA molecular data
This work is mainly based on archival data obtained with the 7 m Atacama Compact Array (ACA) of ALMA. We also used higher angular resolution images obtained with ALMA that were previously presented in Vazzano et al. (2021). These images were not combined, and we analyzed them independently. New archival data presented in this work consist of a mosaic done with the ACA 7 m-antennas array in Band 6 centered on IRAS 15398-3359 (project 2019.1.01063.S, PI: Jinshi Sai). The mosaic contained 28 pointings covering an area of 2.′4 x2.′6. The data were taken on December 19, 2019. The maximum and minimum baselines were 8 and 48 m. The angular resolution is thus 8″. With respect to the weather conditions, the precipitable water vapour (PWV) values ranged between 1.6 and 1.95 mm during the observations. The correlator was configured to use four spectral windows and one continuum window. The continuous window at 1.3 mm (233.999 GHz) has 128 channels and a bandwidth of 2.0GHz. The spectral windows were centered on the transitions of C18O (2–1), 13CO (2–1), CO (2–1), and N2D+ (3–2) at 219.561, 220.399, 230.539, and 231.323 GHz, respectively. The number of channels and the bandwidth of the first two windows were 2048 and 0.125 GHz each, while for the remaining two windows, 1024 channels were observed with a bandwidth of 0.062 GHz (equivalent to a velocity resolution of 0.08 km s−1). Calibration of the raw visibility data was performed using the standard reduction script for the Cycle 6 data provided by the ALMA Observatory. This pipeline ran within the Common Astronomical Software Application (CASA 5.6.1 McMullin et al. 2007) environment. The on-source integration time was 2.55 h, and the calibrators used to correct for instrumental and atmospheric disturbances (flux, phase, and bandpass) were J1337-1257, J1534-3526, and J1337-1257, respectively. The self-calibrated interferometric free-line continuum data were cleaned in CASA to produce continuum images. The spectral line cubes were produced by subtracting the continuum and applying a standard cleaning with primary beam correction. The continuum was subtracted in the uv plane using the uvcontsub task. The ACA calibrated visibilities were Fourier transformed and cleaned with the CASA task tclean. We set the Briggs weighting parameter robust= 0.5 for both the continuum and12 CO (2-1) images as a compromise between angular resolution and signal-to-noise ratio (beam of 7.′′7×4.′′2, PA=86°). The rms noise level in the continuum image is around 2 mJy beam−1. The rms noise level for the 12CO (2–1) cube is ~ 100 mJy beam−1 per one channel of 0.16 km s−1 of the line velocity cube. In this paper, we only report12 CO (2–1) data.
3 Results
Figure 1 shows the blueshifted and redshifted integrated 12CO (2–1) intensity images, considering a systemic velocity of υsys = 5.1 ± 0.1 km s−1 (Mardones et al. 1997; van Kempen et al. 2009b). This systemic velocity is consistent with the recent ALMA study (Yen et al. 2017). In the center of the figure there is strong emission corresponding to the well-known molecular outflow associated with the NE–SW direction. Moreover, there is a second lobe to the southeast, which was identified as an outflow relic by Okoda et al. (2021). In addition, we detected other blueshifted and redshifted gas emission to the south and north of IRAS 15398-3359, respectively. The morphology seems an additional molecular outflow. These structures of 12CO are aligned with respect to the location of the IRAS 15398-3359 protostar and their emission is fainter than that of the NE–SW outflow. In addition, their projected size in the plane of the sky is greater than the NE–SW outflow. Hereafter, we further refer to the well-known outflow in the NE–SW direction as the “NE–SW outflow”, the southeast lobe reported by Okoda et al. (2021) as the “SE lobe”, and to the new one detected in the N–S direction as the “N–S outflow”.
Table 1 lists the velocity ranges used to map the redshifted and blueshifted lobes of the NE–SW and N–S structures, the position angles (PA) measured from north (0°) to east (90°), and the size of lobes. We derive these quantities for the red-shifted and blueshifted lobes of each outflow separately. ∆υrad = |υsys−υmax| is the outflow spread in radial velocity, where υsys is the systemic velocity and υmax is the maximum velocity which it is possible to detect outflow emission over the 3σ threshold. The position angles are calculated from the source position to the peak emission in each lobe. Since the outflow inclination is unknown, the sizes are projected on the plane of the sky and should be treated as lower limits. The errors in the measured sizes are given by the angular resolution of the image (ΔSize = beam/2). The parameters listed for the NE–SW outflow were taken from Vazzano et al. (2021).
In the top panels of Fig. 2, we show three channels of the high-angular-resolution 12CO (2–1) velocity cube (Vazzano et al. 2021). The emission in these channels is slightly blueshifted with respect to the system velocity. The NE–SW outflow is very bright, and a fainter complex of several arc-shaped structures (that we have identified as the SE lobe) can be identified southeast of the protostar location, almost perpendicular to the NE–SW outflow. These arc-shaped structures are also detected in CO(2–1) by Vazzano et al. (2021) and other molecular tracers (H2CO, SO, SiO and CH3OH) in Okoda et al. (2021). We identified two main directions linking the protostar position with the tips of some prominent arc-shaped structures; we included a third direction pointing to the blueshifted southern lobe of the N–S outflow. These three directions, marked with blue arrows in Fig. 2, have position angles 137°, 160°, and 180°. They seem to be separated by ~20° each on the plane of the sky. The three panels in the bottom right of Fig. 2 present the mean integrated spectra taken toward three regions marked with the corresponding boxes in the bottom left panel. Spectra from boxes 1 and 2 show a single main peak blueshifted at 4.1 km s−1. The spectrum from box 3 shows a double peak structure at 3.8 km s−1 and 3.2 km s−1.
Figure 3 shows the position-velocity diagram obtained along the N–S outflow axis and centered at the continuum peak position and the systemic velocity (5.1 km s−1). The emission near the zero offset likely belongs to the IRAS 15398-3359 rotating molecular envelope or disk system. Further away, the redshifted and blueshifted gas moves up to 70″ away from the protostar and reaches velocities as fast as 3 km s−1 with respect to the systemic velocity. The two-branch morphology observed in the blueshifted part of the diagram (positive offsets) could correspond to a shell structure typical of molecular outflows (see white arrows in Fig. 3). This agrees with the double-peaked spectrum corresponding to box 3 in Fig. 2.
Figure 4 shows the 12CO (2–1) velocity channel map of the NE–SW and NS outflows and the SE lobe. The velocity of the blueshifted emission from the NS outflow ranges from 2.3 to 4.2 km s−1, and its redshifted emission ranges from 6.4 to 7.4 km s−1. The SE lobe emission ranges from 3.6 to 4.4 km s−1. The NE–SW main outflow spreads over a range larger than that covered in the figure.
From the 12CO map in Fig. 1 and the velocity gradients of the gas revealed in Fig. 3, we can infer the presence of two bipolar structures centered on the IRAS 15398-3359. The NE-SW outflow has been extensively studied, and the new N–S outflow is presented in this work for the first time. A multiple outflow scenario supports the scenario proposed by Okoda et al. (2021), which revealed various outflows coming out from IRAS 15398-3359 at different epochs (4). The position angles of the blueshifted and redshifted lobes of the N–S and NE–SW outflows differ by 173° and 165°, respectively. In addition, the size projected on the plane of the sky of the N–S outflow is over four times greater compared with the NE–SW outflow, while its velocity extent is at least four times smaller without correcting for inclination angles.
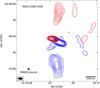 |
Fig. 1 Blueshiſted and redshiſted integrated emission of 12CO (2–1) toward the IRAS 15398-3359 region. The blueshiſted and redshiſted emission were integrated over the velocity ranges from 2.3 to 4.7 km s−1 and from 6.2 to 7.4 km s−1. Blueshiſted and redshiſted contours are represented at 10, 20, 30, 40, 50, 60, 100, and 150 times the rms of 0.l5 mJy beam−1 km s−1 and 0.1 mJy beam−1 km s−1, respectively. The stars indicate the position of IRAS 15398-3359 and 2MASS 15430576-3410004. The synthesized beam (7.′′7×4.′′2, PA=86◦) is represented by the black ellipse in the bottom left corner. |
Outflow parameters.
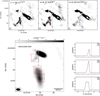 |
Fig. 2 High-angular-resolution maps of 12CO (2–1) emission taken with ALMA. Upper panels: velocity channel maps taken with the 12-m array near the cloud velocity. The blue arrows indicate possible relic ejections interacting with the gas in the vicinity of IRAS 15398-3359. The red star indicates the position of the continuum source. The synthesized beam (0. ′′57×0. ′′50) is represented in the bottom left corner, and the radial velocity is indicated in the top left corner. Bottom left panel: integrated blueshiſted emission image covering from 2.3 to 4.7 km s−1 taken with the 7-m array of ALMA. The blue arrows are same arrows as in figure above. The red boxes show the regions within which the spectra shown in the right panels were taken. Bottom right panels: average spectra obtained integrating blueshiſted emission inside the three boxes from the left. The vertical red line in the spectra indicates the systemic velocity at 5.1 km s−1. |
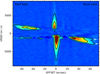 |
Fig. 3 Position-velocity diagram of 12CO (2–1) emission along N–S axis and centered at the continuum peak position with an angle position and cut width of 1″. |
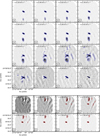 |
Fig. 4 12CO emission velocity channel maps toward IRAS 15398-3359 (gray scale). The upper and lower channel map shows the blueshifted and redshifted emission, respectively, avoiding the central channels around the 5.1 km s−1 cloud velocity. Contours are displayed at 2.0 and 5.0 mJy beam−1. Radial velocities are indicated in the top left corner. Synthesized beam is shown in the bottom left corner on every channel. |
4 Discussion
4.1 An N–S molecular outflow from IRAS 15398-3359
In addition to the well-known NE–SW molecular outflow associated with the protostar IRAS 15398-3359, Okoda et al. (2021) showed indications of the presence of a second molecular outflow probably ejected by the protostellar system, extending southeast up to 2″ (3000 au). The present 7 m array ALMA observations reveals the existence of a third molecular bipolar outflow in the N–S direction. The projected sizes measured from the position of the protostellar system (~104au) and the radial velocities (up to ~3 km s−1) of the blueshifted (south) and redshifted (north) lobes are similar; their position angles match within the error bars. All of this supports the idea that these two lobes comprise a bipolar structure that originated at the IRAS 15398-3359 position. Similar cases can be found in the literature, where more than one outflow is observed. There is the case of Par-lup, where two outflows were found associated with a young, very low-mass star (Santamaría-Miranda et al. 2020). In this source, the evidence points to a <15 au packed binary driving the two outflows. Another example is given in L1157, where Kwon et al. (2015) observed two jets of different ages triggered by a single Class 0 protostar (<0.04 M⊙).
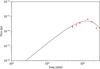 |
Fig. 5 2MASS 15430576-3410004 spectral energy distribution. Black dashed line shows the black-body fitting derived from infrared emission (data listed in Table 2). |
4.2 Origin and nature of SE lobe
Furthermore, the 7 m array ALMA observations show, although unresolved, the emission from the blueshifted complex of arc-shaped structures (the SE lobe), previously detected by Okoda et al. (2021) in several molecular shock-tracers between 1000 au and 3000 au southeast of the protostar (position angles ranging 137º–160º). The redshifted counterpart of these arc-shaped structures is, however, not clearly seen with the current low-angular-resolution data (however, see the 13CO and C18O velocity cubes in Thieme et al. 2023). In the following, we discuss the origin and nature of the molecular emission of the SE lobe and its relationship with the two outflows apparently launched from IRAS 15398-3359 location.
Regarding IRAS 15398-3359, a first possible scenario could be the presence of another source to the southeast, launching an outflow that produces bow-shock, arc-shaped structures when breaking into the quiescent gas surrounding IRAS 153983359 (Vazzano et al. 2021). Figure 1 shows the position of the southeastern infrared source 2MASS 15430576-3410004, about 9000 au away (~60″). However, the molecular gas from the arc-complex does not extend to this location. In addition, we have compiled and analyzed the SED of this 2MASS source. The SED can be fit with a blackbody model of temperature 2200 K, which peaks at ~105 GHz (Fig. 5; see also Table 2). The infrared spectral index from 2 to 24 µm is  . The lack of strong millimeter emission, along with the derived infrared spectral index, indicates that this star is probably in a more evolved stage (Evans et al. 2003), and is probably not responsible for the ejection of a prominent outflow.
A second possible scenario, proposed by Okoda et al. (2021), suggests that the arc-complex originates from relic IRAS 153983359 ejections. In this scenario, the geometry of the arcs is showing the bottom part of bubble-shaped structures, instead of bow-shocks tips. A variation of the SE lobe as a relic outflow scenario would explain the arcs and the filamentary structure (upper panels in Fig. 2) as the remnants of a sideways shock created by adjacent wakes of two separate ejections. This may explain the arcs pointing toward the protostar and the shock tracers found in this structure. Ejections with this type of morphology (cavities with parabolic shapes) are considered in the wind-driven shell model explained by Lee et al. (2000), and they have already been detected in other outflows, such the northwest lobe of IRAS 16059-3857 (Vazzano et al. 2021) or the western lobe of HH46/47 (Arce et al. 2013). Alternatively, the SE lobe could comprise the relics of two colliding sideways shocks from adjacent outflow ejections. The discovery of N–S outflow extending up to 104 au supports this second hypothetical scenario, as it provides new evidence for the existence of older ejecta launched from the IRAS 15398-3359 location. The difference in the position angles of the different arcs and the southernmost blueshifted lobe (~20º–23º) may indicate that the outflow axis was precess-ing. A similar set of ejections in slightly different directions have also been observed in the NE–SW outflow (Vazzano et al. 2021). We analyze this precessing behavior in Sect. 4.4.
Data used to fit the 2MASS 15430576-3410004 spectral energy distribution.
4.3 The age of the relic N–S outflow
The inclination of the outflows with respect to the plane of sky is still undetermined. Given that the NE–SW outflow seems to change its direction in short time lapses, the inclination with respect to the plane of the sky derived may be different to the value at which the relic N–S outflow was ejected. Moreover, their dynamic times depend on the observed radial velocities, which are considerably lower in the N–S outflow than in the NE–SW outflow. Although the velocities of the outflows are not a robust indicator of their age, this could mean that the N–S outflow was ejected in a direction closer to the plane of the sky (i.e., i ~ 0º) and that the gas has slowed down after some time. In any case, older outflows are expected to be longer and slower than younger ones, which hints at a difference in the age of both outflows.
As a first approximation, we considered the inclination of both outflows to be the same (i = 30º, from Yen et al. 2017). We also used the radial velocities listed in Table 1. The dynamical times for the blueshifted and redshifted lobes of the N–S outflow result in 24 200 and 28 600 yr, respectively. This implies that the N–S outflow would be about 20 times older than the NE–SW outflow (with a dynamic time of ~1300 yr). Alternatively, we could also speculate that the gas in the N–S outflow was ejected in the past at similar velocity to that observed in the NE–SW outflow (i.e., a radial velocity of 13.5 km s−1 on average). Under this hypothesis, the N–S outflow would have an inclination of ~13º with respect to the plane of the sky, and an estimated dynamical time of ~3650 yr, which is about four times older than the NE-SW outflow. To sum this up, the new observations suggest that the N–S may be a relic of an older outflow, while the NE–SW outflow, currently being ejected, may be younger.
4.4 Episodic accretion and ejection
Vazzano et al. (2021) identify four pairs of bipolar elliptical structures ending in bow-like structures in the NE–SW outflow associated with IRAS 15398-3359. Every identified ellipse-like structure would correspond to a bipolar ejection. These structures have slightly different sizes and position angles, which possibly indicates the presence of episodically ejected material outflowing from the protostellar system with a variable direction caused by the precession of the launching axis. Extending this scenario to the SE lobe, we speculate that both the N–S outflow and the SE lobe may be part of a series of ejections in slightly different directions with position angles separated by ~20° (see arrows in Fig. 2). Therefore, the NE–SW outflow on one hand, and the N–S outflow along with the SE lobe, on the other hand, may share a similar pattern of episodic precessing ejections.
Assuming that the NE–SW outflow, N–S outflow, and SE lobe are driven by the same protostellar system in IRAS 153983359 (for an update about the multiplicity of this system based on the most recent observations, see Okoda et al. 2021; Thieme et al. 2023), the present observations suggest that events would have drastically changed the outflow direction, while remembering the precession of the system (or as a consequence of it). In this way, the system would present both small (<20°) and large (>20°) orientation changes. While the small changes may be caused by precession of the outflow axis, the large changes may be triggered by cataclysmic accretion events (a sudden asymmetric accretion of large amounts of mass), the close encounter with an interloper, or by the presence of an undetected, small-mass companion star with a nearby periastron (reorientation by gravitational tugging, as in Cepheus A HW2; Cunningham et al. 2009). Another possibility is that the gravitational interactions of a putative unresolved multiple system may episodically tilt the system, with intertwined periods of quiescent and chaotic reconfigurations. However, as said before, at this moment there is no clear evidence supporting the presence of such a multiple system. Recent continuous analysis of high-resolution (~40 mas) IRAS 15398-3359 observations by Thieme et al. (2023) has revealed one small, compact (deconvolved size of 4.5 × 2.8 au) and very low-mass (0.6–1.8 Mjup) dust disk.
In any case, the data reveal that the IRAS 15398-3359 system has different episodic ejections, and these could be associated with events in which the accretion suddenly varies. Moreover, Vazzano et al. (2021) determine that the estimated dynamical times of the different ejections in the NE–SW outflow range from 33 to 268 years, while Jørgensen et al. (2013), based on the lack of H13CO+ at the center of the protostellar system’s envelope, propose that the system underwent a recent accretion burst 100–1000 yr ago. Despite the rough agreement between the two timescales, more data should be collected to relate this accretion event to the sudden change of direction in the outflow.
Mosaic observations with better angular resolution and higher sensitivity (e.g., 12m ALMA observations with a extended array) will be necessary to accurately describe the structure of the relic N–S outflow lobes and discover if there are more continuum sources in IRAS 15398-3359. It would also be necessary to observe new chemical tracers to study the accretion processes of the protostellar envelope. In addition, observations with a larger field, including the whole extension of the SE lobe, could help us to better determine its origin.
5 Summary
From 7 m array ALMA data, we report the presence of a new molecular outflow (the N–S outflow) associated with the young protostar IRAS 15398-3359, in addition to the already well-studied one projected into the sky in a NE–SW direction. The NE–SW outflow may undergo precessional motions, which result in ejections driven along slightly, ~10°, different orientations (Vazzano et al. 2021). The newly reported molecular outflow is almost in an N–S direction and its position angle differs by 50° – 60° from the NE–SW outflow. The morphology and kinematics of the detected gas show that the N–S ejections are older and may be the relics of a past ejected bipolar outflow. In addition, we build up the spectral energy distribution of the 2MASS 15430576/3410004, which shows a spectral index that momentarily discard it as the possible driver of the outflow remnants in the form of arc-shaped structures, previously detected southeast of IRAS 15398-3359 (Cutri et al. 2003; Evans et al. 2003). These remnants may be the outcome of the collision of wakes produced by sideways shock fronts. We propose that the gas detected north and south of IRAS 15398-3359 in these new observations, together with the gas structures identified southeast of the same source (Vazzano et al. 2021; Okoda et al. 2021), are the remnants of several episodic outflow ejections driven by a possible precessing system.
The new observations suggest that one or more events could have drastically changed the direction of the outflow. This result supports the scenario proposed by Okoda et al. (2021). They claim strong events could be related to extreme anisotropic accretion events that may produce a tilt in the direction of the disk-protostar system. In the case of IRAS 15398-3359, both the disk and the protostar have a relatively low mas; hence, this sort of perturbation may not be so difficult to reach. After the tilt, or as a consequence of it, the system seems to keep the memory of such events in the form of a small precession seen as multiple ejections in the NE–SW outflow. It is expected that the rotation of the disk may dampen the precession in due time. Finally, the results presented in this work depict IRAS 15398-3359 as a key protostellar system to better understand the link between accretion and ejection, their episodic nature, and the origin of precession in very young jets and outflows.
Acknowledgements
This paper makes use of the following ALMA data: ADS/JAO.ALMA 2019.1.01063.S and ADS/JAO.ALMA 2013.1.00879.S. ALMA is a partnership of ESO (representing its member states), NSF (USA) and NINS (Japan), together with NRC (Canada), MOST and ASIAA (Taiwan), and KASI (Republic of Korea), in cooperation with the Republic of Chile. The Joint ALMA Observatory is operated by ESO, AUI/NRAO and NAOJ. The National Radio Astronomy Observatory is a facility of the National Science Foundation operated under cooperative agreement by Associated Universities, Inc. E.G.C. is funded by PhD scholarships from the Argentine Consejo Nacional de Investigaciones Científicas y Técnicas (CONICET).
References
- Anglada, G., López, R., Estalella, R., et al. 2007, AJ, 133, 2799 [Google Scholar]
- Arce, H. G., Mardones, D., Corder, S. A., et al. 2013, ApJ, 774, 39 [CrossRef] [Google Scholar]
- Bjerkeli, P., Jørgensen, J. K., Bergin, E. A., et al. 2016, A&A, 595, A39 [NASA ADS] [CrossRef] [EDP Sciences] [Google Scholar]
- Cunningham, N. J., Moeckel, N., & Bally, J. 2009, ApJ, 692, 943 [NASA ADS] [CrossRef] [Google Scholar]
- Cutri, R. M., Skrutskie, M. F., van Dyk, S., et al. 2003, VizieR Online Data Catalog, II/246 [Google Scholar]
- Ellerbroek, L. E., Podio, L., Kaper, L., et al. 2013, A&A, 551, A5 [NASA ADS] [CrossRef] [EDP Sciences] [Google Scholar]
- Evans, Neal J., I., Allen, L. E., Blake, G. A., et al. 2003, PASP, 115, 965 [Google Scholar]
- Heyer, M. H., & Graham, J. A. 1989, PASP, 101, 816 [NASA ADS] [CrossRef] [Google Scholar]
- Jørgensen, J. K., Visser, R., Sakai, N., et al. 2013, ApJ, 779, L22 [Google Scholar]
- Kim, C.-H., Lee, J.-E., Contreras Peña, C., et al. 2024, ApJ, 961, 108 [NASA ADS] [CrossRef] [Google Scholar]
- Kwon, W., Fernández-López, M., Stephens, I. W., & Looney, L. W. 2015, ApJ, 814, 43 [NASA ADS] [CrossRef] [Google Scholar]
- Lee, C.-F., Mundy, L. G., Reipurth, B., Ostriker, E. C., & Stone, J. M. 2000, ApJ, 542, 925 [NASA ADS] [CrossRef] [Google Scholar]
- Mardones, D., Myers, P. C., Tafalla, M., et al. 1997, ApJ, 489, 719 [Google Scholar]
- McMullin, J. P., Waters, B., Schiebel, D., Young, W., & Golap, K. 2007, ASP Conf. Ser., 376, CASA Architecture and Applications, eds. R. A. Shaw, F. Hill, & D. J. Bell, 127 [NASA ADS] [Google Scholar]
- Murphy, G. C., Lery, T., O’Sullivan, S., et al. 2008, A&A, 478, 453 [NASA ADS] [CrossRef] [EDP Sciences] [Google Scholar]
- Okoda, Y., Oya, Y., Sakai, N., et al. 2018, ApJ, 864, L25 [NASA ADS] [CrossRef] [Google Scholar]
- Okoda, Y., Oya, Y., Francis, L., et al. 2021, ApJ, 910, 11 [CrossRef] [Google Scholar]
- Oya, Y., Sakai, N., Sakai, T., et al. 2014, ApJ, 795, 152 [NASA ADS] [CrossRef] [Google Scholar]
- Rodríguez, L. F., Porras, A., Claussen, M. J., et al. 2003, ApJ, 586, L137 [CrossRef] [Google Scholar]
- Sanchis, E., Testi, L., Natta, A., et al. 2020, A&A, 638, C4 [NASA ADS] [CrossRef] [EDP Sciences] [Google Scholar]
- Santamaría-Miranda, A., de Gregorio-Monsalvo, I., Huélamo, N., et al. 2020, A&A, 640, A13 [NASA ADS] [CrossRef] [EDP Sciences] [Google Scholar]
- Santamaría-Miranda, A., de Gregorio-Monsalvo, I., Plunkett, A. L., et al. 2021, A&A, 646, A10 [NASA ADS] [CrossRef] [EDP Sciences] [Google Scholar]
- Tachihara, K., Dobashi, K., Mizuno, A., Ogawa, H., & Fukui, Y. 1996, PASJ, 48, 489 [NASA ADS] [CrossRef] [Google Scholar]
- Thieme, T. J., Lai, S.-P., Ohashi, N., et al. 2023, ApJ, 958, 60 [NASA ADS] [CrossRef] [Google Scholar]
- van Kempen, T. A., van Dishoeck, E. F., Güsten, R., et al. 2009a, A&A, 507, 1425 [NASA ADS] [CrossRef] [EDP Sciences] [Google Scholar]
- van Kempen, T. A., van Dishoeck, E. F., Hogerheijde, M. R., & Güsten, R. 2009b, A&A, 508, 259 [NASA ADS] [CrossRef] [EDP Sciences] [Google Scholar]
- Vazzano, M. M., Fernández-López, M., Plunkett, A., et al. 2021, A&A, 648, A41 [NASA ADS] [CrossRef] [EDP Sciences] [Google Scholar]
- Yen, H.-W., Koch, P. M., Takakuwa, S., et al. 2017, ApJ, 834, 178 [Google Scholar]
- Young, A. K., Alexander, R., Rosotti, G., & Pinte, C. 2022, MNRAS, 513, 487 [NASA ADS] [CrossRef] [Google Scholar]
- Zapata, L. A., Fernandez-Lopez, M., Curiel, S., Patel, N., & Rodriguez, L. F. 2013, arXiv e-prints [arXiv: 1305.4084] [Google Scholar]
All Tables
All Figures
|
Fig. 1 Blueshiſted and redshiſted integrated emission of 12CO (2–1) toward the IRAS 15398-3359 region. The blueshiſted and redshiſted emission were integrated over the velocity ranges from 2.3 to 4.7 km s−1 and from 6.2 to 7.4 km s−1. Blueshiſted and redshiſted contours are represented at 10, 20, 30, 40, 50, 60, 100, and 150 times the rms of 0.l5 mJy beam−1 km s−1 and 0.1 mJy beam−1 km s−1, respectively. The stars indicate the position of IRAS 15398-3359 and 2MASS 15430576-3410004. The synthesized beam (7.′′7×4.′′2, PA=86◦) is represented by the black ellipse in the bottom left corner. |
| In the text | |
|
Fig. 2 High-angular-resolution maps of 12CO (2–1) emission taken with ALMA. Upper panels: velocity channel maps taken with the 12-m array near the cloud velocity. The blue arrows indicate possible relic ejections interacting with the gas in the vicinity of IRAS 15398-3359. The red star indicates the position of the continuum source. The synthesized beam (0. ′′57×0. ′′50) is represented in the bottom left corner, and the radial velocity is indicated in the top left corner. Bottom left panel: integrated blueshiſted emission image covering from 2.3 to 4.7 km s−1 taken with the 7-m array of ALMA. The blue arrows are same arrows as in figure above. The red boxes show the regions within which the spectra shown in the right panels were taken. Bottom right panels: average spectra obtained integrating blueshiſted emission inside the three boxes from the left. The vertical red line in the spectra indicates the systemic velocity at 5.1 km s−1. |
| In the text | |
|
Fig. 3 Position-velocity diagram of 12CO (2–1) emission along N–S axis and centered at the continuum peak position with an angle position and cut width of 1″. |
| In the text | |
|
Fig. 4 12CO emission velocity channel maps toward IRAS 15398-3359 (gray scale). The upper and lower channel map shows the blueshifted and redshifted emission, respectively, avoiding the central channels around the 5.1 km s−1 cloud velocity. Contours are displayed at 2.0 and 5.0 mJy beam−1. Radial velocities are indicated in the top left corner. Synthesized beam is shown in the bottom left corner on every channel. |
| In the text | |
|
Fig. 5 2MASS 15430576-3410004 spectral energy distribution. Black dashed line shows the black-body fitting derived from infrared emission (data listed in Table 2). |
| In the text | |
Current usage metrics show cumulative count of Article Views (full-text article views including HTML views, PDF and ePub downloads, according to the available data) and Abstracts Views on Vision4Press platform.
Data correspond to usage on the plateform after 2015. The current usage metrics is available 48-96 hours after online publication and is updated daily on week days.
Initial download of the metrics may take a while.