Fig. 1
Download original image
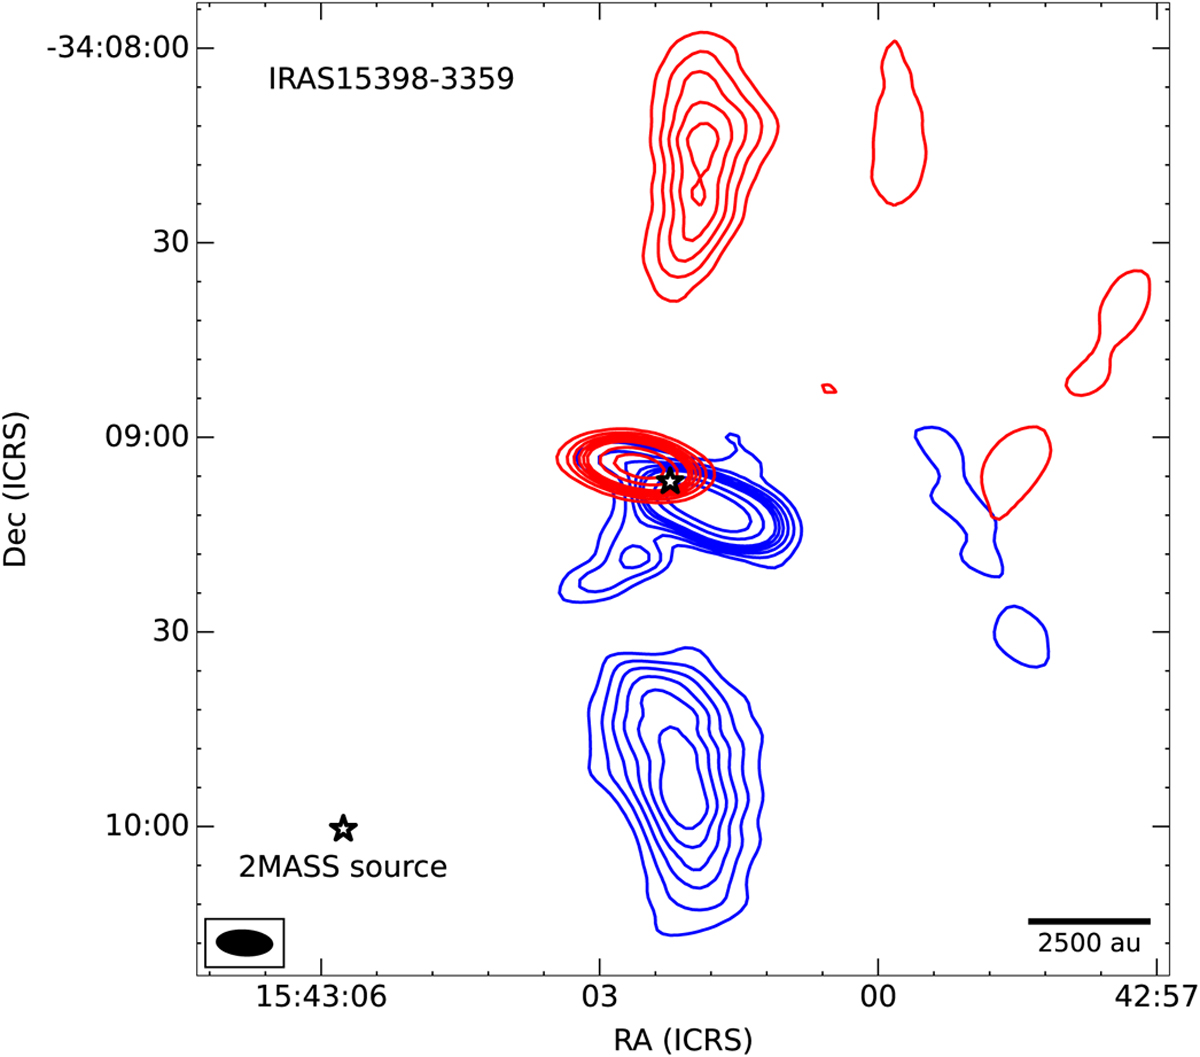
Blueshiſted and redshiſted integrated emission of 12CO (2–1) toward the IRAS 15398-3359 region. The blueshiſted and redshiſted emission were integrated over the velocity ranges from 2.3 to 4.7 km s−1 and from 6.2 to 7.4 km s−1. Blueshiſted and redshiſted contours are represented at 10, 20, 30, 40, 50, 60, 100, and 150 times the rms of 0.l5 mJy beam−1 km s−1 and 0.1 mJy beam−1 km s−1, respectively. The stars indicate the position of IRAS 15398-3359 and 2MASS 15430576-3410004. The synthesized beam (7.′′7×4.′′2, PA=86◦) is represented by the black ellipse in the bottom left corner.
Current usage metrics show cumulative count of Article Views (full-text article views including HTML views, PDF and ePub downloads, according to the available data) and Abstracts Views on Vision4Press platform.
Data correspond to usage on the plateform after 2015. The current usage metrics is available 48-96 hours after online publication and is updated daily on week days.
Initial download of the metrics may take a while.