Fig. 2
Download original image
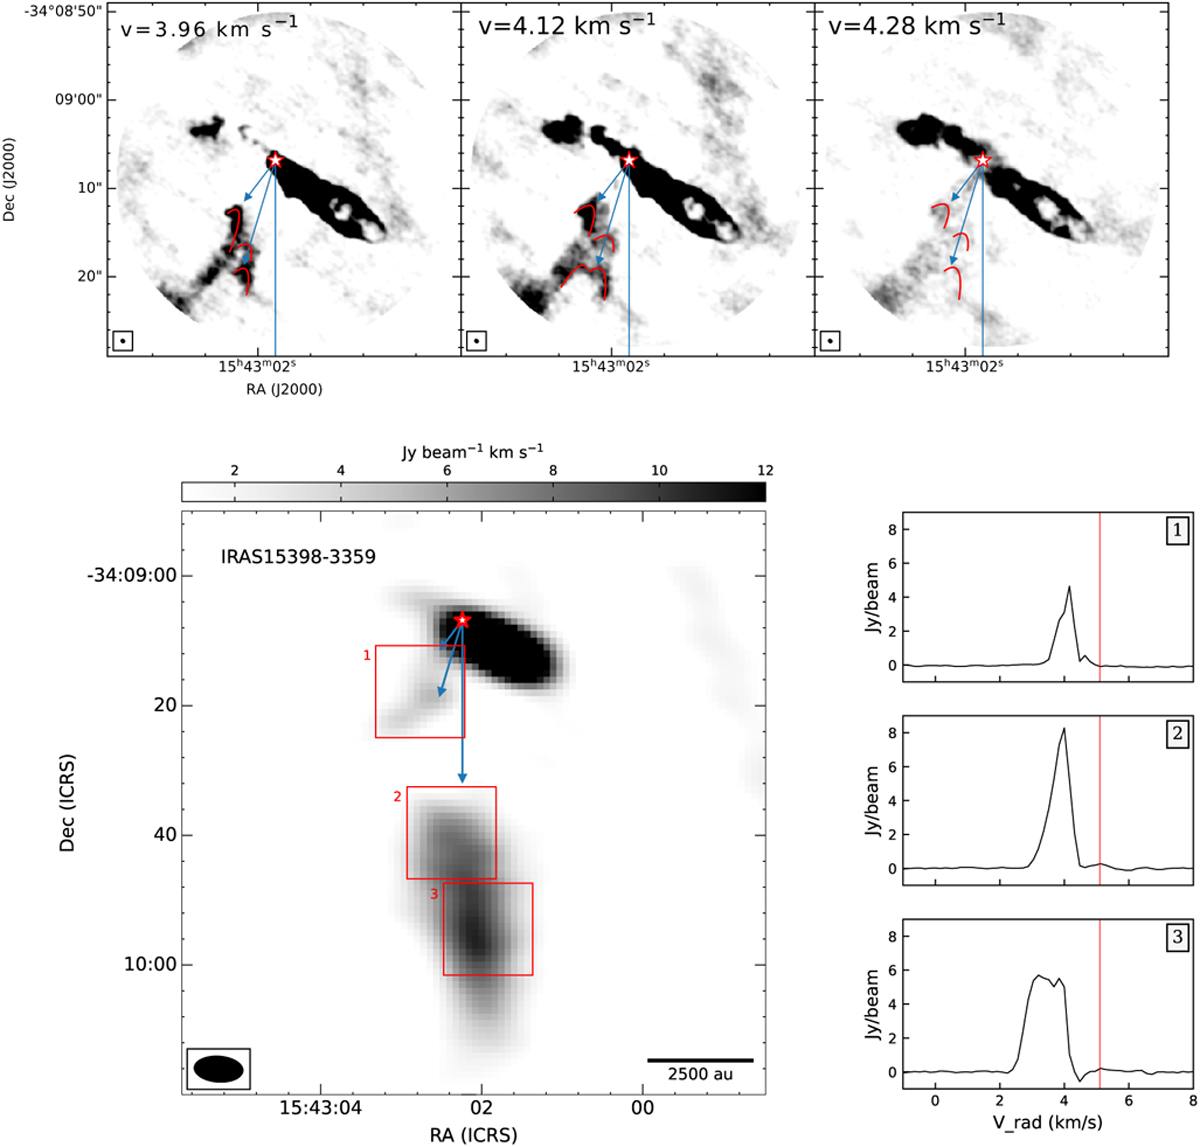
High-angular-resolution maps of 12CO (2–1) emission taken with ALMA. Upper panels: velocity channel maps taken with the 12-m array near the cloud velocity. The blue arrows indicate possible relic ejections interacting with the gas in the vicinity of IRAS 15398-3359. The red star indicates the position of the continuum source. The synthesized beam (0. ′′57×0. ′′50) is represented in the bottom left corner, and the radial velocity is indicated in the top left corner. Bottom left panel: integrated blueshiſted emission image covering from 2.3 to 4.7 km s−1 taken with the 7-m array of ALMA. The blue arrows are same arrows as in figure above. The red boxes show the regions within which the spectra shown in the right panels were taken. Bottom right panels: average spectra obtained integrating blueshiſted emission inside the three boxes from the left. The vertical red line in the spectra indicates the systemic velocity at 5.1 km s−1.
Current usage metrics show cumulative count of Article Views (full-text article views including HTML views, PDF and ePub downloads, according to the available data) and Abstracts Views on Vision4Press platform.
Data correspond to usage on the plateform after 2015. The current usage metrics is available 48-96 hours after online publication and is updated daily on week days.
Initial download of the metrics may take a while.