Fig. 4
Download original image
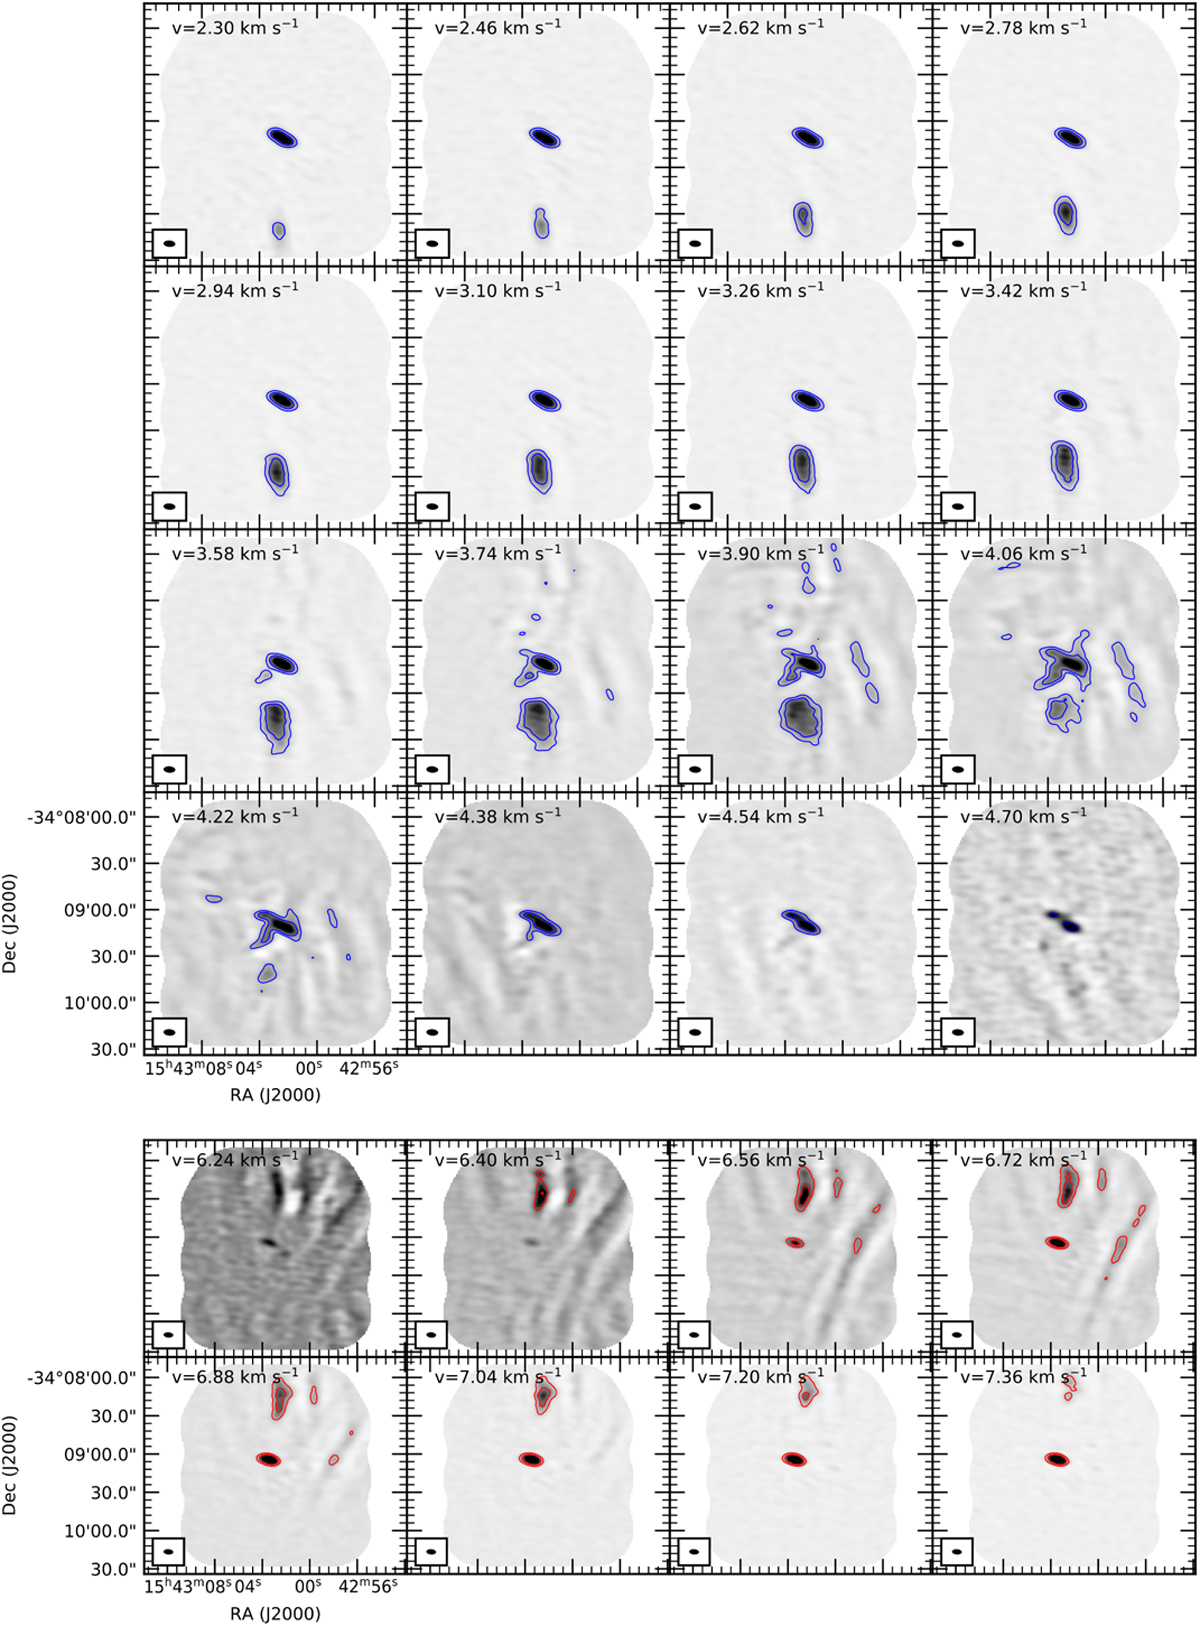
12CO emission velocity channel maps toward IRAS 15398-3359 (gray scale). The upper and lower channel map shows the blueshifted and redshifted emission, respectively, avoiding the central channels around the 5.1 km s−1 cloud velocity. Contours are displayed at 2.0 and 5.0 mJy beam−1. Radial velocities are indicated in the top left corner. Synthesized beam is shown in the bottom left corner on every channel.
Current usage metrics show cumulative count of Article Views (full-text article views including HTML views, PDF and ePub downloads, according to the available data) and Abstracts Views on Vision4Press platform.
Data correspond to usage on the plateform after 2015. The current usage metrics is available 48-96 hours after online publication and is updated daily on week days.
Initial download of the metrics may take a while.