| Issue |
A&A
Volume 686, June 2024
|
|
|---|---|---|
| Article Number | A65 | |
| Number of page(s) | 27 | |
| Section | Stellar structure and evolution | |
| DOI | https://doi.org/10.1051/0004-6361/202348571 | |
| Published online | 29 May 2024 | |
Short-period pulsating hot subdwarf stars observed by TESS
II. Northern ecliptic hemisphere
1
Astronomical Observatory, University of Warsaw, Al. Ujazdowskie 4, 00-478 Warszawa, Poland
e-mail: This email address is being protected from spambots. You need JavaScript enabled to view it.
2
ARDASTELLA Research Collaboration, Missouri State University, Springfield, MO 65897, USA
3
IRAP, CNRS, UPS, CNES, Université de Toulouse, 14 av. Edouard Belin, 31400 Toulouse, France
4
Recogito AS, Storgaten 72, 8200 Fauske, Norway
5
Space Sciences, Technologies and Astrophysics Research (STAR) Institute, Université de Liège, 19C Allée du 6 Août, 4000 Liège, Belgium
6
Nordic Optical Telescope, Rambla José Ana Fernández Pérez 7, 38711 Breña Baja, Spain
7
Department of Physics and Astronomy, Aarhus University, NyMunkegade 120, 8000 Aarhus C, Denmark
8
Astronomical Institute of the Czech Academy of Sciences, Fričova 298, 251 65 Ondřejov, Czech Republic
9
Astroserver.org, Fő tér 1, 8533 Malomsok, Hungary
Received:
12
November
2023
Accepted:
23
February
2024
Abstract
We present the results of an extension of our Transiting Exoplanet Survey Satellite (TESS) search for short-period pulsations in compact stellar objects observed during the second and fourth years of the TESS mission, which targeted the northern ecliptic hemisphere. For many of the targets, we exploited unpublished spectroscopic data to confirm or re-evaluate the object’s spectral classification. From the TESS photometry, we identified 50 short-period hot-subdwarf pulsators, including 35 sdB and 15 sdOB stars. The sample contains 26 pulsators that were unknown prior to the TESS mission. Nine stars show signals at both low and high frequencies and have been categorized as “hybrid” pulsators. For each pulsator, we report the list of prewhitened frequencies, along with and their amplitude spectra calculated from the TESS data. We attempt to identify possible multiplets caused by stellar rotation and we report five candidates with rotation periods between 11 and 46 d. With the search for p-mode pulsating hot subdwarfs in TESS Sectors 1–60 complete, we discuss the completeness of the study, as well as the instability strip and the evolutionary status of the stars we found. We also compare the distribution of pulsation periods as a function of effective temperature and surface gravity with theoretical predictions. We find that the percentage of undetected pulsators in the TESS mission increases with decreasing brightness measurements of stars, reaching 25% near the 15th magnitude. When comparing the distribution of hot subdwarfs in the log g − Teff plane with stellar models, we underline the importance of a proper treatment of the hydrogen-rich envelope composition (strongly affected by microscopic diffusion processes). We also emphasize that the stellar mass is a significant factor in understanding the instability strip. The p-mode instability strip is confirmed to be narrower than predicted by prior non-adiabatic calculations based on models incorporating equilibrium between gravitational settling and radiative levitation for iron. This implies that competing mixing processes ignored in these models must play a role in reducing the amount of levitating iron in the stellar envelope. Interestingly, we find that the coolest p-mode pulsators with Teff ≲ 30 000 K (including the hybrid ones) tend to cluster around the terminal age of the extreme horizontal branch of canonical mass (TAEHB at ∼0.47 M⊙). This trend is expected from the non-adiabatic pulsation calculations. Otherwise, the overall pulsation period distributions tend to reproduce the predicted trends in Teff and log g.
Key words: stars: oscillations
© The Authors 2024
 Open Access article, published by EDP Sciences, under the terms of the Creative Commons Attribution License (https://creativecommons.org/licenses/by/4.0), which permits unrestricted use, distribution, and reproduction in any medium, provided the original work is properly cited.
This article is published in open access under the Subscribe to Open model. This email address is being protected from spambots. You need JavaScript enabled to view it. to support open access publication.
1. Introduction
The detection of 43 hot-subdwarf pressure (p) mode pulsators in the southern ecliptic hemisphere observed with the Transiting Exoplanet Survey Satellite (TESS) was reported by Baran et al. (2023, hereafter, Paper I). The sample includes 32 subdwarf B (sdB) stars, 8 subdwarf OB (sdOB) stars, 2 subdwarf O (sdO) stars, and, significantly, 1 He-sdOB star, which is the first of this kind to show short-period pulsations. An introduction to all types of hot subdwarfs is provided in Paper I.
We continued our effort to search for hot-subdwarf p-mode pulsators in the northern ecliptic hemisphere observed by TESS. Our ultimate goal is to report the census of the p-mode-dominated hot-subdwarf stars surveyed by the TESS satellite, along with an ensemble analysis on the presence of p-mode pulsators among hot subdwarfs.
2. Classification spectra
To verify or establish the spectral classification for some of the objects, new spectra were obtained using the ALFOSC spectrograph on the 2.56 m Nordic Optical Telescope (NOT). We mainly used grism #18, which samples the Balmer series from Hβ to shorter wavelengths, spanning 345–535 nm and we used a 1-arcsec slit resulting in R = 1000 spectral resolution. These spectra also serve to obtain estimates of the effective temperature, surface gravity and surface He/H, using the classical local thermodynamic equilibrium (LTE) model atmospheres of Heber et al. (2000). The obtained values are quoted in the context of the individual stars.
3. TESS photometry
We followed the same approach as explained in Paper I. Basically, we downloaded all available data of our targets from the Barbara A. Mikulski Archive for Space Telescopes (MAST)1. Our preference is to use the USC (ultra-short cadence of 20 s integration) data (when available) that are used to sample the entire p-mode frequency range. In the case of the SC (short cadence of 120 s) data, the Nyquist frequency (at 4167 μHz) is in the middle of the p-mode region and aliasing becomes a serious issue. We used PDCSAP_FLUX, which is corrected for on-board systematics and neighbors’ contributions to the overall flux. We clipped fluxes at 4.5σ to remove outliers, de-trended long-term variations (on the order of days) with spline fitting, and calculated the amplitude of the flux variations using the relation A[ppt] = 1000*(flux/⟨flux⟩-1), where ppt refers to “parts per thousand.”
4. Fourier analysis
We used the same prewhitening techniques with a detection threshold as described in Paper I. Based on results presented by Baran & Koen (2021), we adopted a detection threshold at signal-to-noise (S/N) of 4.5 times the median noise level to both the SC and USC data sets, regardless of the data coverage. Nevertheless, frequencies with S/N ≤ 5.5 (corresponding to a FAP = 0.1%) should be considered tentative. To search for significant signal in the amplitude spectra, we used the FELIX package (Charpinet et al. 2010; Zong et al. 2016) and other dedicated scripts. We followed the same procedure as explained in Paper I. First, an automatic search was performed, looking for significant variations beyond 1500 μHz, where p-modes are usually found. Then, an individual check was carried out to establish if detected variations are indeed consistent with p-mode pulsations. We detected signals in the p-mode region in 50 hot subdwarfs. Twelve targets were observed only in the SC mode, while 38 were observed in the USC mode. We found 11 new detections in SC data and 16 new detections in USC data, while the remaining 1 (SC) and 22 (USC) hot-subdwarf pulsators were already known prior to the TESS mission. We present the list of all p-mode hot subdwarf pulsators in Table 1. This table also provides the spectral type (SpT), either from the literature or from new spectroscopy that we acquired recently. The classification convention we applied is explained in Paper I, basically we marked those stars with detectable He I, or no He I lines at all, with a B class. Those stars with detectable He II at 4686 Å with class OB, and those stars with strong He II and no He I with class O. Below, we describe each target, including previously-published pulsation properties, followed by amplitude spectra and the list of frequencies detected from the TESS light curves.
Pulsating hot subdwarfs found in the TESS data.
4.1. Targets observed in the SC mode
For stars with SC mode data, the Nyquist frequency is at 4167 μHz. As in Paper I, we decided to prewhiten frequencies that are found in the super-Nyquist region. We tried to discern sub- from super-Nyquist, by first relying on previously-published results for known pulsators and then using a combination of amplitude, multi-sector observations (if available), and peak shape in the Fourier transform (FT). We show the amplitude spectra of SC-observed pulsating subdwarf B stars (sdBV) in Figs. 1 and A.1, along with the seismic properties of the detected pulsation frequencies, f1 to fN, in Table 2, as well as any detected binary orbital signal as Ω and its harmonic 2Ω.
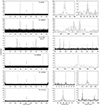 |
Fig. 1. Amplitude spectra of the targets observed in the SC mode. If sector is not specified, we include all avalable data. Left panels: Frequency range, up to twice the Nyquist frequency. The arrows point at the Nyquist frequency of 4166.67 μHz. Right panels: Close-ups of the detected frequencies. |
Frequencies detected in the targets observed only with the SC.
TIC 968226 (PHL 211) is a new sdB pulsator. The spectral classification was revealed by Kilkenny (1984), who marked it as an sdB star based on Strömgren indices. Our fit to a spectrum taken with the NOT in 2022 gives Teff = 28 982(198) K, log(g/cm s−2) = 5.42(3), and log(n(He)/n(H)) = –3.15(9). We classified the star as an sdB. TESS observed the star during Sector 42. We detected two frequencies in the p-mode region, shown in Table 2 and in Fig. 1.
TIC 16993518 (FBS 1539+355) is a new sdOB pulsator. Pérez-Fernández et al. (2016) found the star as a hot subdwarf candidate with Teff = 32 500 K. Later, based on photometry, Geier et al. (2017) classified the star as an sdB. Our fit to a spectrum taken with the NOT in 2022 gives Teff = 32 194(187) K, log(g/cm s−2) = 5.37(4), and log(n(He)/n(H)) = –2.27(9); thus, we classified the star as an sdOB. TESS observed the star during Sector 51. We detected three frequencies in the p-mode region shown in Fig. 1, with frequencies in Table 2.
TIC 85145647 (FBS 0725+623) is a new sdB pulsator. Based on photometry, Geier et al. (2017) classified the star as an sdB. Our fit to a spectrum taken with the INT in 2014 gives Teff = 32 287(656) K, log(g/cm s−2) = 5.41(12) and log(n(He)/n(H)) = –3.03(39), indicating an sdB classification. TESS observed the star during Sectors 20 and 47. We detected seven frequencies in Sector 20 and two frequencies in Sector 47, which differed in amplitude. We show the amplitude spectrum calculated from Sector 20 data in Fig. 1 and we list the prewhitened frequencies in data from both sectors in Table 2. Three frequencies, f2, f3, and f4, make a slightly asymmetric triplet. The S/N of f4 is only 3.6, which may not be an intrinsic signal. The splittings on both sides are 1.11 and 0.99 μHz and, assuming the splitting is caused by rotation, the average rotation period is 11.0(7) days.
TIC 97286494 (GALEX J081110.8+273420) is a new sdB pulsator. Based on photometry, Geier et al. (2017) classified the star as an sdB+F. TESS observed the star during Sectors 44–47 from which we detected only one frequency in the p-mode region. We show the amplitude spectrum in Fig. 1 and we list the prewhitened frequency in Table 2.
TIC 154818961 (Gaia DR3 1935962732084366592) is a new sdB pulsator. Our fit to a spectrum taken with the NOT in 2023 gives Teff = 28 330(281) K, log(g/cm s−2) = 5.29(4), and log(n(He)/n(H)) = –1.71(5); thus, we classified the star as an sdB. TESS observed the star during Sector 57. We detected three frequencies and based on amplitudes and profiles we selected those in the sub-Nyquist region. We interpreted the two low frequencies to be a binary frequency and its first harmonic. We show the amplitude spectrum in Fig. 1 and list the prewhitened frequencies in Table 2. The middle panel shows an additional comb of low amplitude frequencies; we found that TIC 2041859698 (Gaia DR3 1935962732084366464) is the source of those frequencies, which we interpret to be caused by eclipses. We estimate the orbital period of this eclipsing binary system to be near 1.5 d.
TIC 157141133 (Gaia DR3 6904512841490841472) is a new sdB pulsator. Our fit to a spectrum taken with the ING in 2014 gives Teff = 31 076(207) K, log(g/cm s−2) = 5.60(4), and log(n(He)/n(H)) = –2.97(16); thus, we classified the star as an sdB. TESS observed the star during Sector 54. We detected three frequencies in the sub-Nyquist region. Frequency f1 is likely a binary signature. We show the amplitude spectrum in Fig. 1, and the prewhitened frequencies in Table 2.
TIC 186484490 (FBS 0117+396) is a known sdB pulsator. It was originally identified as sdB-O in the First Byurakan Sky Survey (Abrahamian et al. 1990). Østensen et al. (2013) derived atmospheric parameters and classified the star as an sdB. The same authors reported a discovery of the star to be an sdB+dM binary system with a pulsating primary. Two high and eight low frequency signals were reported and the orbital period was estimated to be 0.252013(13) days. The binarity was confirmed with radial velocity data. TESS observed the star during Sector 17. We detected a binary frequency and its first harmonic. The orbital period we measured is 0.251966(23) days and we detected only one high frequency signal, frequency, f1, reported by Østensen et al. (2013), and in the sub-Nyquist region. We show the amplitude spectrum in Fig. A.1 and list the prewhitened frequencies in Table 2.
TIC 199715319 (PG 1656+553) is a new sdB pulsator. The star was classified as an sdB star in the Palomar-Green (PG) survey (Green et al. 1986) and later confirmed by Kilkenny et al. (1988). Our fit to a spectrum taken with the NOT in 2023 gives Teff = 28 144(310) K, log(g/cm s−2) = 5.32(4), and log(n(He)/n(H)) = –3.15(10); thus, we classified the star as an sdB. TESS observed the star during Sectors 40, 49–53, 56–57, and 59. We detected only one frequency, listed in Table 2, and we show the amplitude spectrum calculated from all sectors (except Sector 40) in Fig. A.1.
TIC 222892604 (LS IV+06° 5) is a new sdB pulsator. Nassau & Stephenson (1963) classified it as a main-sequence B star. We obtained a NOT spectrum in 2022 and re-classify it as an sdB star. Our fit gives Teff = 30 363(188) K, log(g/cm s−2) = 5.47(3) and log(n(He)/n(H)) = –3.08(13). TESS observed the star during Sector 54. We detected five frequencies with two of them being close to each other, possibly part of a multiplet. The frequency splitting is 0.5039 μHz, giving a rotation period of either 23 or 46 days (for Δm of 1 or 2, respectively). We show the amplitude spectrum in Fig. A.1 and we list the prewhitened frequencies in Table 2.
TIC 248776104 (PG 2052−003) is a new sdB pulsator. The star was classified as an sdB star in the Palomar-Green (PG) survey (Green et al. 1986). Our fit to a spectrum taken with the NOT in 2022 gives Teff = 32 891(205) K, log(g/cm s−2) = 5.52(4) and log(n(He)/n(H)) = –2.89(14); thus, we classified the star as an sdB. TESS observed the star during Sector 55. We detected two frequencies, listed in Table 2, and we show the amplitude spectrum in Fig. A.1.
TIC 331656308 (FBS 0433+759) is a new sdB pulsator. Our fit to a spectrum taken with the NOT in 2022 gives Teff = 28 411(230) K, log(g/cm s−2) = 5.36(3) and log(n(He)/n(H)) = –2.95(11), and we classified the star as an sdB. TESS observed the star during Sectors 52, 53, and 59. The frequency content significantly varies over time and we decided to analyze each contiguous set separately. Therefore, Sectors 52 and 53 were merged, but Sector 59 data were treated separately. We detected four and five frequencies in the former and latter data sets, respectively. One out of three frequencies were detected in the g-mode region, which makes the star a hybrid pulsator. The total power of p-mode signals during Sector 59 is smaller than during Sectors 52–53, while the power of g-mode signals are quite opposite. Energy transferred between modes through nonlinear coupling is a possible explanation for such a variable pulsation spectrum (Zong et al. 2016). We show the amplitude spectrum for Sector 59 data in Fig. A.1 and we list the prewhitened frequencies from both data sets separately in Table 2.
TIC 392092589 (Ton 4) is a new sdB pulsator. It was classified as a hot subdwarf by Pérez-Fernández et al. (2016). Our fit to a spectrum taken with the NOT in 2015 gives Teff = 27 654(280) K, log(g/cm s−2) = 5.40(4) and log(n(He)/n(H)) = –2.97(10), and we confirm the sdB classification. TESS observed the star during Sectors 44–46. We detected four frequencies, three g-modes, and one p-mode. Two additional g-mode frequencies may be seen in the middle panel, however, their amplitudes do not meet our detection limit. We show the amplitude spectrum in Fig. A.1 and list the prewhitened frequencies in Table 2.
4.2. Targets observed in the USC mode
For all targets observed in the USC mode, there is also corresponding SC data available. In addition, some targets listed below were observed during specific Sectors (1–13) in SC mode as USC was not available. The Nyquist frequency of USC data (25 000 μHz) is well beyond expected pulsation frequencies and so USC provides us with a unique frequency identification. As such we decided not to include any SC data in this paper, even those taken in sectors without available USC data. Table 1 provides detailed sector information, including sectors with SC data that were not used in our analyses. We show the amplitude spectra of SC-observed sdBV stars in Figs. 2 through A.6 and provide the seismic properties in Table B.1.
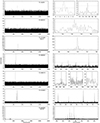 |
Fig. 2. Amplitude spectra of targets observed in the USC mode. If sector is not specified, we included all USC data. Left panels: Frequency range up to the Nyquist frequency. Right panels: Close-ups of the detected frequencies. |
TIC 4632676 (Ton 74) is a new sdOB pulsator. The star was classified as an sdB star in the Palomar-Green (PG) survey (Green et al. 1986). Then, the star was found to be a binary system consisting of sdB and dM stars by Luo et al. (2016). Recently it was reclassified as an sdOB star by Lei et al. (2019a). TESS observed the star during Sector 49. We detected two frequencies, one in the very low frequency region, which can be interpreted as a binary frequency (orbital period of 2.619(15) days), and one in the high frequency region that we associate with a p-mode. We show the amplitude spectrum in Fig. 2 and list the prewhitened frequencies in Table B.1.
TIC 26291471 (HE 1450-0957) is a known sdOB pulsator. Lisker et al. (2005) derived its atmospheric parameters indicative of an sdOB type and Østensen et al. (2010a) detected two high-frequency signals. TESS observed the star during Sector 51. We detected only one frequency in the high frequency region that we associated with a p-mode. It is close but does not overlap with frequency f1 reported by Østensen et al. (2010a). We show the amplitude spectrum in Fig. 2 and we list the prewhitened frequency in Table B.1.
TIC 55753808 (PG 1203+574) is a new sdOB pulsator. The star was originally classified as an sdB by Green et al. (1986). Lei et al. (2019b) derived spectroscopic parameters and classified the star as an sdOB. TESS observed the star during Sectors 41 and 48. These two data sets are many sectors apart and we decided not to merge both sets, but to analyze them separately. We detect the same single p-mode frequency in each data set. The amplitude spectra also show low frequencies, which are characteristic of binary frequencies. Our contamination analysis revealed that the binary signal comes from neighboring TIC 55753802, which is a known binary star and we provide no further analysis of this signal. We show the amplitude spectrum for Sector 41 data in Fig. 2 and we list the prewhitened frequency in Table B.1.
TIC 56863037 (DT Lyn) is a known sdB pulsator. The star was originally classified as an sdB-O by Green et al. (1986). Koen et al. (1999) obtained photometry and a spectrum, which allowed them to sharpen the classification to sdB, and detect three p-modes. Randall et al. (2007) independently classified the star as an sdB and reported seven p-modes. They performed an asteroseismic analysis and delivered structural parameters of the star, e.g. log Menv/M* = –4.69 ± 0.07, M* = 0.39 ± 0.01 M⊙, and R/R⊙ = 0.133 ± 0.001. TESS observed the star during Sector 47. We detected five frequencies out of which four were previously reported by Randall et al. (2007). Frequency f3 was not detected before, however, we measured it at S/N < 5 so it is only a tentative detection. We show the amplitude spectrum calculated from all data in Fig. 2 and we list the prewhitened frequencies in Table B.1.
TIC 60985176 (BI Ari) is a known sdOB pulsator. It was originally classified as an sdB-O by Green et al. (1986). Koen et al. (2004) constrained the classification to sdB with a G0V–G2V companion and reported a discovery of one p-mode with a period near 164 s. Reed et al. (2006) confirmed this period and detected another five. Our fit to a spectrum taken with the NOT in 2022 gives Teff = 35 488(272) K, log(g/cm s−2) = 5.49(5), and log(n(He)/n(H)) = –1.74(9); thus, we classified the star as an sdOB. We did the fit assuming the object is a single star. TESS observed the star during Sectors 42 and 43 and we detected three frequencies, the same one as reported by Koen et al. (2004) and later by Reed et al. (2006), which continues to be the highest-amplitude pulsation in this star. The other two frequencies should be considered tentative. Our f2 (8353.72 μHz) is 8.37 μHz away from Reed et al. (2006)’s f2 (8362.09 μHz) and our very high-frequency f3 (15350.16 μHz) is nearly twice that of Reed et al. (2006)f3 if the latter is off by a daily alias, which could be expected from single-site ground-based data. While Reed et al. (2006) also used 20 s integrations, they did not investigate past 10 000 μHz. We show the amplitude spectrum in Fig. 2 and list the prewhitened frequencies in Table B.1.
TIC 63168679 (Gaia DR3 675213084211549696) is a new sdOB pulsator. The star was classified as an sdOB by Lei et al. (2020). TESS observed the star during Sectors 44 and 46, from which we detected ten frequencies. We show the amplitude spectrum in Fig. 2 and we list the prewhitened frequencies in Table B.1. We detect possible multiplets around 6660 and 7340 μHz. The frequency spacing between f1 and f3 is comparable to the one between f7 and f8. However, f2 is not located equidistant from f1 and f3. If this is a triplet it is very asymmetric. Higher frequency resolution is required to make a definite statement whether these are multiplets but if confirmed, the rotation period would be around 10.5 days.
TIC 68495594 (HD 265435) is a known sdOB pulsator. This star has been extensively studied prior to our analysis by Pelisoli et al. (2021) and Jayaraman et al. (2022). Our fit to a spectrum taken with the NOT in 2018 gives Teff = 33 253(137) K, log(g/cm s−2) = 5.45(2), and log(n(He)/n(H)) = –1.40(5); the exposure time of 150 s is short compared to the 1.65 h orbital period, implying minimal effects of orbital line broadening. TESS observed the star during Sectors 44, 45, and 60. The latter authors analyzed only the first two sectors mentioned, while the data collected during Sector 60 were not analyzed by them. We show an amplitude spectrum for that sector in Fig. 2. It does not vary from the previous sectors significantly and we decided not to present any solution in Table B.1. Since the star shows tidally tilted pulsations, we expect some modes can come and go with time; however, the overall picture will not change. The Sector 60 data set can surely be a useful check on the model presented by Jayaraman et al. (2022); however, that is beyond the scope of this paper.
TIC 82359147 (PG 1657+416) is a known sdB pulsator. It was classified as an sdB star by Green et al. (1986). Oreiro et al. (2007) confirmed the spectral classification, detected a signature of a G5 companion, and discovered high-frequency signals. TESS observed the star during Sectors 51 and 52. We detected two frequencies, both previously reported by Oreiro et al. (2007). We show the amplitude spectrum in Fig. A.2 and we list the prewhitened frequencies in Table B.1.
TIC 88484868 (FBS 0658+627) is a new sdB pulsator. Németh et al. (2012) classified the star as an sdB. TESS observed it during Sectors 47 and 60. Since these two sectors are too far apart in time, we decided not to merge data for a Fourier analysis. We detected 12 and 17 frequencies, in both the g- and p-mode regions, in Sectors 47 and 60, respectively. Although the p-mode frequencies are amplitude dominant, we detected more frequencies in the g-mode region. While the amplitudes change between sectors, most of the frequencies are detected in both sectors. f1–f9 from Sector 47 are recovered in Sector 60; however, surprisingly, the frequencies of the highest-amplitude three near 2745 μHz are different with the dominant amplitude nearly doubling in Sector 60. These three frequencies may also be a rotationally split triplet, but the frequency splitting is not symmetricm and it changes between sectors, making this interpretation less likely. We show the amplitude spectrum for Sector 60 data in Fig. A.2, and list the prewhitened frequencies in Table B.1.
TIC 88565376 (DW Lyn) is a known sdB pulsator. It was classified as an sdB, based on spectroscopic parameters derivation, by Dreizler et al. (2002). The authors detected periodic flux variations and interpreted them by stellar pulsations. The pulsation periods were estimated around 363 and 382 s. Later, Schuh et al. (2006) collected additional data and confirmed the two periods reported by Dreizler et al. (2002) and discovered a new one in the g-mode region. The authors explained this newly detected signal as stellar pulsation, making it the first known hybrid sdBV star. TESS observed the star during Sectors 47 and 60. We only detected the two p-mode frequencies reported in previous papers. We show the amplitude spectrum calculated from Sector 47 data in Fig. A.2 and we list the prewhitened frequencies in Table B.1. We did not detect the low-frequency signal, although if its amplitude remained fairly constant over time, it would be clearly detected in our analysis. In fact, the p-mode amplitudes of Sector 60 are nearly the same as reported by Schuh et al. (2006) for 2004 data. Therefore, we might expect the g-mode amplitude to be roughly preserved, although it appears it has not.
TIC 90960668 (V585 Peg, Balloon 090100001) is a known sdB pulsator. This star has been extensively studied prior to our analysis by Oreiro et al. (2004), Baran et al. (2009), Telting & Østensen (2006), Van Grootel et al. (2008a) and others. TESS observed the star during Sector 56. These data are published by Reed et al. (2023) and hence we only show the amplitude spectrum in Fig. A.2 and refer readers to the latter paper for details on results of TESS data.
TIC 114196505 (Gaia DR3 4187241720861658624) is a new sdB pulsator. Our fit to a spectrum taken with the NOT in 2022 gives Teff = 27 594(442) K, log(g/cm s−2) = 5.30(6) and log(n(He)/n(H)) = –2.99(19), and we classified the star as an sdB. TESS observed the star during Sector 54. We detect two frequencies, which we list in Table B.1 and show the amplitude spectrum in Fig. A.2. The frequency in the g-mode region has low S/N and should be confirmed.
TIC 136975077 (V2203 Cyg) is a known sdB pulsator. It was classified as an sdB by Downes (1986). Billères et al. (1998) derived an independent estimate of spectroscopic parameters and confirmed the sdB type and detected five pulsation frequencies in photometry. Koen (1998) re-observed the star and increased the number of detected frequencies to seven. Jeffery & Pollacco (2000) used spectroscopic data to measure radial velocities of pulsations and detected two frequencies that were previously reported from both photometric analyses. Zhou et al. (2006) analyzed multi-site photometric data and detected six out of seven frequencies reported by Koen (1998). The missing one was the lowest amplitude frequency in Koen (1998)’s analysis. TESS observed the star during Sectors 55 and 56. We detected seven frequencies. We show the amplitude spectrum in Fig. A.2, and we list the prewhitened frequencies in Table B.1. Comparing our detection with the one presented by Koen (1998), there is a difference in detecting close frequencies. Koen (1998) found two close frequencies at 5413 μHz, while we found only one in that region. On the other hand we found an additional frequency close to the highest amplitude one, f2 and f1, respectively. We stress, however, that the frequency spacing between these two peaks is comparable to the resolution, so f2 may just be a residual signal caused by the unstable frequency/amplitude of f1. Our detection of seven frequencies with an amplitude order very similar to that reported more than 20 yr ago, means that the pulsation mechanism remained stable in this star.
TIC 137502282 (FBS 0844+792) is a new sdOB pulsator. Our fit to a spectrum taken with the INT in 2019 gives Teff = 34 259(267) K, log(g/cm s−2) = 5.79(5) and log(n(He)/n(H)) = –1.31(7), indicating an sdOB classification. TESS observed the star during Sectors 40, 47, 53 and 60. We detect the same two frequencies of comparable amplitudes in all sectors. While the frequencies remain significant in all four sectors, the amplitude varies significantly, namely, 2.1, 3.01, 1.47 and 3.59 ppt, 3.76, 3.32, 3.66, and 3.91 ppt, for Sectors, 40, 47, 53, and 60, as well as the lower and higher frequencies, respectively. Since merging all data together leads to a complex window function without detecting additional pulsations, we only present results from Sector 60 data analysis. We show the amplitude spectrum in Fig. A.2, and list the prewhitened frequencies in Table B.1.
TIC 138618727 (KL UMa, Feige 48) is a known and well-studied sdB pulsator. Graham (1970) was the first who classified it as an sdB star. Spectroscopic estimates were reported by Koen et al. (1998), who confirmed an sdB type, and discovered five frequencies associated with short-period pulsations modes. Reed et al. (2004) collected multi-site and multi-year photometry and reported five frequencies although some were daily aliases away from those reported by Koen et al. (1998). Reed et al. (2004) presumed three of the frequencies formed an asymmetric triplet and predicted a rotation period that was subsequently found to match a binary period with a white dwarf companion discovered by O’Toole et al. (2004). Reed et al. (2004) also examined pulsation stability, deriving an upper limit evolutionary scale of Ṗ/P = 4.9 ± 5.3 × 17−16 s−1. Charpinet et al. (2005a) reported four frequencies and their results of period fitting, which provided physical parameters of the star, for instance, log Menv/M* = –2.97 ± 0.09, M* = 0.460 ± 0.008 M⊙, and R/R⊙ = 0.2147 ± 0.0034. Van Grootel et al. (2008b) tested a spin-orbit synchronism and concluded that KL UMa rotates as a solid body in a tidally locked system. Subsequently, Reed et al. (2012) obtained time-resolved spectroscopy and additional photometry, which slightly shortened the binary period to 0.342(8) d, making the rotation (0.418 d) slightly subsynchronous. TESS observed the star in Sectors 41 and 48. The amplitude spectra in each sector do not contain the exactly the same signal and we decided not to merge data from both sectors. We show the amplitude spectrum for Sector 41 data in Fig. A.3 and list the prewhitened frequencies in Table B.1. We detected two low-frequency signals, which we interpreted as a binary frequency and its harmonic. With TESS’s precision, the orbital solution derived from combined two sectors becomes 0.3436074(8) d, in agreement with the Reed et al. (2012) value. These signals are the first detection of the binary signal in photometric data. In addition, we detected seven and six high-frequency signals in Sectors 41 and 48, respectively. Frequency f3 detected in the former data set is not significant in the latter one. Frequency 2877.16 μHz seems to be accompanied by two low amplitude sidelobe frequencies, one on each side. The frequency spacing is not equal on both sides so it does not call for a rotationally split modes, although the lower-frequency signal is spaced twice as much as the higher-frequency signal. It is still possible the three frequencies are part of a quintuplet with a frequency splitting of 1.5 μHz. This would lead to a rotation period of 7.7 d, which is not consistent with previous conclusions.
TIC 142398823 (PG 1315+645) is a new sdOB pulsator. It was classified as an sdOB+MS by Geier et al. (2017). TESS observed the star during Sectors 41, 48, and 49. The window function of the combined data is very complex, which prohibits a unique frequency selection for prewhitening. Therefore, we decided to use only combined Sectors 48 and 49 and we detected two frequencies. We show the amplitude spectrum in Fig. A.3 and list the prewhitened frequencies in Table B.1.
TIC 159644241 (KIC 10139564) is a known sdB pulsator. It was classified as an sdB star by Østensen et al. (2010b) and extensively observed during the Kepler mission. Those data were extensively studied (Kawaler et al. 2010; Baran et al. 2012; Baran & Østensen 2013; Zong et al. 2016), likely making it the best-solved p-mode sdBV star and we refer readers to those papers which contain substantial analyses. TESS observed the star during Sectors 40, 41, 54, and 55. We detected three frequencies: two in the previously identified triplet, namely, f33 and f35 listed by Baran et al. (2012), and one identified as a singlet, namely, f18. We show the amplitude spectrum in Fig. A.3 and we list the prewhitened frequencies in Table B.1.
TIC 165312944 (KY UMa) is a known sdB pulsator. Based on spectroscopic parameters, Koen et al. (1999) classified it as an sdB star. The authors also reported four pulsation periods. Charpinet et al. (2005b) detected nine frequencies, including four reported by Koen et al. (1999) and derived structural parameters of the star using asteroseismology, for instance, log Menv/M* = –4.254 ± 0.147, M* = 0.457 ± 0.012 M⊙, and R/R⊙ = 0.1397 ± 0.0028. Reed et al. (2009) obtained time-resolved spectroscopy, detecting four previously known frequencies and low-amplitude occasional transients. They inferred temperature and gravity changes for the four main frequencies. TESS observed the star during Sectors 48 and 49. We detected nine frequencies, including the four main ones originally reported by Koen et al. (1999). The amplitudes vary over time and during TESS monitoring a signal at 7490 μHz became the highest amplitude one. In fact, this signal seems to be split into three components separated slightly asymmetrically by 0.74 and 0.69 μHz. If the signal was in a rotationally split mode, the average rotation period would equal 16.3 d. We do not see other peaks indicative of multiplets. We show the amplitude spectrum for Sectors 48 and 49 data in Fig. A.3 and we list the prewhitened frequencies in Table B.1.
TIC 166054500 (PG 1409+605) is a new sdB pulsator. Green et al. (1986) classified it as an sdB-O. Geier et al. (2017) derived an sdOB classification and a hint of a main sequence companion. Based on a spectrum taken with the NOT in 2022 we derived an sdB+F classification but the quality of the spectrum is not sufficient to derive a reliable spectroscopic fit. TESS observed the star during Sectors 48 and 49. We detected only one frequency, which we list in Table 2, while we show the amplitude spectrum in Fig. A.3.
TIC 175402069 (NY Vir, PG 1336−018) is a known sdB pulsator. The star was found to be an eclipsing binary of an HW Vir type with a pulsating sdB primary by Kilkenny et al. (1998). The authors reported 0.1 d orbital period and two short-period flux variations associated with stellar pulsations. The system has become a subject of very intense investigation ever since. The analysis commonly undertaken was related to eclipse timings to search for additional companions to the system and (more essential with respect to this paper) the asteroseismic investigation to derive structural properties of the primary. Kilkenny et al. (2003) reported a list of 28 pulsation periods detected in photometric data collected during a multi-site campaign and Reed et al. (2002) found the first evidence for tidally-tipped pulsations for an sdBV star, aligning and precessing with the companion. Charpinet et al. (2008) used the Kilkenny et al. (2003) list for an asteroseismic analysis, along with the derived parameters of the primary sdB star, for instance: log Menv/M* =–4.54 ± 0.07, M* = 0.459 ± 0.005 M⊙, and R/R⊙ = 0.151 ± 0.001. TESS observed the star during Sectors 46 and 50. The data were first cleaned of the binary flux variation. The amplitude spectra calculated from both sectors are different and we decided not to merge both data sets together. We detected 11 and 12 frequencies in Sectors 46 and 50, respectively. We skipped signals at an orbital frequency from the highest amplitude frequency. We considered these signals to be artifacts caused by a pulsation phase change during eclipses. Four frequencies were not reported before, i.e. f1, f4, f8, and f2, f7 in Sectors 46 and 50, respectively. Frequencies f4 and f7 should be confirmed with more precise data. We show the amplitude spectrum for Sector 46 data in Fig. A.3 and list the prewhitened frequencies in Table B.1.
TIC 178081355 (FBS 0315+417) is a new sdOB pulsator. It was classified as an sdOB by Geier et al. (2017). TESS observed the star during Sector 58. We detected three frequencies. We show the amplitude spectrum in Fig. A.3 and we list the prewhitened frequencies in Table B.1.
TIC 191442416 (V429 And) is a known sdB pulsator. It was classified as an sdB star by Østensen et al. (2001a). The authors reported a detection of four pulsation periods. Reed et al. (2007a) collected new photometry and detected 14 frequencies. TESS observed the star during Sector 57. We detected two frequencies, both already reported by Reed et al. (2007a). We show the amplitude spectrum in Fig. A.4, and list the prewhitened frequencies in Table B.1.
TIC 202354658 (PG 1544+601) is a new sdB pulsator. It was identified as an sdB star by Green et al. (1986). TESS observed the star during Sectors 48–51 and 58. Since Sector 58 data are several months apart from the bulk of continuous data and this standalone dataset does not allow for detecting additional frequencies, we decided to analyze only data collected during Sectors 48–51. We detected eight frequencies. We show the amplitude spectrum for Sectors 48–51 data in Fig. A.4 and we list the prewhitened frequencies in Table B.1. The amplitude spectrum looks quite interesting. It contains two high amplitude frequencies, f2 and f5. The higher one, f5, is surrounded by two nearby frequencies spaced by 0.67 μHz, on average. If this is the rotationally split triplet, the rotation period is 17.3 d. In addition, both frequencies f2 and f5 are surrounded by low amplitude frequencies spaced exactly by 2.09 μHz. This frequency spacing would give 5.5 d rotation period. However, we lean towards interpreting the latter period as an orbital period. We did not detect any signal at 2.09 μHz, which would confirm our hunch, so follow-up spectroscopic velocities would be required to determine whether this star is a binary.
TIC 207440586 (LM Dra) is a known sdOB pulsator. It was classified as an sdB by Green et al. (1986). Our fit to a spectrum taken with the NOT in 2022 gives Teff = 34 037(132) K, log(g/cm s−2) = 5.72(3) and log(n(He)/n(H)) = –1.58(7); thus, we classified the star as an sdOB. Silvotti et al. (2000) reported a detection of two pulsation periods. Reed et al. (2007b) analyzed an extended coverage photometric data and reported six frequencies. TESS observed the star during Sectors 49–52 and 56. The pulsations are very unstable in this star and merging all data together makes prewhitening very challenging. We decided to analyze only Sector 56 since they are described with a significantly lower noise level, allowing for the detection of all signals that are present in each sector data set but with higher S/N. We detected three frequencies, all of them previously reported by Reed et al. (2007b). We show the amplitude spectrum for Sector 56 data in Fig. A.4, and list the prewhitened frequencies in Table B.1.
TIC 219492314 (V1078 Her) is a known sdOB pulsator. It was classified as an sdOA by Green et al. (1986), while as an sdO by Wegner & Dupuis (1993). Lei et al. (2019a) identified the star as an sdOB. Kuassivi et al. (2005) detected one pulsation mode at the surface. TESS observed the star during Sectors 51 and 52. We detected only one frequency, which is the same one as reported by Kuassivi et al. (2005). We show the amplitude spectrum in Fig. A.4 and list the prewhitened frequencies in Table B.1.
TIC 240868270 (GD 274) is a new sdOB pulsator. For a long time it was considered to be a white dwarf candidate until Lei et al. (2023) classified the star as an sdOB+F9.5VI system. TESS observed the star during Sector 58. We detected five high frequencies associated with stellar pulsations and three low frequencies that are likely related to the binary flux variation. The latter variation is highly non-sinusoidal and three frequencies are not linear combinations, including harmonics. We denoted them with upper case letters. We show the amplitude spectrum in Fig. A.4 and list the prewhitened frequencies in Table B.1.
TIC 266013993 (PG 0048+091) is a known sdB pulsator. Koen et al. (2004) classified the star as an sdB and reported a flux variability interpreted as stellar pulsations. Reed et al. (2007b) listed 28 frequencies, noting that the amplitude spectrum is very variable. PG 0048+091 was observed as part of the K2 mission (Reed et al. 2019) and we refer the reader to that paper as the most complete study. TESS observed it during Sectors 42 and 43 and we detect four frequencies with well defined profiles indicating they are amplitude and frequency stable during TESS’s two month coverage. We find frequencies in the list presented by Reed et al. (2007b) within a few μHz. We show the amplitude spectrum in Fig. A.4, and list the prewhitened frequencies in Table B.1.
TIC 273255412 (GALEX J201337.6+092801) is a known sdB pulsator. It was classified as an sdB and a flux variability interpreted as stellar pulsations was discovered by Østensen et al. (2011). The authors listed 16 frequencies. TESS observed the star during Sector 54. We detected 26 frequencies, however, the profiles of peaks are complex, which means that the frequencies and amplitudes are not stable or that there are unresolved multiplets. Compared with the list presented by Østensen et al. (2011) we confirm eight frequencies: four are within a few μHz, while another four had not been detected before. Frequency f1 had not been detected before and if it is shown to be a pulsation frequency, it may be associated with gravity modes, making the star a hybrid pulsator. We show the amplitude spectrum in Fig. A.4 and list the prewhitened frequencies in Table B.1.
TIC 284692897 (V2214 Cyg, KPD 1930+2752) is a known sdB pulsator. It was classified as an sdB by Downes (1986). Billéres et al. (2000) reported 44 pulsation frequencies and an ellipsoidal variation in the sdB+WD binary system. Maxted et al. (2000) concluded that the star is a good candidate for the progenitor of a Type Ia supernova of this type, which will merge on an astrophysically interesting timescale. Reed et al. (2011) analyzed multisite photometric data and reported 68 frequencies and additional 13 suspected frequencies. They also reported tidally-tipped pulsations as well as binary-phase-dependent pulsations produced by tidal forces. Our fit to a spectrum taken with the NOT in 2022 gives Teff = 34 594(236) K, log(g/cm s−2) = 5.53(5), and log(n(He)/n(H)) = –1.61(8); thus, we classified the star as an sdB. TESS observed the star during Sectors 40, 41, and 54. We merged and analyzed only the consecutive Sectors 40 and 41 data. We detect 14 pulsation frequencies and two related to binarity. For an ellipsoidal variable the dominant amplitude frequency is half the orbital period. All but four pulsation frequencies were reported by Reed et al. (2011). The new frequencies are f5, f7, f13, and f14. We show the amplitude spectrum for Sectors 40 and 41 in Fig. A.5; thus, list the prewhitened frequencies in Table B.1.
TIC 309807601 (PG 1455+501) is a new sdB pulsator. It was classified as an sdB by Green et al. (1986), while Geier et al. (2017) reported an sdB+F2 classification. TESS observed the star during Sectors 49 and 50. We detected two high frequencies. We show the amplitude spectrum in Fig. A.5 and list the prewhitened frequencies in Table B.1.
TIC 310937915 (EP Psc) is a known sdOB pulsator. It was classified as an sdB by Green et al. (1986). Silvotti et al. (2002a) derived spectroscopic parameters that indicate an sdOB type and they reported the discovery of three pulsation periods. Our fit to the average of ten spectra taken with the NOT gives Teff = 34 465(131) K, log(g/cm s−2) = 5.74(2), and log(n(He)/n(H)) = –1.67(5). TESS observed the star during Sector 42. We detected only one frequency, which was the highest amplitude one reported by Silvotti et al. (2002a). We show the amplitude spectrum in Fig. A.5 and list the prewhitened frequency in Table B.1.
TIC 355754830 (GALEX J063952.0+515658) is a known sdB pulsator. It was classified as an sdB by Németh et al. (2012). Vučković et al. (2012) reported the results of an analysis of multi-site photometric data and reported a signal in both high and low frequency regions, making it a hybrid pulsator. TESS observed the star during Sector 60. We detected 14 frequencies: 4 in the low- and 10 in the high-frequency regions, confirming it as a hybrid pulsator. We stress that some of the frequencies around the highest amplitude frequency may be residuals of amplitude or phase instability and not independent frequencies. We show the amplitude spectrum in Fig. A.5 and list the prewhitened frequencies in Table B.1.
TIC 357232133 (GALEX J074149.0+552451) is a new sdOB pulsator. It was classified as an sdB by Németh et al. (2012) and reclassified as an sdOB by Geier et al. (2017). TESS observed the star during Sectors 47 and 60. To avoid a complex window function, we analyzed Sector 47 data only. We detected four frequencies. We show the amplitude spectrum for Sector 47 data in Fig. A.5 and list the prewhitened frequencies in Table B.1.
TIC 364966239 (Gaia DR3 2235556213015091456) is a new sdOB pulsator. Our fit to a spectrum taken with the NOT in 2019 gives Teff = 33 587(241) K, log(g/cm s−2) = 5.70(5), and log(n(He)/n(H)) = –1.50(7); thus, we classified the star as an sdOB. TESS observed the star during Sectors 41, 47, 54–57, and 60. To avoid complex peak profiles and difficulties with prewhitening, we combined and analyzed Sectors 54–57 and 60. We detected four frequencies, with three of them indicating a rotationally split triplet. The average frequency splitting indicates a rotation period of 20.141(21) d. We show the amplitude spectrum for Sectors 54–57 and 60 data in Fig. A.5 and list the prewhitened frequencies in Table B.1.
TIC 397595169 (V391 Peg) is a known sdB pulsator. It was found to be a pulsator and classified as an sdB by Østensen et al. (2001b). The authors reported one high frequency. Silvotti et al. (2002b) analyzed multi-site photometric data and detected five frequencies. Pulsation frequencies were used by Silvotti et al. (2007) to infer the presence of a planet orbiting the sdB star; however, its presence is still uncertain (Silvotti et al. 2018). TESS observed the star during Sector 56. We detect two frequencies, which were found to be the two highest in Silvotti et al. (2002b). We show the amplitude spectrum in Fig. A.5 and list the prewhitened frequencies in Table B.1.
TIC 424720852 (GALEX J193832.5+560944) is a known sdB pulsator. Holdsworth et al. (2017) derived spectroscopic parameters and classified the star as an sdB. They detected one short period and interpreted it as a stellar pulsation. TESS observed the star during Sectors 40, 41, 50, 54–57, and 60. We split all data into two subsets and analyzed them separately. The first one includes the first two sectors, while the second one contains the remaining data sectors. We detected signals in both low- and high-frequency regions. In the former, we found one and five frequencies in the first and second subsets, respectively. In the latter we found eight frequencies in both subsets. We show the amplitude spectrum calculated from Sectors 50, 54–57, and 60 in Fig. A.6. We list the prewhitened frequencies in Table B.1.
TIC 441725813 (Gaia DR3 1655107708129775744) is a new sdB pulsator. Our fit to a spectrum taken with the NOT in 2017 gives Teff = 27 204(141) K, log(g/cm s−2) = 5.37(2), and log(n(He)/n(H)) = –2.93(5); thus, we classified the star as an sdB. TESS observed the star during Sectors 40, 41, 47–52, and 55–60. The amplitude spectrum is very rich in frequencies in the low frequency region. It makes the star a g-mode-dominated sdB pulsator. To avoid a complex window function we separated all data into three subsets to make them continuous in coverage. The most signals exist in the subset of Sectors 55–60 data. The other subsets do not show any additional signals. We are aware that merging all data together would lower the noise level in an amplitude spectrum the greatest extent; however, unstable pulsation modes contribute with residuals too strongly and no extra frequencies around the dominant signals could be conveniently detected. In addition, we only prewhitened signals above 2300 μHz, which could be associated with pressure modes. Frequencies in the low-frequency region require individual analysis, which is beyond the scope of this work. We detected 14 frequencies that we associated with pressure modes. The most noticeable signal appears around 2769 μHz. There are three frequencies symmetrically spaced, which we interpret as rotationally split modes, suggesting a rotation period of 17.188(18) d. We show the amplitude spectrum for Sectors 55–60 data in Fig. A.6, and list the prewhitened frequencies in Table B.1.
TIC 471015194 (Gaia DR3 2238354611842566912) is a known sdB pulsator. Prins et al. (2019) reported a discovery of a frequency at 5789.6 μHz. Our fit to a spectrum taken with the NOT in 2017 gives Teff = 33 150(592) K, log(g/cm s−2) = 5.71(12) and log(n(He)/n(H)) = –2.93(44), and we classified the star as an sdB. TESS observed the star during Sectors 40, 41, 47, 50, 54–57 and 60 in which we detect five frequencies. The highest amplitude frequency, f3, overlaps with the one reported by Prins et al. (2019). We show the amplitude spectrum in Fig. A.6, and list the prewhitened frequencies in Table B.1.
5. Discussion
In the northern ecliptic hemisphere we found 35 sdB and 15 sdOB p-mode pulsating stars, including 27 (18 sdB and 9 sdOB) new pulsators. Overall, including the Southern Ecliptic hemisphere, with TESS data we detect p-mode pulsations in 93 hot subdwarfs, including 67 sdB, 23 sdOB, 2 sdO and 2 He-sdOB stars. Among the 48 new pulsators discovered with TESS, we identified 35 sdB, 12 sdOB and one He-sdOB stars.
5.1. Detection of pulsating hot subdwarfs with TESS
As this study rounds out a TESS survey of both hemispheres, it is prudent to do a completeness study. However, such a study has many complexities (including but not limited to) the fact that TESS is a small-aperture telescope with large pixels and sdB stars tend to be on the faint end of its detection capability. Pulsation amplitudes in sdBV stars also vary substantially between stars, and often even within the same star over time (e.g., Kilkenny 2010). The highest pulsation amplitude of stars in this paper varies from under 1 to over 70 ppt, greatly affecting how bright the star would need to be to have a sufficient S/N to be detected by TESS. Additionally, some stars are observed during multiple sectors, which reduces the detection threshold. To make a proper, statistically significant determination would require an examination of all non-pulsators as well as the pulsators in this work and should perhaps include the g-mode pulsators (excluded here). Pixel decontamination from nearby stars and multi-sector normalization would also need to be completed. That analysis will be a future paper unto itself, initiated with the first-cut simplification of the detection likelihood described below.
This can be done two ways. The first is to compare pulsation detection thresholds with brightness to the pulsation amplitudes actually observed by TESS. As pulsation amplitudes are brightness-independent, the pulsations listed in these papers should be representative of p mode sdBV pulsations in general. By comparing the highest-amplitude pulsation for each star (Amax, as only one pulsation needs to be detected to be considered a pulsator) with magnitude-averaged detection limits, we can estimate what fraction of pulsators would likely not be detected for a given magnitude. The black dots in the bottom panel of Fig. 3 are the 5.5σ detection limits for each of the TESS-observed p-mode pulsators. As expected, thresholds increase for fainter stars and beyond G = 15.25, the scatter is quite large. We calculated the average detection limits as 12–12.5 (0.385 ppt), 14–14.5 (1.65 ppt), and 14.75–15.25 (3.08 ppt). In the top panel of Fig. 3, we compare these results with Amax of each TESS-observed p-mode pulsator, accumulating from the lowest to highest amplitude. To keep the lower amplitudes visible, we set the cut-off at the 90th percentile (14 ppt). The red horizontal lines indicate the average detection limit for the three brightness ranges from the bottom panel and amplitudes below those lines indicate stars which would not likely be detected as pulsators for that brightness limit. For single-sector TESS observations, the lowest-amplitude 2% of our pulsators would have been missed at magnitude 12–12.5, 9% at 14–14.5, and 27% at 14.75–15.25.
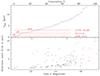 |
Fig. 3. Tests of detection completeness. Bottom panel: Black circles indicate single-sector detection limits of p-mode sdBV stars observed by TESS. Green circles and red triangles are not detection limits, but Amax for stars listed in Østensen et al. (2010a) that were observed by TESS. The green circles indicate stars in which pulsations were detected (amplitudes from TESS data), while red triangles indicate stars in which pulsations were not detected by TESS, Østensen et al. (amplitudes as listed in 2010a). Green arrows indicate the stars TIC 90960668 and TIC 88565376, which have amplitudes too high to appear in this figure. Top panel: Amax of p-mode sdBV stars (black triangles) detected by TESS from low to high amplitude. The red lines indicate detection limits for those magnitude ranges and what fraction of detected sdBV stars would be undetected based on Amax. |
A second simple exercise is to examine a set of p-mode pulsators known previous to TESS that were observed by TESS to see if we found them as pulsators. For this exercise we used the 49 sdBV stars listed in Table 9 of Østensen et al. (2010a) of which TESS observed 45. TESS detected 30 as pulsators, with the TESS Amax for those stars indicated with green open circles in the bottom panel of Fig. 3. TESS did not detect 14 stars and their Amax, as listed in Østensen et al. (2010a), are indicated with red triangles. Overall, 24 of 25 (96%) stars brighter than magnitude 15.25 were detected by TESS, but only 6 of 19 (32%) fainter stars were detected. The undetected star PG 1419+081, with V = 14.9, has an Amax of 7 ppt in Østensen et al. (2010a) and we find a TESS detection threshold of 3.00 ppt, so clearly it should have been detected were the pulsation amplitudes the same as in Østensen et al. (2010a).
The results from the first of these simplistic tests indicate that TESS likely missed some bright (G < 15.25) p-mode sdB pulsators, whereas the second test suggests incomplete detections only for G > 15.25. However, the ground-based Østensen et al. (2010a) sample, which was observed for much shorter durations, all had Amax ≥ 3 ppt. This is likely a selection effect of the shorter-duration observations whereas our month-long TESS observations detect pulsators with Amax as low as 1 ppt. For both tests, beyond G = 15.25, TESS very likely misses pulsators and we would suggest that even some bright ones were missed. A more rigorous detection likelihood will be completed in an upcoming paper.
5.2. Evolutionary status and instability strip
Figure 4 shows the distribution, in the log g–Teff plane, of p-mode, and hybrid hot subdwarf pulsators monitored by TESS in both the southern and northern ecliptic hemispheres. Only stars with reliable estimates of their atmospheric parameters from spectroscopy are represented (see Table 3). This sample allows us to more densely map the instability region where p-mode pulsations are found and compare it with the evolutionary tracks and theoretical predictions from non-adiabatic pulsation calculations.
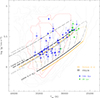 |
Fig. 4. Distribution in the surface gravity (log g) – effective temperature (Teff) plane of the hot subdwarf stars observed by TESS throughout cycle 1–4 and displaying p-mode pulsations. Pure p-mode pulsators (V361 Hya stars) are represented as blue dots. Hybrid pulsators also featuring g-modes (DW Lyn stars) are shown as green dots. Superimposed to this sample, the ZAEHB and TAEHB positions are indicated for an assumed core mass of 0.47 M⊙ (black curves) and 0.55 M⊙ (grey curves), illustrating how the EHB location depends on stellar mass. The models that materialize the EHB tracks are computed with the STELUM code for the specified core mass and varying envelope masses such as D(H) ≡ log[Menv/Mcore + Menv)] = –6.0, –5.0, –4.5, –4.0, –3.5, –3.0, –2.75, –2.5, –2.25, and –2.0, from high to low Teff. These models incorporate in their envelope nonuniform iron abundance profiles derived from equilibrium between radiative levitation and gravitational settling (see text for details). For comparison purposes, typical 0.47 M⊙ tracks assuming solar uniform envelope composition are also represented (yellow curves; Charpinet et al. 2000; Dorman et al. 1993). Dotted-line contours in the background represent the predicted number of excited ℓ = 0 p-modes from non-adiabatic pulsation calculations as a proxy of the κ-mechanism efficiency (Charpinet et al. 2001). The three innermost contours (highlighted in red) delineate the region of the log g–Teff plane where the driving of p-modes is the strongest. |
Spectroscopic estimates of pulsating hot subdwarfs reported here and in Paper I, for which we derived an acceptable spectroscopic fits.
In this diagram, the zero age and terminal age extreme horizontal branches (ZAEHB and TAEHB) are determined from a set of static hot subdwarf models calculated with the Montréal stellar structure code STELUM (Van Grootel et al. 2013). These models span the appropriate parameter range in terms of central helium content and H-rich envelope mass to cover the entire core helium-burning phase (CHeB) and the relevant part of the EHB where p-mode pulsators are located. This is unlike many diagrams of the same kind found in the literature showing tracks from standard evolutionary models. Here, we exploit the greater flexibility of static structures to illustrate various factors that may affect the position of the theoretical EHB and that are often overlooked.
A first factor is related to the actual composition of a hot subdwarf envelope which is known to be affected by microscopic diffusion, while standard evolution models usually assume a solar homogeneous composition. Diffusion has an impact on the EHB location because the sedimentation of helium and distribution of opaque elements (in particular those from the iron group) significantly change the thermal structure of the stellar envelope and consequently the surface parameters for a given envelope mass. The trend can be seen in Fig. 4 by comparing the 0.47 M⊙ tracks derived from the STELUM models, which incorporate a double layered H/He envelope with nonuniform iron-abundance distributions from calculations of equilibrium between radiative levitation and gravitational settling (see Charpinet et al. 1997 and Van Grootel et al. 2013 for details), with standard evolution models of solar composition from Dorman et al. (1993). The difference between the two is a noticeable shift of the ZAEHB and TAEHB towards lower surface gravities when microscopic diffusion is included, actually providing a better match to the distribution of observed hot subdwarf stars.
A second factor that is generally overlooked is the influence of stellar mass. Most stars that form the EHB are expected to have the canonical mass of ∼0.47 M⊙, corresponding to the critical value for helium ignition in degenerate conditions (the so-called helium flash), since their progenitors on the main sequence are generally believed to be less than 2 M⊙ stars evolving through the red giant phase. This expectation is indeed mostly verified as the observed EHB appears as a rather homogeneous group that can be reasonably well reproduced, globally, with models assuming the same core mass. Nevertheless, even if the mass distribution of hot subdwarf stars is strongly peaked at the canonical value (Fontaine et al. 2012), scatter around that value is still expected that will lead to some fuzziness in the position of the ZAEHB and TAEHB. In addition, some binary evolution channels that are also invoked in the formation of hot subdwarfs – for instance, those involving the merger of two low-mass helium white dwarfs – could lead to masses significantly different from the canonical value. The existence of non-canonical massed sdB stars has indeed been suggested, either through asteroseismology (Randall et al. 2006; Fontaine et al. 2019) or from the orbital analysis of close binaries (e.g., Schaffenroth et al. 2022). In order to illustrate the impact of stellar mass on the EHB location, we also represented tracks computed with STELUM for a core mass of 0.55 M⊙ in Fig. 4. These show an important shift toward lower surface gravities and higher effective temperatures where post-EHB objects are usually expected when considering only tracks for the canonical mass. Clearly, this higher mass EHB can no longer account for the bulk of observed sdB stars, indicating that massive hot subdwarfs must be quite rare. However, it also shows that one cannot reliably assign an evolutionary status to a given sdB star based on its position in the log g–Teff plane, unless its mass is constrained through independent means. Hence, among the pulsators that are clearly above the 0.47 M⊙ TAEHB in Fig. 4, some are likely post-EHB stars, but a few may instead be core helium-burning (EHB) objects with a higher mass.
The last information provided in Fig. 4 is the theoretical mapping of the p-mode instability region as predicted by the original calculations of Charpinet et al. (2001). This mapping of the log g–Teff plane results from non-adiabatic pulsation calculations applied to envelope models that incorporate the same nonuniform iron profiles used in STELUM structures. It is well established that the κ-mechanism involving predominantly iron partial ionization in the Z-bump region and enhanced by radiative levitation is responsible for the driving of acoustic pulsations in V361 Hya stars (Charpinet et al. 1996, 1997). The predicted number of radial (ℓ = 0) p-modes is used in this context as a measure of the driving efficiency. Figure 4 shows that p-mode sdB pulsators clearly concentrate within the region where the driving is predicted to be the strongest (roughly within the three innermost contours). This is expected, thus supporting that the identification of the main processes that drive oscillations in these stars is correct. The true extent of the p-mode instability region remains uncertain, however. Predicted instabilities (all contours) derived from the assumption of equilibrium between radiative levitation and gravitational settling cover a wider region than the observed instability strip. Charpinet et al. (2009) demonstrated that the strength of the driving engine is predominantly determined by the amount of heavy metals (in particular iron) present at the Z-bump location, irrelevant of the composition in other parts of the envelope. The extent of the instability region is therefore sensitive to the precise amount of heavy metals that can accumulate in that region of the stellar envelope, which is likely modulated by various competing mixing processes that were not all included in the aforementioned calculations (e.g., stellar winds, thermohaline mixing; Théado et al. 2009; Hu et al. 2011). The fact that the observed instability strip is narrower than the predicted one indeed pleads for competing processes that slow down or reduce the efficiency of radiative levitation, the diffusive equilibrium assumption providing an upper limit for the amount of levitating heavy metals. It is also possible that other opaque elements, such as nickel, play a role in shaping the instability region, although Jeffery & Saio (2006a,b, 2007) showed that nickel had at least a slight impact on the p-mode instability strip location, unlike the case of the g-modes.
Overall, Fig. 4 reveals that the distribution of p-mode pulsators is compatible with the canonical ∼0.47 M⊙ EHB covering all stages of the core helium burning phase, from the ZAEHB to TAEHB. The eight sdB pulsators located well above the TAEHB could be either in a post-EHB, helium shell-burning stage, or (as discussed above) higher mass sdB stars. The numbers involved, eight versus 60 objects for the main group (i.e., a fraction of one out of eight stars) suggests that higher mass sdBs likely dominate the sample since respective evolution timescales on the EHB and post-EHB would imply a fraction closer to one out of ∼30. Hence, statistically speaking (with all due caution when small numbers are involved), among the eight outliers, only two are expected to be post-EHB stars and six hot subdwarfs with significantly higher masses.
Another interesting observation is the concentration of the coolest pulsators near the TAEHB or, equivalently, a complete lack of them in earlier stages, closer to the ZAEHB. Considering the size of the sample, we estimate that this trend is real. It could be naturally explained by the fact that at effective temperatures around 29 000 K, the intersection of the region of strongest driving efficiency occurs near the TAEHB and does not cover the earlier stages; this is contrary to the hotter regions located around 34 000 K where most V361 Hya stars are found. Interestingly, a similar trend (albeit less obvious) may exist for the hottest pulsators, above ∼34 000 K. If that was to be confirmed, the argument of the driving efficiency as mapped in Fig. 4 would not hold. A potential culprit could be the growing influence of stellar winds that become more proficient at higher effective temperatures and could thus slow down the microscopic diffusion of elements and the onset of favorable conditions for the pulsations to develop. Based on this assumption, we refrain from speculating further on this issue until the reality of the deficit of hot pulsators close to the ZAEHB is confirmed.
5.3. Pulsation periods versus Teff and log g
Charpinet et al. (2002) presented the pulsation period of p-modes as functions of Teff and log g. In their Fig. 9, they present the results for radial (ℓ = 0) and non-radial (ℓ = 1–3) modes of radial orders k = 0, 1, and 10. The pulsation periods of radial modes do not depend much on Teff, whereas they are strongly and monotonically affected by log g. For non-radial modes, both the temperature and gravity can influence the pulsation periods. These change more rapidly with temperature for low radial order cases, and with surface gravity for higher radial order cases. We note that the modal degree does not influence pulsation periods significantly.
Making such an observational plot would have two benefits. Firstly, for a given mode geometry, we can independently derive the effective temperature and/or surface gravity based on a pulsation period. Secondly, if both spectroscopic and period estimates are available, we can test structural models. To compare theoretical and observational counterparts we assume that the frequencies we plot represent the same modal degree and radial order, or that their differences do not significantly change the picture shown in Fig. 9 of Charpinet et al. (2002).
Observational counterpart of pulsation periods in function of Teff was reported by Reed et al. (2023), for instance, who noted an observational correlation between Teff and the period of the highest-amplitude pulsation (shown in their Fig. 11, which was a modified version from Reed et al. 2021). They examined both p- and g-mode hot subdwarf pulsators, although their sample was heavily dominated by the latter group. Since our work is focused on p-mode pulsators, we have significantly updated this figure in the short period range and we also plotted the pulsation periods as a function of log g. We obtained reliable estimates of Teff and log g for 41 USC and 16 SC stars, which is 61% of the p-mode pulsators reported in both Paper I and this paper. This large sample allows us to make a more detailed analysis of the relationship between the period of the highest amplitude (noted as Period (Amax) in our figures) and Teff/log g.
As mentioned in Sect. 4, we can uniquely identify the frequencies only in the USC data (except for TIC 220573709). Therefore, we used only USC stars with reliable spectroscopic estimates and plotted pulsation periods as functions of Teff and log g in Figs. 5 and 6. We used pulsation periods with the highest amplitudes, which are not necessarily of the same modal degree and radial order, as presented by Charpinet et al. (2002), in their Fig. 9. According to the surface cancellation effect, it is more likely to detect low degree modes, hence we expect those highest amplitude frequencies will likely be assigned to either ℓ = 0 or 1. The radial order remains unconstrained. Another caveat of our analysis is that the periods having the highest amplitudes can change with time. Depending on which data set is used, a pulsation period shown in Figs. 5 and 6 may not be unique. However, the range of highest-amplitude p-mode pulsation periods in a single star typically does not vary by more than 50 s for pulsations around 3500 μHz and decreases toward higher frequencies. Therefore, our selection of periods with the highest amplitudes should not significantly blur the picture in those two figures.
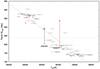 |
Fig. 5. Pulsation periods with the highest amplitudes in function of Teff. Black dots represent USC stars, open red boxes represent SC stars, a horizontal dotted line is the Nyquist period, and the solid sloped line is a fit to the USC stars. |
There are noticeable trends in both diagrams, which appear more or less linear. However there is significant scatter so it may also be slightly curved or wiggled. Given the scatter in our diagrams we are not able to discern between linear and nonlinear trends plotted in Fig. 9 of Charpinet et al. (2002). We fit lines to both data sets. Then we added SC stars to see if our sub- and super-Nyquist choices match the trends in the diagrams. The majority of SC stars go along the trend, but we found two stars in the log g diagram (Fig. 6) which do not match the fit too well. We marked them with their TIC names. Keeping in mind that our arbitrary super-Nyquist choice might not be correct, we added arrows, which indicate shifts from their super- to sub-Nyquist frequencies. The shift brings the periods of both stars significantly closer to the fit for log g. However, no shift was necessary in the Teff figure, as these two stars in that latter figure were not outliers. In the case of TIC 222892604, the shift moved the star closer to the trend, which supports the shift in the log g diagram. The case of TIC 16993518 is different. The shift in log g moves the star away from the trend, which does not support a necessity for the shift in the Teff diagram. We considered the spectroscopic determination of log g for TIC 16993518 to be reliable and since all its pulsations are within a narrow range, changing its highest amplitude frequency would have little effect. Therefore, TIC 16993518 appears to be an outlier of the trend seen in the Teff diagram.
6. Summary and conclusions
We present the results of our search for short-period hot subdwarf pulsators observed in the second and fourth years of the TESS mission. We identified 50 short-period hot-subdwarf pulsators, in addition to the 43 found in the first and third years, as reported by Baran et al. (2023). We present the list of prewhitened frequencies and we made an attempt to identify possible multiplets caused by stellar rotation.
We selected five candidates with rotation periods between 11 and 46 d. Our work completed the search for p-mode pulsating hot subdwarfs in TESS Sectors 1–60 and allowed us to present a completeness study, discuss an evolutionary status and instability strips of our findings, and compare pulsation periods vs effective temperature and surface gravity with theoretical predictions. We found that the percentage of undetected pulsators in the TESS mission reaches 25% near the 15th magnitude. We underlined the importance of a proper treatment of the hydrogen-rich envelope composition (strongly affected by microscopic diffusion processes) when comparing the distribution of hot subdwarfs in the log g–Teff plane with stellar models. We also emphasized that the stellar mass plays a significant role in understanding the instability strip. Based on the width of the p-mode instability strip, we deduced that competing mixing processes ignored in the non-adiabatic calculations must play a role to reduce the amount of levitating iron in the stellar envelope. We found that the coolest p-mode pulsators tend to cluster around the TAEHB of ∼0.47 M⊙. Finally, we derived pulsation period distributions that agree with the predicted trends in Teff and log g.
https://archive.stsci.edu
Acknowledgments
Financial support from the National Science Centre Poland under project No. UMO-2017/26/E/ST9/00703 is acknowledged. S.C. acknowledges financial support from the Centre National d’Études Spatiales (CNES, France) and from the Agence Nationale de la Recherche (ANR, France) under grant ANR-17-CE31-0018. P.N. acknowledges support from the Grant Agency of the Czech Republic (GAČR 22-34467S). The Astronomical Institute in Ondřejov is supported by the project RVO:67985815. This paper includes data collected with the TESS mission, obtained from the MAST data archive at the Space Telescope Science Institute (STScI). Funding for the TESS mission is provided by the NASA Explorer Program. STScI is operated by the Association of Universities for Research in Astronomy, Inc., under NASA contract NAS 5-26555. This paper uses observations made with the Nordic Optical Telescope, owned in collaboration by the University of Turku and Aarhus University, and operated jointly by Aarhus University, the University of Turku and the University of Oslo, representing Denmark, Finland and Norway, the University of Iceland and Stockholm University at the Observatorio del Roque de los Muchachos, La Palma, Spain, of the Instituto de Astrofisica de Canarias. This research has made use of the SIMBAD database, operated at CDS, Strasbourg, France. This paper uses observations from the 2.2 m and 3.5 m Calar Alto, 2.3 m and 4 m Kitt Peak, INT (ING), Keck, LAMOST, NTT and VLT (ESO), SOAR, and SDSS telescopes. This work has also made use of data from the European Space Agency (ESA) mission Gaia (https://www.cosmos.esa.int/gaia), processed by the Gaia Data Processing and Analysis Consortium (DPAC, https://www.cosmos.esa.int/web/gaia/dpac/consortium). Funding for the DPAC has been provided by national institutions, in particular the institutions participating in the Gaia Multilateral Agreement. V.V.G. is a F.R.S.-FNRS Research Associate. This research has used the services of www.Astroserver.org.
References
- Abrahamian, H. V., Lipovetski, V. A., Mickaelian, A. M., & Stepanian, J. A. 1990, Astrofizika, 33, 213 [NASA ADS] [Google Scholar]
- Baran, A. S., & Koen, C. 2021, Acta Astron., 71, 113 [Google Scholar]
- Baran, A. S., & Østensen, R. H. 2013, Acta Astron., 63, 79 [NASA ADS] [Google Scholar]
- Baran, A., Oreiro, R., Pigulski, A., et al. 2009, MNRAS, 392, 1092 [NASA ADS] [CrossRef] [Google Scholar]
- Baran, A. S., Gilker, J. T., Reed, M. D., et al. 2011, MNRAS, 413, 2838 [NASA ADS] [CrossRef] [Google Scholar]
- Baran, A. S., Reed, M. D., Stello, D., et al. 2012, MNRAS, 424, 2686 [NASA ADS] [CrossRef] [Google Scholar]
- Baran, A. S., Reed, M. D., Østensen, R. H., Telting, J. H., & Jeffery, C. S. 2017, A&A, 597, A95 [NASA ADS] [CrossRef] [EDP Sciences] [Google Scholar]
- Baran, A. S., Van Grootel, V., Østensen, R. H., et al. 2023, A&A, 669, A48 [NASA ADS] [CrossRef] [EDP Sciences] [Google Scholar]
- Billères, M., Fontaine, G., Brassard, P., et al. 1998, ApJ, 494, L75 [CrossRef] [Google Scholar]
- Billéres, M., Fontaine, G., Brassard, P., et al. 2000, ApJ, 530, 441 [CrossRef] [Google Scholar]
- Charpinet, S., Fontaine, G., Brassard, P., & Dorman, B. 1996, ApJ, 471, L103 [Google Scholar]
- Charpinet, S., Fontaine, G., Brassard, P., et al. 1997, ApJ, 483, 123 [Google Scholar]
- Charpinet, S., Fontaine, G., Brassard, P., & Dorman, B. 2000, ApJS, 131, 223 [Google Scholar]
- Charpinet, S., Fontaine, G., & Brassard, P. 2001, PASP, 113, 775 [NASA ADS] [CrossRef] [Google Scholar]
- Charpinet, S., Fontaine, G., Brassard, P., & Dorman, B. 2002, ApJS, 139, 487 [Google Scholar]
- Charpinet, S., Fontaine, G., Brassard, P., et al. 2005a, A&A, 443, 251 [NASA ADS] [CrossRef] [EDP Sciences] [Google Scholar]
- Charpinet, S., Fontaine, G., Brassard, P., Green, E. M., & Chayer, P. 2005b, A&A, 437, 575 [NASA ADS] [CrossRef] [EDP Sciences] [Google Scholar]
- Charpinet, S., Van Grootel, V., Reese, D., et al. 2008, A&A, 489, 377 [NASA ADS] [CrossRef] [EDP Sciences] [Google Scholar]
- Charpinet, S., Fontaine, G., & Brassard, P. 2009, A&A, 493, 595 [NASA ADS] [CrossRef] [EDP Sciences] [Google Scholar]
- Charpinet, S., Green, E. M., Baglin, A., et al. 2010, A&A, 516, L6 [NASA ADS] [CrossRef] [EDP Sciences] [Google Scholar]
- Dorman, B., Rood, R. T., & O’Connell, R. W. 1993, ApJ, 419, 596 [NASA ADS] [CrossRef] [Google Scholar]
- Downes, R. A. 1986, ApJS, 61, 569 [NASA ADS] [CrossRef] [Google Scholar]
- Dreizler, S., Schuh, S. L., Deetjen, J. L., Edelmann, H., & Heber, U. 2002, A&A, 386, 249 [NASA ADS] [CrossRef] [EDP Sciences] [Google Scholar]
- Fontaine, G., Brassard, P., Charpinet, S., et al. 2012, A&A, 539, A12 [NASA ADS] [CrossRef] [EDP Sciences] [Google Scholar]
- Fontaine, G., Bergeron, P., Brassard, P., et al. 2019, ApJ, 880, 79 [NASA ADS] [CrossRef] [Google Scholar]
- Geier, S., Østensen, R. H., Nemeth, P., et al. 2017, A&A, 600, A50 [NASA ADS] [CrossRef] [EDP Sciences] [Google Scholar]
- Graham, J. A. 1970, PASP, 82, 1305 [CrossRef] [Google Scholar]
- Green, R. F., Schmidt, M., & Liebert, J. 1986, ApJS, 61, 305 [NASA ADS] [CrossRef] [Google Scholar]
- Heber, U., Reid, I. N., & Werner, K. 2000, A&A, 363, 198 [NASA ADS] [Google Scholar]
- Holdsworth, D. L., Østensen, R. H., Smalley, B., & Telting, J. H. 2017, MNRAS, 466, 5020 [Google Scholar]
- Hu, H., Tout, C. A., Glebbeek, E., & Dupret, M. A. 2011, MNRAS, 418, 195 [NASA ADS] [CrossRef] [Google Scholar]
- Jayaraman, R., Handler, G., Rappaport, S. A., et al. 2022, ApJ, 928, L14 [NASA ADS] [CrossRef] [Google Scholar]
- Jeffery, C. S., & Pollacco, D. 2000, MNRAS, 318, 974 [NASA ADS] [CrossRef] [Google Scholar]
- Jeffery, C. S., & Saio, H. 2006a, MNRAS, 371, 659 [NASA ADS] [CrossRef] [Google Scholar]
- Jeffery, C. S., & Saio, H. 2006b, MNRAS, 372, L48 [NASA ADS] [CrossRef] [Google Scholar]
- Jeffery, C. S., & Saio, H. 2007, MNRAS, 378, 379 [NASA ADS] [CrossRef] [Google Scholar]
- Kawaler, S. D., Reed, M. D., Quint, A. C., et al. 2010, MNRAS, 409, 1487 [Google Scholar]
- Kilkenny, D. 1984, MNRAS, 211, 969 [NASA ADS] [CrossRef] [Google Scholar]
- Kilkenny, D. 2010, Ap&SS, 329, 175 [NASA ADS] [CrossRef] [Google Scholar]
- Kilkenny, D., Heber, U., & Drilling, J. S. 1988, South Afr. Astron. Obs. Circ., 12, 1 [NASA ADS] [Google Scholar]
- Kilkenny, D., O’Donoghue, D., Koen, C., Lynas-Gray, A. E., & van Wyk, F. 1998, MNRAS, 296, 329 [NASA ADS] [CrossRef] [Google Scholar]
- Kilkenny, D., Reed, M. D., O’Donoghue, D., et al. 2003, MNRAS, 345, 834 [NASA ADS] [CrossRef] [Google Scholar]
- Koen, C. 1998, MNRAS, 300, 567 [NASA ADS] [CrossRef] [Google Scholar]
- Koen, C., O’Donoghue, D., Pollacco, D. L., & Nitta, A. 1998, MNRAS, 300, 1105 [NASA ADS] [CrossRef] [Google Scholar]
- Koen, C., O’Donoghue, D., Pollacco, D. L., & Charpinet, S. 1999, MNRAS, 305, 28 [CrossRef] [Google Scholar]
- Koen, C., O’Donoghue, D., Kilkenny, D., & Pollacco, D. L. 2004, New A, 9, 565 [NASA ADS] [CrossRef] [Google Scholar]
- Kuassivi, Bonanno, A., & Ferlet, R. 2005, A&A, 442, 1015 [NASA ADS] [CrossRef] [EDP Sciences] [Google Scholar]
- Lei, Z., Zhao, J., Németh, P., & Zhao, G. 2019a, ApJ, 881, 135 [NASA ADS] [CrossRef] [Google Scholar]
- Lei, Z., Bu, Y., Zhao, J., Németh, P., & Zhao, G. 2019b, PASJ, 71, 41 [NASA ADS] [CrossRef] [Google Scholar]
- Lei, Z., Zhao, J., Németh, P., & Zhao, G. 2020, ApJ, 889, 117 [NASA ADS] [CrossRef] [Google Scholar]
- Lei, Z., He, R., Németh, P., et al. 2023, ApJ, 942, 109 [CrossRef] [Google Scholar]
- Lisker, T., Heber, U., Napiwotzki, R., et al. 2005, A&A, 430, 223 [NASA ADS] [CrossRef] [EDP Sciences] [Google Scholar]
- Luo, Y.-P., Németh, P., Liu, C., Deng, L.-C., & Han, Z.-W. 2016, ApJ, 818, 202 [NASA ADS] [CrossRef] [Google Scholar]
- Maxted, P. F. L., Marsh, T. R., & North, R. C. 2000, MNRAS, 317, L41 [NASA ADS] [CrossRef] [Google Scholar]
- Nassau, J. J., & Stephenson, C. B. 1963, Hamburger Sternw. Warner& Swasey Obs., C04 [Google Scholar]
- Németh, P., Kawka, A., & Vennes, S. 2012, MNRAS, 427, 2180 [Google Scholar]
- Oreiro, R., Ulla, A., Pérez Hernández, F., et al. 2004, A&A, 418, 243 [NASA ADS] [CrossRef] [EDP Sciences] [Google Scholar]
- Oreiro, R., Pérez Hernández, F., Østensen, R., et al. 2007, A&A, 461, 585 [NASA ADS] [CrossRef] [EDP Sciences] [Google Scholar]
- Østensen, R., Heber, U., Silvotti, R., et al. 2001a, A&A, 378, 466 [NASA ADS] [CrossRef] [EDP Sciences] [Google Scholar]
- Østensen, R., Solheim, J. E., Heber, U., et al. 2001b, A&A, 368, 175 [NASA ADS] [CrossRef] [EDP Sciences] [Google Scholar]
- Østensen, R., Telting, J., & Heber, U. 2007, Commun. Asteroseismol., 150, 265 [CrossRef] [Google Scholar]
- Østensen, R. H., Oreiro, R., Solheim, J. E., et al. 2010a, A&A, 513, A6 [NASA ADS] [CrossRef] [EDP Sciences] [Google Scholar]
- Østensen, R. H., Silvotti, R., Charpinet, S., et al. 2010b, MNRAS, 409, 1470 [CrossRef] [Google Scholar]
- Østensen, R. H., Pápics, P. I., Oreiro, R., et al. 2011, ApJ, 731, L13 [CrossRef] [Google Scholar]
- Østensen, R. H., Geier, S., Schaffenroth, V., et al. 2013, A&A, 559, A35 [NASA ADS] [CrossRef] [EDP Sciences] [Google Scholar]
- O’Toole, S. J., Heber, U., & Benjamin, R. A. 2004, A&A, 422, 1053 [CrossRef] [EDP Sciences] [Google Scholar]
- Pelisoli, I., Neunteufel, P., Geier, S., et al. 2021, Nat. Astron., 5, 1052 [NASA ADS] [CrossRef] [Google Scholar]
- Pérez-Fernández, E., Ulla, A., Solano, E., Oreiro, R., & Rodrigo, C. 2016, MNRAS, 457, 3396 [CrossRef] [Google Scholar]
- Prins, S., Telting, J., & Østensen, R. 2019, Open Astron., 28, 61 [NASA ADS] [CrossRef] [Google Scholar]
- Randall, S. K., Fontaine, G., Charpinet, S., et al. 2006, ApJ, 648, 637 [NASA ADS] [CrossRef] [Google Scholar]
- Randall, S. K., Green, E. M., Van Grootel, V., et al. 2007, A&A, 476, 1317 [NASA ADS] [CrossRef] [EDP Sciences] [Google Scholar]
- Randall, S. K., Van Grootel, V., Fontaine, G., Charpinet, S., & Brassard, P. 2009, A&A, 507, 911 [NASA ADS] [CrossRef] [EDP Sciences] [Google Scholar]
- Reed, M. D., Whole Earth Telescope Xcov 17 Team,& Whole Earth Telescope Xcov 21 Team 2002, in IAU Colloq. 185: Radial and Nonradial Pulsationsn as Probes of Stellar Physics, eds. C. Aerts, T. R. Bedding, & J. Christensen-Dalsgaard, ASP Conf. Ser., 259, 368 [NASA ADS] [Google Scholar]
- Reed, M. D., Kawaler, S. D., Zola, S., et al. 2004, MNRAS, 348, 1164 [NASA ADS] [CrossRef] [Google Scholar]
- Reed, M. D., Eggen, J. R., Zhou, A. Y., et al. 2006, MNRAS, 369, 1529 [NASA ADS] [CrossRef] [Google Scholar]
- Reed, M. D., Terndrup, D. M., Zhou, A. Y., et al. 2007a, MNRAS, 378, 1049 [CrossRef] [Google Scholar]
- Reed, M. D., O’Toole, S. J., Terndrup, D. M., et al. 2007b, ApJ, 664, 518 [NASA ADS] [CrossRef] [Google Scholar]
- Reed, M. D., Eggen, J. R., Harms, S. L., et al. 2009, A&A, 493, 175 [NASA ADS] [CrossRef] [EDP Sciences] [Google Scholar]
- Reed, M. D., Harms, S. L., Poindexter, S., et al. 2011, MNRAS, 412, 371 [NASA ADS] [CrossRef] [Google Scholar]
- Reed, M. D., O’Toole, S. J., Telting, J. H., et al. 2012, in Fifth Meeting on Hot Subdwarf Stars and Related Objects, eds. D. Kilkenny, C. S. Jeffery, & C. Koen, ASP Conf. Ser., 452, 193 [NASA ADS] [Google Scholar]
- Reed, M. D., Telting, J. H., Ketzer, L., et al. 2019, MNRAS, 483, 2282 [NASA ADS] [Google Scholar]
- Reed, M. D., Yeager, M., Vos, J., et al. 2020, MNRAS, 492, 5202 [Google Scholar]
- Reed, M. D., Slayton, A., Baran, A. S., et al. 2021, MNRAS, 507, 4178 [NASA ADS] [CrossRef] [Google Scholar]
- Reed, M. D., Baran, A. S., Telting, J. H., & Østensen, R. H. 2023, MNRAS, 525, 1342 [NASA ADS] [CrossRef] [Google Scholar]
- Schaffenroth, V., Pelisoli, I., Barlow, B. N., Geier, S., & Kupfer, T. 2022, A&A, 666, A182 [NASA ADS] [CrossRef] [EDP Sciences] [Google Scholar]
- Schuh, S., Huber, J., Dreizler, S., et al. 2006, A&A, 445, L31 [NASA ADS] [CrossRef] [EDP Sciences] [Google Scholar]
- Silvotti, R., Solheim, J. E., Gonzalez Perez, J. M., et al. 2000, A&A, 359, 1068 [NASA ADS] [Google Scholar]
- Silvotti, R., Østensen, R., Heber, U., et al. 2002a, A&A, 383, 239 [NASA ADS] [CrossRef] [EDP Sciences] [Google Scholar]
- Silvotti, R., Janulis, R., Schuh, S. L., et al. 2002b, A&A, 389, 180 [NASA ADS] [CrossRef] [EDP Sciences] [Google Scholar]
- Silvotti, R., Schuh, S., Janulis, R., et al. 2007, Nature, 449, 189 [NASA ADS] [CrossRef] [Google Scholar]
- Silvotti, R., Schuh, S., Kim, S. L., et al. 2018, A&A, 611, A85 [NASA ADS] [CrossRef] [EDP Sciences] [Google Scholar]
- Telting, J. H., & Østensen, R. H. 2006, A&A, 450, 1149 [NASA ADS] [CrossRef] [EDP Sciences] [Google Scholar]
- Théado, S., Vauclair, S., Alecian, G., & LeBlanc, F. 2009, ApJ, 704, 1262 [Google Scholar]
- Van Grootel, V., Charpinet, S., Fontaine, G., et al. 2008a, A&A, 488, 685 [NASA ADS] [CrossRef] [EDP Sciences] [Google Scholar]
- Van Grootel, V., Charpinet, S., Fontaine, G., & Brassard, P. 2008b, A&A, 483, 875 [NASA ADS] [CrossRef] [EDP Sciences] [Google Scholar]
- Van Grootel, V., Charpinet, S., Brassard, P., Fontaine, G., & Green, E. M. 2013, A&A, 553, A97 [NASA ADS] [CrossRef] [EDP Sciences] [Google Scholar]
- Vennes, S., Kawka, A., & Németh, P. 2011, MNRAS, 410, 2095 [NASA ADS] [Google Scholar]
- Vučković, M., Aerts, C., Östensen, R., et al. 2007, A&A, 471, 605 [NASA ADS] [CrossRef] [EDP Sciences] [Google Scholar]
- Vučković, M., Østensen, R. H., Acke, B., et al. 2012, in Fifth Meeting on Hot Subdwarf Stars and Related Objects, eds. D. Kilkenny, C. S. Jeffery, & C. Koen, ASP Conf. Ser., 452, 257 [Google Scholar]
- Vučković, M., Bloemen, S., & Östensen, R. 2014, in 6th Meeting on Hot Subdwarf Stars and Related Objects, eds. V. van Grootel, E. Green, G. Fontaine, & S. Charpinet, ASP Conf. Ser., 481, 259 [Google Scholar]
- Wegner, G., & Dupuis, J. 1993, AJ, 106, 390 [NASA ADS] [CrossRef] [Google Scholar]
- Zhou, A. Y., Reed, M. D., Harms, S., et al. 2006, MNRAS, 367, 179 [NASA ADS] [CrossRef] [Google Scholar]
- Zong, W., Charpinet, S., & Vauclair, G. 2016, A&A, 594, A46 [NASA ADS] [CrossRef] [EDP Sciences] [Google Scholar]
Appendix A: Additional figures
Appendix B: Additional table
Frequencies we detected in the targets observed in the USC.
All Tables
Spectroscopic estimates of pulsating hot subdwarfs reported here and in Paper I, for which we derived an acceptable spectroscopic fits.
All Figures
|
Fig. 1. Amplitude spectra of the targets observed in the SC mode. If sector is not specified, we include all avalable data. Left panels: Frequency range, up to twice the Nyquist frequency. The arrows point at the Nyquist frequency of 4166.67 μHz. Right panels: Close-ups of the detected frequencies. |
| In the text | |
|
Fig. 2. Amplitude spectra of targets observed in the USC mode. If sector is not specified, we included all USC data. Left panels: Frequency range up to the Nyquist frequency. Right panels: Close-ups of the detected frequencies. |
| In the text | |
|
Fig. 3. Tests of detection completeness. Bottom panel: Black circles indicate single-sector detection limits of p-mode sdBV stars observed by TESS. Green circles and red triangles are not detection limits, but Amax for stars listed in Østensen et al. (2010a) that were observed by TESS. The green circles indicate stars in which pulsations were detected (amplitudes from TESS data), while red triangles indicate stars in which pulsations were not detected by TESS, Østensen et al. (amplitudes as listed in 2010a). Green arrows indicate the stars TIC 90960668 and TIC 88565376, which have amplitudes too high to appear in this figure. Top panel: Amax of p-mode sdBV stars (black triangles) detected by TESS from low to high amplitude. The red lines indicate detection limits for those magnitude ranges and what fraction of detected sdBV stars would be undetected based on Amax. |
| In the text | |
|
Fig. 4. Distribution in the surface gravity (log g) – effective temperature (Teff) plane of the hot subdwarf stars observed by TESS throughout cycle 1–4 and displaying p-mode pulsations. Pure p-mode pulsators (V361 Hya stars) are represented as blue dots. Hybrid pulsators also featuring g-modes (DW Lyn stars) are shown as green dots. Superimposed to this sample, the ZAEHB and TAEHB positions are indicated for an assumed core mass of 0.47 M⊙ (black curves) and 0.55 M⊙ (grey curves), illustrating how the EHB location depends on stellar mass. The models that materialize the EHB tracks are computed with the STELUM code for the specified core mass and varying envelope masses such as D(H) ≡ log[Menv/Mcore + Menv)] = –6.0, –5.0, –4.5, –4.0, –3.5, –3.0, –2.75, –2.5, –2.25, and –2.0, from high to low Teff. These models incorporate in their envelope nonuniform iron abundance profiles derived from equilibrium between radiative levitation and gravitational settling (see text for details). For comparison purposes, typical 0.47 M⊙ tracks assuming solar uniform envelope composition are also represented (yellow curves; Charpinet et al. 2000; Dorman et al. 1993). Dotted-line contours in the background represent the predicted number of excited ℓ = 0 p-modes from non-adiabatic pulsation calculations as a proxy of the κ-mechanism efficiency (Charpinet et al. 2001). The three innermost contours (highlighted in red) delineate the region of the log g–Teff plane where the driving of p-modes is the strongest. |
| In the text | |
|
Fig. 5. Pulsation periods with the highest amplitudes in function of Teff. Black dots represent USC stars, open red boxes represent SC stars, a horizontal dotted line is the Nyquist period, and the solid sloped line is a fit to the USC stars. |
| In the text | |
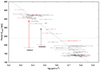 |
Fig. 6. Same as in Fig. 5 but in a function of log g. |
| In the text | |
 |
Fig. A.1. Same as in Fig. 1, but for another six targets observed only in the SC mode. |
| In the text | |
 |
Fig. A.2. Same as in Fig. 2, but for another seven targets observed in the USC mode. |
| In the text | |
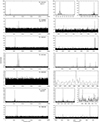 |
Fig. A.3. Same as in Fig. 2 but for another seven targets observed in the USC mode. |
| In the text | |
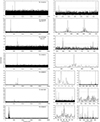 |
Fig. A.4. Same as in Fig. 2, but for another seven targets observed in the USC mode. |
| In the text | |
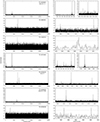 |
Fig. A.5. Same as in Fig. 2, but for another seven targets observed in the USC mode. |
| In the text | |
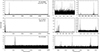 |
Fig. A.6. Same as in Fig. 2, but for another three targets observed in the USC mode. |
| In the text | |
Current usage metrics show cumulative count of Article Views (full-text article views including HTML views, PDF and ePub downloads, according to the available data) and Abstracts Views on Vision4Press platform.
Data correspond to usage on the plateform after 2015. The current usage metrics is available 48-96 hours after online publication and is updated daily on week days.
Initial download of the metrics may take a while.