| Issue |
A&A
Volume 669, January 2023
|
|
|---|---|---|
| Article Number | A48 | |
| Number of page(s) | 18 | |
| Section | Stellar structure and evolution | |
| DOI | https://doi.org/10.1051/0004-6361/202244888 | |
| Published online | 05 January 2023 | |
Short-period pulsating hot-subdwarf stars observed by TESS
I. Southern ecliptic hemisphere⋆
1
Astronomical Observatory, University of Warsaw, Al. Ujazdowskie 4, 00-478 Warszawa, Poland
e-mail: This email address is being protected from spambots. You need JavaScript enabled to view it.
2
Department of Physics, Astronomy, and Materials Science, Missouri State University, Springfield, MO 65897, USA
3
Space sciences, Technologies and Astrophysics Research (STAR) Institute, Université de Liège, 19C Allée du 6 Août, 4000 Liège, Belgium
4
Recogito AS, Storgaten 72, 8200 Fauske, Norway
5
South African Astronomical Observatory, Observatory 7935, South Africa
6
Nicolaus Copernicus Astronomical Centre of the Polish Academy of Sciences, ul. Bartycka 18, 00-716 Warsaw, Poland
7
IRAP, CNRS, UPS, CNES, Université de Toulouse, 14 av. Edouard Belin, 31400 Toulouse, France
8
Astronomical Institute of the Czech Academy of Sciences, Fričova 298, 251 65 Ondřejov, Czech Republic
9
Astroserver.org, Fő tér 1, 8533 Malomsok, Hungary
10
Nordic Optical Telescope, Rambla José Ana Fernández Pérez 7, 38711 Breña Baja, Spain
11
Department of Physics and Astronomy, Aarhus University, NyMunkegade 120, 8000 Aarhus C, Denmark
12
Department of Physics and Astronomy, University of the Western Cape, Private Bag X17, Bellville 7535, South Africa
Received:
5
September
2022
Accepted:
19
October
2022
Abstract
We present results of a Transiting Exoplanet Survey Satellite (TESS) search for short-period pulsations in compact stellar objects observed in years 1 and 3 of the TESS mission, during which the southern ecliptic hemisphere was targeted. We describe the TESS data used and the details of the search method. For many of the targets, we use unpublished spectroscopic observations to classify the objects. From the TESS photometry, we clearly identify 43 short-period hot-subdwarf pulsators, including 32 sdB stars, eight sdOB stars, two sdO stars, and, significantly, one He-sdOB star, which is the first of this kind to show short-period pulsations. Eight stars show signals at both low and high frequencies, and are therefore “hybrid” pulsators. We report the list of prewhitened frequencies and we show the amplitude spectra calculated from the TESS data. We make an attempt to identify possible multiplets caused by stellar rotation, and we select four candidates with rotation periods between 1 and 12.9 days. The most interesting targets discovered in this survey should be observed throughout the remainder of the TESS mission and from the ground. Asteroseismic investigations of these data sets will be invaluable in revealing the interior structure of these stars and will boost our understanding of their evolutionary history. We find three additional new variable stars but their spectral and variability types remain to be constrained.
Key words: stars: oscillations / stars: variables: general / stars: horizontal-branch / subdwarfs
Table 4 is only available at the CDS via anonymous ftp to cdsarc.cds.unistra.fr (130.79.128.5) or via https://cdsarc.cds.unistra.fr/viz-bin/cat/J/A+A/669/A48
© The Authors 2023
 Open Access article, published by EDP Sciences, under the terms of the Creative Commons Attribution License (https://creativecommons.org/licenses/by/4.0), which permits unrestricted use, distribution, and reproduction in any medium, provided the original work is properly cited.
This article is published in open access under the Subscribe-to-Open model. This email address is being protected from spambots. You need JavaScript enabled to view it. to support open access publication.
1. Introduction
Hot subdwarf stars are evolved objects with O to B spectral types, and with a wide range of H to He fractions in their atmospheres. The subdwarf B (sdB) stars have effective temperatures, Teff, between 20 000 and 40 000 K, surface gravities between 5 and 6 in log(g/cm s−2), and surface helium abundances usually strongly depleted compared to the solar value. The surface distribution of elements heavier than helium differs significantly from star to star (Geier 2013). Most sdB stars are core-He burning stars that are located on the blue extension of the horizontal branch (EHB), and therefore have a mass of about half of the solar value, as required for the core-helium flash (Fontaine et al. 2012). The progenitors of sdB stars are intermediate-mass stars (∼0.7–2.2 M⊙) that must have lost significant mass during the red-giant branch, leaving them with only a tiny remnant of their hydrogen envelopes. The mass loss must happen before helium ignition through the core-helium flash, otherwise they would become He-core low-mass white dwarfs (without He-core burning), or normal horizontal-branch stars (He-core burning, but with a much lower effective temperature, thicker H-rich envelopes, and higher masses). Binary population synthesis modeling has been performed to explore various mass-loss scenarios, as detailed by Han et al. (2002).
The subdwarf O (sdO) stars are hotter, showing Teff between ∼40 000 and ∼80 000 K, and they exhibit a wider range of log(g/cm s−2), from 4.0 to 6.5. The majority have helium-enriched atmospheres. This diversity in properties betrays the very diverse origins of sdO stars. He-poor, compact sdO stars are direct progenies of sdB stars in their immediate post-EHB phase. However, the majority of compact sdO stars are He rich and are identified as direct post-RGB objects, that is to say they were created through the so-called late hot He-flash (Miller Bertolami et al. 2008), or they are end products of merger events (Webbink 1984; Iben & Tutukov 1984; Iben 1990; Saio & Jeffery 2000, 2002). There are also less compact (log(g/cm s−2) ≲ 5.0) sdO stars, which are post-AGB stars, that is to say stars that have ascended the asymptotic giant branch after core-He burning exhaustion (Reindl et al. 2016).
Stellar oscillations in sdB stars were predicted by Charpinet et al. (1996, 1997), and and discovered and independently discovered Kilkenny et al. (1997a), and are potentially useful for precise sdB mass estimations using asteroseismology, among other applications. Pulsating sdB stars reported by Kilkenny et al. (1997a), and in subsequent papers of their series, are pressure- (p-) mode pulsators. Later, gravity- (g-) mode sdB stars and sdB stars exhibiting both p and g modes (hybrid) were reported by Green et al. (2003), Baran et al. (2005), and Schuh et al. (2006). Fontaine et al. (2012) compared p- and g-mode sdB stars, clearly indicating that the typical periods of p-mode sdB stars are shorter, while amplitudes of the flux variation are higher than those of g-mode stars. Although the first pulsating subdwarf stars discovered were p-mode dominated, most of them stars turned out to be g-mode dominated. Østensen et al. (2010) found that only 10% of temperature-selected V361-Hya candidates in the Nordic Optical Telescope (NOT) survey are pulsators, while Green et al. (2003) found that 75% of the cooler sdB stars, having Teff < 30 000 K (or 25%–30% of all sdB stars), pulsate in g modes. The majority of sdB stars detected using the Convection, Rotation and planetary Transits (CoRoT), the Kepler and the Transiting Exoplanet Survey Satellite (TESS) space telescopes are either g-mode pulsators or hybrid pulsators with a dominant g-mode component.
The first pulsating sdO star, V499 Ser (=J1600+0748), was identified by Woudt et al. (2006). It shows very rapid oscillations from roughly 60 s to 120 s. For years V499 Ser remained the only member of its class, despite extensive searches among field sdO stars (Rodríguez-López et al. 2007; Johnson et al. 2014). Four sdO pulsators were identified by Randall et al. (2011) in the globular cluster ω Cen and, over several years, a few more field sdO pulsators were identified, including EO Cet, formerly identified as a common-or-garden sdB pulsator (Østensen 2012). The periods of all known sdO pulsators are of a few minutes and are consistent with p-mode pulsations (Fontaine et al. 2008).
Another type of pulsating subdwarf star is the V366-Aqr, which are intermediate He-rich hot subdwarfs (iHe-sdOBs)1 that pulsate with periods on the order of an hour. V366 Aqr (=LS IV−14°116) was discovered by Ahmad & Jeffery (2005), and further examples of this class were only discovered recently; Feige 46 by Latour et al. (2019) and PHL 417 by Østensen et al. (2020). These pulsators belong to the group of heavy-metal subdwarfs that show unusual enrichment of elements such as zirconium and lead in their atmospheres.
The rarest hot-subdwarf pulsator is currently EC 03089-6421 (Kilkenny et al. 2019), an sdO star with extremely rapid half-minute pulsations. This star might be a higher-gravity object in a post-He-burning stage, but a more detailed spectroscopic study is required to resolve this.
The goal of this paper is to report our results of the p-mode-dominated hot-subdwarf stars surveyed by the TESS satellite. Since only the southern ecliptic hemisphere is completed using the ultra-short cadence required for rapid pulsations, our report is limited to that hemisphere. The northern ecliptic hemisphere survey, along with a statistical analysis on the presence of p-mode pulsators among hot subdwarfs, will be reported in a follow-up paper.
2. TESS photometry
TESS is deployed in an elliptical, 2:1 lunar synchronous orbit with a period of 13.7 days. Each annual cycle of TESS observations is split into sectors lasting two orbits, or about 27 days. The detector consists of four contiguous CCD cameras, each covering a 24° × 24° field of view (FoV), making up a 24° × 96° strip aligned along ecliptic latitude lines. During years 1 and 2, the data were stored with the short cadence (SC), lasting 120 s, and the long cadence (LC), lasting 1800 s. Since year 3 there has been an additional ultra-short cadence (USC) available, lasting 20 s, while the LC was trimmed to 600 s. The number of targets observed in the USC and SC is limited, and varies from sector to sector. When observations of one sector have been completed, the instrument’s FoV is shifted eastward by 27°, naturally pivoting around the ecliptic pole. During years 1–3, it took 13 sectors to pivot around one pole, then the FoV was shifted to the other hemisphere for the next cycle. As a result, the regions near the ecliptic poles are observed during every sector and are known as the continuous viewing zones of TESS. We downloaded all available data of our targets from the Barbara A. Mikulski Archive for Space Telescopes (MAST)2.
To probe the p-mode region in an amplitude spectrum, we are limited to either the SC or USC data. The Nyquist frequency of the former is 4166 μHz, while for the latter it is 25 000 μHz. Our preference is to use the USC data, if available, with which the entire p-mode region is sampled. In the case of the SC data, the Nyquist frequency is in the middle of the p-mode region and aliasing becomes a serious issue. This issue can be resolved by the finite speed of light, which clearly separates the sub- and super-Nyquist regions in the amplitude spectrum, first discovered by Baran et al. (2012). The amplitudes and profiles of the peaks become different in these two regions, but the effect does not come into play for stars located in the TESS continuous viewing zones, namely those close to the ecliptic poles.
We used PDCSAP_FLUX, which is corrected for on-board systematics and neighbors’ contributions to the overall flux. We clipped fluxes at 4.5σ to remove outliers, de-trended long-term variations (on the order of days) with spline fitting, and calculated the amplitude of the flux variations using the relation A[ppt] = 1000*(flux/< flux> −1).
3. Fourier analysis
About 4000 hot subdwarfs (and hot-subdwarf candidates) have been observed by TESS in either the SC or USC mode. The list was assembled by members of Working Group 8 (WG8) of the TESS Asteroseismic Science Consortium (TASC)3.
Following a recent report by Baran & Koen (2021), we applied a detection threshold at 4.5 times the median noise level to both the SC and USC data sets, regardless of the data coverage. In the case of data from just one sector, such a threshold corresponds to a false alarm probability (FAP) of 5% for the SC data and 14% for the USC data. For FAP = 0.1%, the threshold would be around 5.5, and hence frequencies below this threshold should be considered tentative. Precise confidence levels for other numbers of sectors can be derived from Eq. (5) in Baran & Koen (2021).
To search for a significant signal in amplitude spectra, we applied the FELIX tool (Charpinet et al. 2010; Zong et al. 2016). Firstly, an automatic search was done, looking for variations beyond 1500 μHz in one sector, without combining multiple sectors (if a star was observed during more than one sector). Secondly, an individual check was carried out on the ∼100 candidates to see if detected variations were consistent with p-mode pulsations. We detected signals in the p-mode region in 43 targets. Twelve targets were recorded only in the SC mode, while 31 were recorded in the USC mode. We found ten new detections in SC data and 11 new detections in USC data, while the remaining two (SC) and 20 (USC) hot-subdwarf pulsators were known prior to the TESS mission. We present the full list of p-mode hot subdwarfs in Table 1. The table also lists the spectral type (SpT) either from the literature or from recent spectroscopy. As is conventional for the classification of hot subdwarfs from low-resolution spectroscopy, we designated those stars with detectable He I, or no He I lines at all, with a B class. We designated those with detectable He II at 4686 Å with class OB, and those with strong He II and no He I with class O (for more details, see e.g., Moehler et al. 1990). One star is He rich, and shows both He I and He II at roughly equal strength, but not stronger than the Balmer lines, indicating a super-solar helium abundance, which would imply a designation of He-sdOB or iHe-sdOB, as the atmosphere is still Hydrogen dominated. Below we describe each target, providing prior knowledge on the pulsation properties, followed by amplitude spectra and the lists of frequencies we detected.
The list of pulsating hot subdwarfs found in the TESS data.
3.1. Targets observed in the SC mode
TIC 10011123 (TYC 4824-1038-1 = Gaia DR2 3058814547877917056) is a new pulsating sdOB star. The spectral classification is confirmed with a spectrum taken with the 1.9 m telescope at the South African Astronomical Observatory (SAAO). Details of all classifications obtained by means of SAAO spectra can be found in the paper by Worters et. al., which is currently in preparation. TESS observed the star during Sector 33. An amplitude spectrum shown in Fig. 1 delivers three peaks in the g-mode region and one peak in the high-frequency region. Since the target was observed during just one sector, we are unable to separate a real frequency from its alias across the Nyquist frequency. We show the list of the prewhitened frequencies in Table 2. Since the majority of p modes detected in pulsating sdB stars are above 4000 μHz, we arbitrarily prewhitened frequencies in the super-Nyquist region. Based on previous detections of p-mode sdB pulsators, we can see a correlation between the effective temperature and the frequencies of p modes: the lower the temperature, the lower the frequencies at which signals can appear. To verify our frequency choice for targets observed in the SC only, we need either the USC data or at least one sector of additional SC data. The latter argument is clearly seen for TIC 366656123.
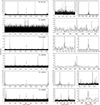 |
Fig. 1. Amplitude spectra of the targets observed in the SC mode. Left panels: frequency range, up to twice the Nyquist frequency. The arrows point at the Nyquist frequency of 4166.67 μHz. Right panels: close-ups at the detected frequencies. |
List of frequencies detected in the targets observed only with the SC.
While analysing the contamination of TIC 1001123, we found TIC 754255960 to be a variable star. It shows four frequencies in the amplitude spectrum. However, the three higher frequencies all appear to be harmonics of the lower frequency, which indicates non-sinusoidal flux variation. This can be explained, for example, by binarity or pulsations in classical pulsators. Concerning the latter type and given the period of 0.19942(6) days, it could be a high-amplitude Delta Scuti, RR Lyrae, or anomalous Cepheid star. We retrieved the light curve from the SC data and calculated the amplitude spectrum. Both plots are shown in Fig. 2.
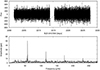 |
Fig. 2. TESS data of TIC 754255960. Top panel: light curve derived from the Full Frame Images taken in Sector 33. Bottom panel: amplitude spectrum calculated from the light curve sampled at 30 min. The horizontal line denotes the detection threshold at 4.5 times the median noise level in a residual amplitude spectrum (with two significant peaks removed). |
TIC 19690565 (Gaia DR2 5753155495252812544) is a new sdB pulsator. Our fit to a spectrum taken with the 2.56-meter NOT4 in 2015 gives Teff = 31 150(300) K, log(g/cm s−2) = 5.76(5), and log(n(He)/log (H)) < -3, indicating an sdB classification. TESS observed the star during Sector 34. We detected two peaks close to the Nyquist frequency and we selected the one in the super Nyquist region. We show the amplitude spectrum in Fig. 1, and list the prewhitened frequencies in Table 2.
TIC 95752908 (Gaia DR2 5756471068269831552 = TYC 4890-19-1) is a known sdB pulsator. Holdsworth et al. (2017) analyzed the star spectroscopically and classified it as an sdB. The same authors reported up to three frequencies detected in any given amplitude spectrum. However, one frequency, ν3, was not detected in all data. TESS observed the star during Sector 8. We detected two frequencies reported by Holdsworth et al. (2017). Our frequency f1 is close to ν3, while we detected no trace of ν2 reported by the authors. We show an amplitude spectrum in Fig. 1 and list the prewhitened frequencies in Table 2.
TIC 139481265 (Gaia DR2 3342874205845523072) is a new sdB pulsator. Our fit to a spectrum taken with the NOT in 2018 gives Teff = 31 810(540) K, log(g/cm s−2) = 5.80(4), and log(n(He)/log n(H)) = −2.24(8), indicating an sdB classification. TESS observed the star during Sector 33. We found three peaks and we chose those located in the super Nyquist region. The frequencies are listed in Table 2. They are close to each other, and the separations between the adjacent ones are 1.55(3) and 1.60(5) μHz, respectively, between the two lowest and the two highest frequencies. The frequency spacing is equal within the errors, which indicates that these three peaks can constitute a rotationally split triplet. If so, the rotation period would be 7.35(27) d. We show an amplitude spectrum in Fig. 1.
TIC 142200764 (HE 0230–4323 = Gaia DR2 4947023428379802752) was found by Edelmann et al. (2005) to be a binary system with an sdB as the primary component. The authors reported a binary period of 0.4515(2) days, a systemic velocity of 42.3(3) km s−1, and a radial-velocity (RV) amplitude of 109.6(4) km s−1. They concluded that the companion to the sdB star is either an M dwarf or a white dwarf, depending on the orbital inclination and the mass of the sdB. Koen (2007) confirmed the binarity photometrically and detected pulsations in the sdB star, calling it an unusual pulsating star because the pulsation frequencies changed over the course of several nights from ∼32–39 d−1 to ∼8–16 d−1. Kilkenny et al. (2010) revisited the system, explaining the unusual g-mode pulsations as an under-sampling error; with better sampling, they were able to detect short-period pulsations. TESS observed the star during Sector 3. We recovered the orbital frequency and its first harmonic associated with binarity. The phase-folded light curve is shown in Fig. 3, and the ephemeris is provided in Table 3. The light curve is dominated by a reflection effect, which points to an M-dwarf as the companion type. The reflection effect can be distinguished from ellipsoidal and Doppler-beaming variations by its high amplitude and the shape of the flux variation. The amplitude of the latter two effects are typically around a few ppt, while reflection can easily reach several percent. Reflection is also easily distinguished from the other effects by the way the first harmonic combines with the orbital period to make the peaks higher, and the troughs shallower, while retaining symmetry around the peak. In addition to the orbital peaks, we found eight frequencies in the p-mode region. We show an amplitude spectrum with two close-ups in Fig. 1. Since the star was observed in the SC mode, we would not be able to discern between the real frequencies and their aliases across the Nyquist frequency if the frequencies were not reported by Kilkenny et al. (2010). In this case, it is the frequencies in the sub-Nyquist region that are real. Two frequencies, f4 and f8, should be considered tentative since their amplitudes are below our adopted detection threshold, and were also not detected by Kilkenny et al. (2010). Frequency f5 was also not detected by the authors. On the other hand, we did not detect frequencies above 5700 μHz, which were detected by the authors. The full list of frequencies we detected in the TESS data is shown in Table 2.
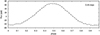 |
Fig. 3. Phase-folded light curve of TIC 142200764 showing a reflection effect. The number in the upper right corner is the orbital period, rounded to two significant digits, used for folding the light curve. |
Ephemerides for three stars showing a reflection effect.
TIC 143699381 (Gaia DR2 6715490300005795840) is a new sdB pulsator. This spectral classification is obtained with a spectrum taken with the 1.9 m telescope at SAAO. TESS observed the star during Sector 13. We detected five frequencies: three in the g-mode region and two in the p-mode region, which make the star a hybrid sdB pulsator. We show an amplitude spectrum in Fig. 1 and list the prewhitened frequencies in Table 2.
TIC 289149727 (Gaia DR2 5870233314477487872) is a new sdB pulsator. Based on a spectrum taken with the 1.9 m telescope at SAAO, we classified it as an sdB star. TESS observed the star during Sector 38. We detected four frequencies: one low frequency and three frequencies in the p-mode region. The low frequency is not typical of g-mode pulsations in hot-subdwarf stars and it is probably a signature of binarity rather than a g-mode pulsation. As this target is rather faint and residing in the crowded environment of the galactic plane, the light curve is too noisy to distinguish the harmonic of the suspected orbital peak. We show an amplitude spectrum in Fig. 4 and list the prewhitened frequencies in Table 2.
TIC 295046932 (Gaia DR2 5811947687666193280) is a new sdB pulsator. We classified the star as an sdB based on a spectrum taken with the 1.9 m telescope at SAAO. TESS observed the star during Sector 39. We detected 11 frequencies in the p-mode region. We show an amplitude spectrum in Fig. 4 and list the prewhitened frequencies in Table 2.
TIC 366656123 (Gaia DR2 595128265015393152 = SDSS J084122.66+063029.6) is a new sdB pulsator. Our fit to a spectrum taken with the 2.5 m Sloan Digital Sky Survey (SDSS) telescope in 2008 gives Teff = 31 300(200) K, log(g/cm s−2) = 5.56(3), and log(n(He)/ n(H)) = –2.8(1). It was included in a sample of hot-subdwarf candidates analyzed by Sahoo et al. (2020b), who detected a low frequency, and consequently the object was proposed and successfully observed by TESS during Sectors 34 and 44. The data are too far apart to combine and analyze as one piece since the Fourier window function is very complex. Instead, we analyzed these two data sets separately and compared the signals detected. In both sectors we detected one frequency in the g-mode region and one high frequency in the p-mode region. We show an amplitude spectrum calculated only from Sector 34 data in Fig. 4. To be consistent with analyses of other targets, we should pick the frequency in the super Nyquist region. However, the high frequency is shifted between sectors (shown in Fig. 5). The middle panel shows that the Nyquist frequency is shifted between sectors, which will consequently shift the reflections of frequencies. Indeed, the frequencies in the super-Nyquist region are not aligned, which we interpret as reflections, and therefore the signal at high frequency originates in the sub-Nyquist region. This also confirms that our arbitrary choice of selecting peaks in the super-Nyquist region may not always be correct. We list the prewhitened frequencies in Table 2.
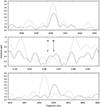 |
Fig. 5. Amplitude spectrum of TIC 366656123. Top panel: close-up of the amplitude spectrum showing a high frequency in the sub-Nyquist region. Solid and dashed lines represent Sectors 34 and 44, respectively. Middle panel: Nyquist-frequency region. The arrows point at the Nyquist frequency in Sectors 34 and 44. Bottom panel: close-up of the amplitude spectrum showing a high frequency in the super-Nyquist region. |
TIC 387107334 (Gaia DR2 6439287618985307776 = BPS CS 22959-140) is a new sdB pulsator. It was originally classified as an sdO subdwarf in the BPS catalog (Beers et al. 1992). However, a spectrum taken with the 1.9 m telescope at SAAO indicates an sdB classification. TESS observed the star during Sector 13. We detected only a single frequency in the p-mode region. We show an amplitude spectrum in Fig. 4 and list the prewhitened frequency in Table 2.
TIC 408147637 (Gaia DR2 5867781918951429760) is a new sdB pulsator. Based on a spectrum taken with the 1.9 m telescope at SAAO, we classified it as an sdB star. TESS observed the star during Sector 38. We detected five frequencies: one low frequency, one in the g-mode region, and three in the p-mode region. We show an amplitude spectrum in Fig. 4 and list the prewhitened frequencies in Table 2.
TIC 455095580 (Gaia DR2 3096564462848659328) is a new sdB pulsator. Our fit to a spectrum taken with the NOT in 2022 gives Teff = 30 800(500) K, log(g/cm s−2) = 5.7(1), and log(n(He)/log (H)) = −2.55(15), indicating an sdB classification. TESS observed the star in Sector 34. We detected only one frequency in the p-mode region. We show an amplitude spectrum in Fig. 4 and we list the prewhitened frequency in Table 2.
3.2. Targets observed in the USC mode
For all targets observed in the USC mode, there is also corresponding SC data available. In addition, some targets listed below were observed during specific sectors (1–13) in the SC mode only. Since the USC data provide us with a unique frequency identification, we decided not to include any SC data, even those taken in sectors without available USC data. Table 1 provides detailed sector information and we do not mention sectors with the SC data below.
TIC 6116091 (Gaia DR2 6196248648201755904, EC 13185–2111, HE 1318–2111) is a new sdOB pulsator. It is included in the Edinburgh – Cape (EC) survey, where it is classified as an sdB star (Kilkenny et al. 1997b). Later, Christlieb et al. (2001) rediscovered it in the Hamburg/ESO survey, and classified it as an sdOB star. Stroeer et al. (2007) analyzed an Ultraviolet and Visual Echelle Spectrograph (UVES) spectrum from the SPY survey, and found Teff = 36 254 K, log(g/cm s−2) = 5.42, and log(n(He)/log (H)) = −2.91. The target is listed with a period of 0.487502 d and an RV amplitude of 48.5(1.2) km s−1 in a list of close binaries by Geier et al. (2011), citing an unpublished Napiwotzki et al. (in prep.) paper Sahoo et al. (2020b) used Full Frame Images taken during Sector 10 and reported a 0.49 d variation. Consequently the object was proposed and successfully observed by TESS during Sector 37. We confirmed the low frequency, and we also detected its harmonic. Based on the shape and the high amplitude of the flux variation, the orbital signal must be a reflection effect, as in the case of TIC 142200764. We detected only one significant high frequency. We show an amplitude spectrum in Fig. 6 and list the prewhitened high frequency in Table 4.
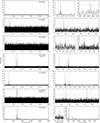 |
Fig. 6. Amplitude spectra of targets observed in the USC mode. Left panels: frequency range up to the Nyquist frequency. Right panels: close-ups at the detected frequencies. |
TIC 29840077 (Gaia DR2 6803823552347267968, EC 21032–2551) is a new sdB pulsator. This target was identified as an sdB star by O’Donoghue et al. (2013). TESS observed the star during Sector 28. We detected two frequencies in the p-mode region. We show an amplitude spectrum in Fig. 6 and list the prewhitened frequencies in Table 4.
TIC 33318760 (Gaia DR2 3766481985523752320, V541 Hya, EC 09582–1137, PG 0958–116) is a known sdB pulsator. It was included in the catalog of UV-excess stellar objects (Green et al. 1986), in the catalog of spectroscopically identified hot subdwarfs (Kilkenny et al. 1988), and in the EC survey (Kilkenny et al. 1997b). Kilkenny et al. (2006) analyzed photometric data and reported a detection of two frequencies in the p-mode region. Additionally, four significant frequencies were reported by Randall et al. (2009). One of the modes was considered split by rotation. The authors performed period fits and obtained structural parameters of the sdB star. Mackebrandt et al. (2020) searched, with a null result, for a change in the arrival time of stellar pulsations induced by a sub-stellar companion. TESS observed the star during Sector 35. We detected one frequency (f1) in the intermediate-frequency region and two frequencies (f2, f3) in the p-mode region. Frequencies f1 and f2 are of low amplitude and could be noise-induced. These two frequencies had not been detected from the ground. Frequency f3 confirms the highest frequency reported by both Kilkenny et al. (2006) and Randall et al. (2009). Its amplitude is much smaller in the TESS data than in the ground observations. The intrinsic amplitude could have changed since the last time the star was monitored, or remained the same but the wide band pass of the TESS photometric system could have averaged the flux variation. While the intrinsic effect is not easy to predict, it certainly takes place. We show an amplitude spectrum in Fig. 6 and list the prewhitened frequencies in Table 4.
TIC 47377536 (Gaia DR2 3806303066866089216, UY Sex, PG 1047+003) is a known sdB pulsator and has been extensively studied since its independent discovery by Billères et al. (1997) and O’Donoghue et al. (1998). Five and eight independent frequencies were reported by the former and latter authors, respectively. O’Donoghue et al. (1998) confirmed all frequencies reported by Billères et al. (1997). Kilkenny et al. (2002) reported an enhanced list of frequencies obtained from a multisite campaign. The authors listed 18 frequencies, but three reported by O’Donoghue et al. (1998) were not detected. Kilkenny et al. (2002) speculated on rotationally split modes, and provided a mode identification and a comparison of modeled and observed periods. Charpinet et al. (2003) published a model providing mode identifications for 16 frequencies. The star was observed during the Kepler K2 mission (Reed et al. 2020). The authors detected 97 frequencies, including rotationally split multiplets. The frequency splitting allowed a rotation period of 24.6(3.5) days to be estimated. The authors reported all frequencies detected prior to their analysis. TESS observed the star in Sectors 35 and 46. We analyzed both sectors separately. Since we did not detect all frequencies in both sectors, while the amplitudes of those repeating in both sectors are different, we decided not to merge data for a joint analysis. Merging would average amplitudes and contribute to a complex window function, making prewhitening difficult. In both sectors we detected only 13 independent frequencies. The majority of these frequencies confirm the ones reported by Reed et al. (2020). However, even allowing for a poor frequency resolution, around 0.5 μHz, we report f7 in Sector 35, and f4 and f5 in Sector 46 as new detections. We show an amplitude spectrum calculated only from Sector 46 data in Fig. 6 and list the prewhitened frequencies in Table 4.
TIC 53826859 (Gaia DR2 2921084812241684608) is a new sdB pulsator. The sdB classification is confirmed with a spectrum taken with the 1.9 m telescope at SAAO. TESS observed the star during Sector 33 and we detected 11 frequencies in the p-mode region, although the frequencies are rather low for p-modes. We show an amplitude spectrum in Fig. 6 and list the prewhitened frequencies in Table 4.
TIC 60257911 (Gaia DR2 656345533398638464, EPIC 211823779) is a known sdB pulsator. Reed et al. (2018) found the star to be a binary consisting of an sdB star and a main-sequence companion. The authors analyzed K2 data and reported 16 frequencies in the p-mode region. Just a few candidates for rotationally split modes were marked and a possible 11.5(8)-day spin rate was estimated. TESS observed the star during Sectors 44–46. We detected only two frequencies, which were found in the K2 data to be the highest-amplitude frequencies. We do not confirm our frequency f2 to be rotationally split. The TESS data coverage of ∼79 d is comparable to the coverage obtained with the K2 data. We show an amplitude spectrum in Fig. 6 and list the prewhitened frequencies in Table 4.
TIC 62381958 (Gaia DR2 5149241067178231552, EC 01541-1409) is a known sdOB pulsator. It was noted as an sdOB star in the EC survey (as published in Kilkenny et al. 2016), and Kilkenny et al. (2009) analyzed photometric data and reported six frequencies in the p-mode region. Follow-up multisite time-series data were collected and analyzed by Reed et al. (2012). The number of frequencies reported depends on one observing season but reaches almost 30 in 2009. All frequencies reported by Kilkenny et al. (2009) were detected by Reed et al. (2012). In the latter paper, the time span of the 2009 campaign was around a month, yet still the authors reported no candidate rotationally split frequencies. Randall et al. (2014) reported results of a mode identification of several frequencies detected in the spectrophotometric data collected by the authors. TESS observed the star during Sector 30. We show an amplitude spectrum in Fig. 6 and list the prewhitened frequencies in Table 4. The majority of frequencies we detected overlap with those listed by Reed et al. (2012). In addition, we found one significant frequency in the g-mode region at a relatively high frequency. Such a frequency in this star has not been reported thus far. As shown by Reed et al. (2012), this star exhibits frequency and/or amplitude variation of the pulsations modes between two observational seasons. The signal in the amplitude spectrum calculated from the TESS data is also very unstable. We tried to prewhiten all signals down to the adopted threshold, but we do not know if the close frequencies, within 1 μHz, are independent or a consequence of an instability of one mode. A common frequency spacing between close frequencies is about 0.5 μHz, which is comparable to the frequency resolution derived from 1/T, with T being the total data coverage. Since the data are quite continuous, the aliases in a Fourier window response are of low amplitude; hence, we do not expect the close frequencies to be aliases.
TIC 62483415 (Gaia DR2 6601695863046409600, PHL 252, EC 22221-3152) is a known sdOB pulsator (Kilkenny et al. 2016). Kilkenny et al. (2009) observed it photometrically and reported 11 frequencies between 5500 and 11 900 μHz. It was not mentioned in that paper, but f11 would appear to be the first harmonic of f1. Barlow et al. (2017) delivered two-site photometry of the star and reported 11 independent frequencies, along with three combination and four close frequencies, which the authors interpreted as rotationally split modes. The rotation period was estimated at ∼8 d but this is incorrect (see below). TESS observed the star during Sector 28. We detected ten independent frequencies, as well as two combination frequencies. We show an amplitude spectrum in Fig. 7 and list the prewhitened frequencies in Table 4. We found f11 and f12, which were not detected by the other authors. The rotation period derived by Barlow et al. (2017) is close to their data coverage and that is why they suggested a longer timebase to confirm this result. One sector of TESS data is roughly 27 days. If the rotation period is indeed about 8 days, we should surely detect split modes. They listed their f1 and f5 as candidates for split modes. We find the former frequency (f5 in our list) to be an amplitude variable, and the latter frequency (f6 in our list) to be single. Frequency f5 in our list is so variable that we were unable to prewhiten any frequency in that range and we decided to quote numbers read by eye; hence, these are given without error estimates.
TIC 69298924 (Gaia DR2 654866823401111168, GALEX J080656.7+152718) is a known sdB pulsator. Vennes et al. (2011) identified it as an sdB star, while Baran et al. (2011b) analyzed photometric data reporting four frequencies, two in the g-mode region and two in the p-mode region, showing the star to be a hybrid sdB pulsator. The authors analyzed time-series spectroscopic data, detecting one frequency, which overlaps with the highest-amplitude frequency in the photometric data. TESS observed the star during Sectors 44–46. Since these are consecutive sectors and the amplitude spectra calculated from single-sector data do not differ substantially, we combined all the data. We detected four frequencies in the p-mode region and none in the g-mode region. Three frequencies are close to each other and seem to be rotationally split frequencies. The average frequency splitting of 0.8953(67) μHz translates into a rotation period of 12.9(1) d. These three frequencies overlap with, apparently unresolved, frequency f1 reported by Baran et al. (2011b). Our frequency f1 is close to the frequency f1 reported earlier. We show an amplitude spectrum in Fig. 7 and list the prewhitened frequencies in Table 4.
TIC 70549283 (Gaia DR2 673058556816796288) is a new sdOB pulsator. The spectral classification was reported by Lei et al. (2019). TESS observed the star during Sectors 44–46. We detected only one frequency in the two-sector merged data. We show an amplitude spectrum in Fig. 7 and list the prewhitened frequency in Table 4.
TIC 98871628 (Gaia DR2 3486707300467202304, V551 Hya, EC 11583-2708) is a known sdB pulsator. Kilkenny et al. (1997b) listed the star as having a composite spectrum (sdB+). Pulsations were found by Kilkenny et al. (2006), who detected four frequencies and noted that the companion could be an early G-type star. TESS observed the star during Sector 36. We detected only one frequency, which is the one with the highest amplitude reported by Kilkenny et al. (2006). We show an amplitude spectrum in Fig. 7 and list the prewhitened frequency in Table 4.
TIC 139723188 (Gaia DR2 6466786576593357440, EC 21281-5010) is a known sdOB pulsator. Kilkenny et al. (2015) identified the star as a hot subdwarf, and Kilkenny et al. (2019) observed it photometrically and reported three frequencies. TESS observed the star during Sectors 27 and 28. Since these are consecutive sectors and the amplitude spectra calculated from single sectors show very similar signal distribution, we analyzed these two sectors merged. We detected three frequencies, but only two are the same as those reported by Kilkenny et al. (2019). We show an amplitude spectrum in Fig. 7 and list the prewhitened frequencies in Table 4.
TIC 156618553 (Gaia DR2 3675067076961979264, HW Vir, PG 1241-084, HE 1241-0823) is a known sdB pulsator. It has been extensively studied in the past. Berger & Fringant (1980) classified the object as an sdB star, while Menzies & Marang (1986) found it to be an eclipsing binary system. Since that time the object has been monitored mostly photometrically to verify the stability of the orbital period. Variation in the orbital period was first detected by Kilkenny et al. (1994) and has been extensively monitored since then, with a recent compilation by Baran et al. (2018). We estimated the mid-times of eclipses observed by TESS and derived the orbital period of 0.116719509(8) d. Baran et al. (2018) found the sdB star to be a rich pulsator, reporting both the g- and p-mode pulsations. In total, they listed 91 frequencies, of which the majority are in the g-mode region, with a decent number in the intermediate region and only three above 3000 μHz. The authors delivered the most updated Observed–Calculated (O–C) diagram at the time. TESS observed the star during Sector 46. We removed the orbital contribution in the amplitude spectrum prior to pulsation search. Finally, we detected only four frequencies, with one being in the p-mode region. Only one frequency f2 we detected in the TESS data overlaps with f4 listed by Baran et al. (2018). We show an amplitude spectrum in Fig. 7 and list the prewhitened frequencies in Table 4. We also removed the pulsations from the data to derive the mid-times of the eclipses. We folded all eclipses within a single TESS orbit and derived the mid-times 2 459 559.135104(1) and 2 459 572.908007(1) during the first and the second TESS orbits, respectively.
TIC 169285097 (Gaia DR2 2312392250224668288, HE 2341-3443, CD-35 15910) is a new sdB pulsator. It was listed as an sdB star by Lamontagne et al. (2000). During the TESS mission, it was first observed during Sector 2 and the results of the pulsation analysis were reported by Sahoo et al. (2020a). The authors analyzed only the SC data reporting 43 frequencies, with six being high frequencies. TESS photometry was also taken during Sector 29. We list the USC frequencies in Table 4 and show an amplitude spectrum in Fig. 7. We detected only 34 frequencies, which is nine fewer than in the list reported by Sahoo et al. (2020a), and we did not find any new frequencies in Sector 29.
TIC 220573709 (Gaia DR2 4720417758386878080, EC 03089-6421) is a known sdO pulsator. Kilkenny et al. (2015) listed it as an sdO star, and Kilkenny et al. (2017) reported two very high frequencies, at ∼32.12 mHz and ∼29.26 mHz, detected in the photometric data. The authors speculated that this star could be a field counterpart of the ω Cen sdO variables (Randall et al. 2011). Later, Kilkenny et al. (2019) reobserved the star, finding an additional frequency at ∼37.65 mHz. TESS observed the star during Sectors 28 and 30. The USC data have a Nyquist frequency shorter than the frequencies reported by Kilkenny et al. (2017, 2019) and so, if we did not have the ground-based results, it would be difficult to extract the correct frequencies from the aliases. The amplitude spectra from the two sectors look a little different, so the window function of the combined data gives averaged amplitudes and split peaks, which make prewhitening more difficult. Therefore, we decided to analyze each sector data separately. We show an amplitude spectrum calculated only from Sector 28 data in Fig. 8 and list the prewhitened frequencies in Table 4. In both sectors we confirm frequencies around 32.12 mHz, while we detected the 29.26 mHz frequency only in Sector 28. We found no signature of the highest frequency around 37.65 mHz. Besides the high frequencies, in both sectors, we detect ∼12.1 μHz frequency. Such a low frequency can be attributed either to a binary frequency or to on-board systematics. We know of a 1 d−1 artifact, which is related to the Earth’s rotation and is explained in the TESS Data Release Notes available on the MAST. However, two high frequencies are spaced exactly by the low-frequency value (see Table 4). To interpret both the low frequency and the spacing between high frequencies, we can invoke a tidally locked binary system. In this case, the rotation, determined by the frequency splitting between rotationally split frequencies, would be the same as the binary frequency. If this interpretation is correct, the star has the shortest rotation period among all subdwarfs for which the rotation has been estimated. We stress that not all high frequencies are split, which can weaken our interpretation, though the side components are independent from the central one, and their absence does not necessarily rule out our conclusion.
TIC 241771689 (Gaia DR2 6093621087563287040, CD-48 8608) is a new sdB pulsator. It is included in the GALEX survey (Németh et al. 2012). Kawka et al. (2015) listed the star as a binary system consisting of an sdB star and a G8 main-sequence companion. TESS observed the star during Sector 38. We show an amplitude spectrum in Fig. 8. It is very rich in frequencies in the p-mode region. We also detected six frequencies in the g-mode region, so the star is a hybrid pulsator. The list of prewhitened frequencies is shown in Table 4. The highest-amplitude frequencies ∼5120 μHz show a multiplet structure and there are two frequency splittings that we can report. The splitting between frequencies f9, f10, and f11, between f12 and f13, and between f15 and f16 is ∼1.5 μHz. We detected a few low-amplitude frequencies between 10 and 40 μHz, including 15.7 μHz and its first harmonic, and 17.4 μHz and its first harmonic. The frequencies are not included in our list of prewhitened frequencies. If the splitting of ∼1.5 μHz is caused by rotation, then the period would be ∼7.7 d, which is comparable, for example, to that estimated for V585 Peg (Baran et al. 2009). Some of the frequencies above 10 000 μHz can be combination frequencies of the highest-amplitude modes. We found no exact values, but f42 is very close to 2⋅f15, while f41 is close to f10+f15.
TIC 248949857 (Gaia DR2 2482171590176492928, EO Cet, PB 8783) is a known sdO pulsator. It had been originally identified as an sdB star in which pulsations were found by Koen et al. (1997), who reported six high frequencies. A subsequent paper by O’Donoghue et al. (1998) reported 11 frequencies, including resolved close frequencies, as a consequence of a higher-frequency resolution, but did not confirm the 7.883 and 8.291 mHz frequencies. The authors provided a mode identification by fitting models to the observed periods. Østensen (2012) analyzed new spectra and reclassified this star as an sdO star. TESS observed the star during Sector 30. We detected 11 frequencies, confirming detections reported by O’Donoghue et al. (1998) and Van Grootel et al. (2014). We show an amplitude spectrum in Fig. 8 and list the prewhitened frequencies in Table 4.
TIC 273218137 (Gaia DR2 5371215147518355328, L 325-214) is a new sdB pulsator. It was mistakenly identified as a DA white dwarf by McCook & Sion (1987). Kawka et al. (2007) collected new spectroscopy and reclassified the object as an sdB star, with Teff = 30 080(660) K, log(g/cm s−2) = 5.15(10), and log(n(He)/log (H)) ≲ −3.0. TESS observed the star during Sector 37. We detected a large-amplitude high frequency with two low-amplitude frequencies symmetrically spaced by 3.696(21) μHz, on average. We show an amplitude spectrum in Fig. 8 and list the prewhitened frequencies in Table 4. We calculated the O–C diagram from the phase of frequency f5 and detected a 3.15 d variation. Independently of our analysis, Smith et al. (2022) reported the detection of a secondary companion with a period of 3.1 d.
TIC 322009509 (Gaia DR2 4990641054653089664, JL 166) is a known sdOB pulsator. The Kilkenny et al. (1988) catalog lists it as an sdOB star and Barlow et al. (2009) reported ten frequencies and one combination frequency. TESS observed the star in Sector 29. We show an amplitude spectrum in Fig. 8 and list the prewhitened frequencies in Table 4. We detected only two frequencies and neither were previously reported by Barlow et al. (2009), although they are close to their f2 and f4.
TIC 335635628 (Gaia DR2 3609593392911348096, PG 1315-123) is a known sdB pulsator. Green et al. (1986) classified the star as a cataclysmic variable, while Kilkenny et al. (1988) listed it as an sdB star. Reed et al. (2019) analyzed data collected during the K2 mission and reported 46 frequencies in the p-mode region and 16 frequencies in the g-mode region. The g-modes are rather surprising at the high Teff of ∼36 000 K. Among both p- and g-modes, the authors identified consistent rotationally split frequencies, derived the rotation period of 16.18(57) days, and concluded that the star rotates as if it were a solid body. The authors analyzed spectroscopic data, reporting a clear contribution from a main-sequence companion. TESS observed the star during Sector 46. We detected just one frequency, which is the closest to f37 listed by Reed et al. (2019). This is surprising, since we would expect the frequency in the TESS data to be one of the highest-amplitude frequencies in the K2 data. It is thus likely that the pulsation properties of this star change significantly over a few years. We show an amplitude spectrum in Fig. 8 and list the prewhitened frequencies in Table 4.
TIC 355058528 (Gaia DR2 6692773045444107008, V4640 Sgr, EC 20117-4014, CD-40 13747) is a known sdB pulsator. O’Donoghue et al. (1997) analyzed its spectra and concluded that they are similar to the spectra of other sdB stars. The authors also analyzed photometric time-series data and reported three frequencies, which were later confirmed by Randall et al. (2006). The latter author attempted a detailed asteroseismic analysis, arriving at two potential families of optimal models. TESS observed the star during Sector 27. We found only one frequency, which was reported by previous authors as the dominant amplitude. We show an amplitude spectrum in Fig. 8 and list the prewhitened frequencies in Table 4.
TIC 355638102 (Gaia DR2 6494992795056667648, EC 23507-5733, LB 1535) is a new pulsator. Kilkenny et al. (2016) classified it as a He-sdO star. Based on a spectrum taken with the 1.9 m telescope at SAAO, we classified it as a He-sdOB star. TESS observed the star during Sector 28. We detected only two close frequencies. We show an amplitude spectrum in Fig. 9 and list the prewhitened frequency in Table 4.
TIC 366399746 (Gaia DR2 601188910547673728) is a new sdB pulsator. The star has been classified as an sdB+MS binary system by Luo et al. (2016). Sahoo et al. (2020b) reported one low frequency, interpreting it as a binary signature, and consequently the object was proposed and successfully observed by TESS during Sectors 45 and 46. We confirmed the low frequency, but it is of a very low amplitude. We detected one significant high frequency. We show an amplitude spectrum in Fig. 9 and list the prewhitened high frequency in Table 4.
TIC 396954061 (Gaia DR2 3259060049366022400, 2M 0415+0154) is a known sdB pulsator. Oreiro et al. (2009) analyzed its spectra and derived Teff = 34 000(500) K and log(g/cm s−2) = 5.80(5), which are characteristic of sdB stars. They also analyzed time-series data and reported three frequencies. TESS observed the star during Sector 32. We confirm f1 listed by Oreiro et al. (2009), while the other two frequencies we found differ by a few μHz; these two are close together and could have not been resolved well in the run obtained by Oreiro et al. (2009). We show an amplitude spectrum in Fig. 9 and list the prewhitened frequencies in Table 4.
TIC 409644971 (Gaia DR2 5947131955116293760) is a new sdB pulsator. Németh et al. (2012) analyzed the star spectroscopically and concluded that it is a binary consisting of an sdB star and an F7 main-sequence component. TESS observed the star during Sector 39. As with TIC 142200764, the light curve shows a characteristic reflection effect with a period of 0.09 d and we show the phase-folded data in Fig. 10, while the ephemeris is provided in Table 3. The binary frequency and its harmonics are listed in Table 4. The reflection effect must be caused by a companion of lower mass than the sdB star, and so it is typically an M-dwarf. The F7 star visible in the optical spectrum is most likely in a wide orbit, or is possibly unbound from the sdB+dM binary. Follow-up low-resolution spectroscopy would be useful to confirm the orbit of the sdB+dM binary, and high-resolution spectroscopy is required to establish if the F star is orbiting the inner binary. Hierarchical triple systems may play an essential role in forming many sdB stars, including the many apparently single stars that are observed, as explored in the recent paper by Preece et al. (2022). According to their analysis, while the majority of the initial triple systems end up in configurations where the outer tertiary escapes after the mass-loss episode that produces the sdB star, either as a merger remnant or as a post-common-envelope binary, many are predicted to remain in a triple configuration. In addition to the binary signal, we detected ten frequencies in the high-frequency region, which we associate with p modes. We show an amplitude spectrum in Fig. 9. If these frequencies turn out to be phase stable over time, there is a chance that the orbit of the sdB+dM binary around the F star can be explored through the light-travel-time effect.
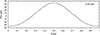 |
Fig. 10. Phase-folded light curve of TIC 409644971 showing a reflection effect. The number in the upper right corner is the orbital period, rounded to two significant digits, used for folding the light curve. |
TIC 434923593 (Gaia DR2 5862700251105587968, CS 1246) is a known sdB pulsator. Barlow et al. (2010) confirmed the sdB type and reported on their analysis of photometric data and the discovery of one large-amplitude frequency. TESS observed the star during Sector 38. We detected one high frequency with an amplitude of 10.6 ppt. The star is known for a large decrease in the amplitude of its only frequency, which is confirmed with our detection, that is to say the pulsation amplitude is about 30% of the discovery amplitude, and is consistent with the amplitude recently observed from the ground (unpublished). We show an amplitude spectrum in Fig. 9 and we list the prewhitened frequency in Table 4.
While checking on the contamination of TIC 434923593, we found TIC 434923595 and TIC 434925198 to be variable stars. We retrieved the light curves from the SC data and calculated the amplitude spectra. There is only one frequency in each star detected. In TIC 434923595 we found 203.674(32) μHz at 2.18(29) ppt (S/N = 6.3), while in TIC 434925198 we found 202.291(39) μHz at 1.12(19) ppt (S/N = 5.1).
TIC 436579904 (Gaia DR2 3308791681845675136, V1405 Ori, KUV 04421+1416) is a known sdB pulsator. The Kilkenny et al. (1988) catalog lists it an sdB star, and Koen et al. (1999) analyzed time-series data and reported seven frequencies. Reed et al. (2020) reported on their analyses of K2 data, which detected a flux variation caused by binarity, confirming the suspicion of Koen et al. (1999). The flux variation is caused by the reflection effect and the orbital period is 0.398 days. Reed et al. (2020) listed 107 high frequencies attributed to p modes. Some of the frequencies were explained by rotationally split multiplets. Additionally, 19 frequencies were detected in the low-frequency region and attributed to g modes. The authors used an asymptotic period spacing to identify the modal degree. TESS observed the star during Sectors 32, 43, and 44. The phase-folded light curve showing the reflection effect is presented in Fig. 11, while the ephemeris is given in Table 3. First, we calculated amplitude spectra from single-sector data. In each spectrum we detected a handful of high frequencies. However, they vary significantly between sectors, and therefore we decided to analyze the sector data separately. We show an amplitude spectrum calculated only from Sector 44 data in Fig. 9 and list the prewhitened frequencies in Table 4.
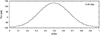 |
Fig. 11. Phase-folded light curve of TIC 436579904 showing a reflection effect. The number in the upper right corner is the orbital period, rounded to two significant digits, used for folding the light curve. |
TIC 437043466 (Gaia DR2 611587919724027392, GALEX J085649.3+170115, EPIC 211779126) is a known sdB pulsator, identified as an sdB star by Németh et al. (2012). Pulsations were found by Baran et al. (2017), who reported the results of their analysis of the K2 data. They found 154 frequencies in the g-mode region and 29 in the p-mode region, which makes the star a rich hybrid pulsator. Rotationally split modes allowed for an estimation of a rotation period of ∼16 days to be made. Trapped modes were also reported. TESS observed the star during Sectors 44–46. First, we compared the amplitude spectra calculated from single-sector data. We detected two frequencies in the p-mode region in all sectors, which are the highest-amplitude frequencies found by Baran et al. (2017). The g-mode region looks different in each sector, but the majority of frequencies repeat. When we combined all sector data together, we detected all but one frequency, f3 in Sector 45, which had been detected in single-sector data; on the other hand, we detected two frequencies, f6 and f7 in Sectors 44-46, which are not significant in single-sector data. In Table 4 we show all the frequencies we found, while in Fig. 9 we show an amplitude spectrum calculated from merged data.
TIC 452718256 (Gaia DR2 3533727090595727104, EC 11275-2504) is a known sdOB pulsator that was classified as an sdOB star by Kilkenny et al. (1997b). Kilkenny et al. (2019) reported the discovery of a signal at frequencies around 6.78 mHz, and between 7.5 and 7.8 mHz, depending on data taken sporadically over 2 yr. TESS observed the star during Sector 36, from which we detected two close frequencies around 6779 μHz. We show an amplitude spectrum in Fig. 12 and list the prewhitened frequencies in Table 4.
TIC 471013461 (Gaia DR2 4843383737223292672, EC 03530-4024) is a new sdB pulsator. Kilkenny et al. (2016) classified it as an sdB star. TESS observed the star during Sector 31, from which we detected only one frequency in the p-mode region. We show an amplitude spectrum in Fig. 12 and list the prewhitened frequency in Table 4.
TIC 673345538 (Gaia DR2 3296244226946647168, V1835 Ori) is a known sdB pulsator. Ramsay & Hakala (2005) found short-period variability in the star, while Ramsay et al. (2006) classified the as an sdB star and identified the flux variation as p-mode pulsations. The low Teff of 29 200(1900) K correlates with pulsation period below 3 000 μHz. Baran et al. (2011a) reobserved the star over the course of 47 days from two different sites and reported six frequencies in the g-mode region and six frequencies, including one combination, in the p-mode region. That discovery makes the star a hybrid sdB pulsator. TESS observed the star during Sectors 43 and 44. We detected only one frequency, which is the highest-amplitude frequency reported by Baran et al. (2011a). We show an amplitude spectrum in Fig. 12 and list the prewhitened frequency in Table 4.
4. Summary
We present the results of our search for short-period pulsating hot subdwarfs. We used TESS space data collected mostly during years 1 and 3, covering the southern ecliptic hemisphere. We report the stars that show signals at high frequencies, which we associate with p-mode pulsations. In most cases the amplitudes of p modes dominate amplitude spectra. However, there are two stars that have gravity modes of comparable amplitude. Except for those two stars, 41 hot subdwarfs in our sample can be considered p-mode-dominated pulsators. In total, we detected short-period pulsations in 43 hot-subdwarf stars. We found 32 (17 new) sdB stars, eight (three new) sdOB stars, two sdO stars, and one new He-sdOB star.
We expect that the new hot-subdwarf p-mode pulsators presented in this paper will trigger follow-up monitoring in the future, either from the ground or from space (e.g., PLATO or further TESS observations). Moreover, in cases where the number of frequencies detected with TESS is not higher than what was seen previously from the ground, there is still useful information on the confirmed frequencies: there is no more ambiguity caused by daily aliases, and the precision is higher due to the long time baseline and coverage obtained by TESS. In addition, observing the same frequencies at different epochs can be useful for Ṗ analyses (e.g., linked to the evolution of the star) or O-C studies (e.g., linked to the presence of a yet undetected companion).
We prewhitened pulsation frequencies above an assumed detection threshold from the TESS light curves. The number of frequencies detected in a given star varies from one to 42. Some stars show combination frequencies and/or low frequencies along with harmonics. The latter are a typical signature of binarity. We identified three stars showing large-amplitude binary signatures and we phased the data to show the orbital variation. For TIC 156618553, which is the well-known prototype of the HW Vir-type eclipsing binaries, we derived the mid-times of two TESS-orbit averaged eclipses to high accuracy.
We looked for multiplets that may help in identifying the geometry of the modes and estimated rotation periods of those pulsators. Out of our 43 targets, multiplets had been previously reported for only six known pulsators: TIC 47377536, TIC 60257911, TIC 62483415, TIC 335635628, TIC 436579904, and TIC 437043466. We can confirm none of those multiplets. In four cases, two new (TIC 139481265 and TIC 241771689) and two known (TIC 69298924 and TIC 220573709) pulsators, we found candidates for rotationally split frequencies. However, these detections should be confirmed with longer baseline data. The estimated rotation periods range between 1 and 12.9 days.
As mentioned in the introduction, pulsations in sdO stars are extremely rare and it is of great importance to expand the numbers of these stars in order to establish the boundaries within which pulsations can be driven in hot-subdwarf stars. We will present in a forthcoming paper (that will include p-mode pulsators detected in the northern ecliptic hemisphere) a detailed statistical analysis on the presence of p-mode pulsators among hot subdwarfs, and their boundaries in a Teff-log g diagram.
While no new Helium-poor sdO stars were found to display pulsations in the TESS data, the discovery of two significant pulsation modes in TIC 355638102 is very surprising. Spectroscopically, this is a iHe-sdOB star and it is roughly comparable to the V366 Aqr pulsators. A rough assessment of the available spectrum indicates a Teff around 40 kK and a surface gravity in the vicinity of log g = 6, which is slightly on the hot side of the V366 Aqr stars. All the pulsators of this class have been found to have unusual heavy-metal abundances in their atmospheres, in particular extreme levels of Ge, Sr, Y, and Zr. A high-resolution spectrum of the star would be required in order to establish if this is also the case for TIC 355638102. However, the V366 Aqr stars show pulsations in the range of 2000–6000 s, which must be g modes in subdwarf stars, and the pulsations we detect in TIC 355638102 are at 108.5 s, which can only be p modes. A pulsation mechanism invoking the enhancement of carbon was proposed by Saio & Jeffery (2019) and further explored by Miller Bertolami et al. (2022), and has had some success in explaining the presence of g modes at such high temperatures, but has not attempted to explain the absence of p modes in the V366 Aqr pulsators. Further photometric and spectroscopic studies of TIC 355638102 are required to make a clear connection here.
Besides the primary goal of this paper, we also found three other new variables, which happened to be located in the target masks of two of our program targets. We detected these stars while doing contamination analysis to avoid false positives. The frequency detected in TIC 434925198 is only marginally above the detection threshold, while the signals in TIC 434923595 and TIC 754255960 are significant. The latter shows three harmonics, indicating a non-sinusoidal shape of the flux variation. This can be interpreted as, for example, shallow eclipses or radial pulsations in classical pulsators. More precise photometric and spectroscopic observations are required to classify the variability types of these three new variables.
The He abundance is intermediate between He poor and He enhanced. He poor is defined as subsolar, i.e. log(n(He)/log (H)) < −1, and He enhanced is higher than neutral, i.e. n(He) > n(H) or log(n(He)/log (H)) > 0. So the intermediate region is between neutral and solar, i.e. between 0 and −1 in log(n(He)/n(H)).
https://archive.stsci.edu/
All NOT spectra used in this work were obtained with ALFOSC, Grism #18, and a 1.0 arcsec slit, giving R = 1000 and spanning 345-535 nm.
Acknowledgments
We thank Don Kurtz for valuable comments, which have significantly improved the quality of the manuscript. Financial support from the National Science Centre in Poland under project No. UMO-2017/26/E/ST9/00703 is acknowledged. SC acknowledges financial support from the Centre National d’Études Spatiales (CNES, France) and from the Agence Nationale de la Recherche (ANR, France) under grant ANR-17-CE31-0018. PN acknowledges support from the Grant Agency of the Czech Republic (GAČR 22-34467S). The Astronomical Institute in Ondřejov is supported by the project RVO:67985815. This paper includes data collected with the TESS mission, obtained from the MAST data archive at the Space Telescope Science Institute (STScI). Funding for the TESS mission is provided by the NASA Explorer Program. STScI is operated by the Association of Universities for Research in Astronomy, Inc., under NASA contract NAS 5–26555. This paper uses observations made at the South African Astronomical Observatory (SAAO). This paper uses observations made at the Nordic Optical Telescope (NOT). This research has made use of the SIMBAD database, operated at CDS, Strasbourg, France. This work has also made use of data from the European Space Agency (ESA) mission Gaia (https://www.cosmos.esa.int/gaia), processed by the Gaia Data Processing and Analysis Consortium (DPAC, https://www.cosmos.esa.int/web/gaia/dpac/consortium). Funding for the DPAC has been provided by national institutions, in particular the institutions participating in the Gaia Multilateral Agreement. V.V.G. is a F.R.S.-FNRS Research Associate. This research has used the services of https://astroserver.org/">https://astroserver.org/.
References
- Ahmad, A., & Jeffery, C. S. 2005, A&A, 437, L51 [NASA ADS] [CrossRef] [EDP Sciences] [Google Scholar]
- Baran, A., Pigulski, A., Kozieł, D., et al. 2005, MNRAS, 360, 737 [NASA ADS] [CrossRef] [Google Scholar]
- Baran, A., Oreiro, R., Pigulski, A., et al. 2009, MNRAS, 392, 1092 [NASA ADS] [CrossRef] [Google Scholar]
- Baran, A., Østensen, R., Telting, J., et al. 2018, MNRAS, 481, 2721 [NASA ADS] [CrossRef] [Google Scholar]
- Baran, A. S., & Koen, C. 2021, Acta Astron., 71, 113 [Google Scholar]
- Baran, A. S., Gilker, J. T., Fox-Machado, L., Reed, M. D., & Kawaler, S. D. 2011a, MNRAS, 411, 776 [NASA ADS] [CrossRef] [Google Scholar]
- Baran, A. S., Gilker, J. T., Reed, M. D., et al. 2011b, MNRAS, 413, 2838 [NASA ADS] [CrossRef] [Google Scholar]
- Baran, A. S., Reed, M. D., Stello, D., et al. 2012, MNRAS, 424, 2686 [NASA ADS] [CrossRef] [Google Scholar]
- Baran, A. S., Reed, M. D., Østensen, R. H., Telting, J. H., & Jeffery, C. S. 2017, A&A, 597, A95 [NASA ADS] [CrossRef] [EDP Sciences] [Google Scholar]
- Barlow, B. N., Dunlap, B. H., Lynas-Gray, A. E., & Clemens, J. C. 2009, AJ, 138, 686 [NASA ADS] [CrossRef] [Google Scholar]
- Barlow, B. N., Dunlap, B. H., Clemens, J. C., et al. 2010, MNRAS, 403, 324 [NASA ADS] [CrossRef] [Google Scholar]
- Barlow, B. N., Kilkenny, D., Geier, S., et al. 2017, PASP, 129, 054202 [NASA ADS] [CrossRef] [Google Scholar]
- Beers, T. C., Preston, G. W., Shectman, S. A., Doinidis, S. P., & Griffin, K. E. 1992, AJ, 103, 267 [NASA ADS] [CrossRef] [Google Scholar]
- Berger, J., & Fringant, A. M. 1980, A&A, 85, 367 [NASA ADS] [Google Scholar]
- Billères, M., Fontaine, G., Brassard, P., et al. 1997, ApJ, 487, L81 [CrossRef] [Google Scholar]
- Charpinet, S., Fontaine, G., Brassard, P., & Dorman, B. 1996, ApJ, 471, L103 [Google Scholar]
- Charpinet, S., Fontaine, G., Brassard, P., et al. 1997, ApJ, 483, 123 [Google Scholar]
- Charpinet, S., Fontaine, G., & Brassard, P. 2003, in White Dwarfs, (NATO ASI Ser. B, 105), ed. D. de Martino, R. Silvotti, J.-E. Solheim,& R. Kalytis (Dordrecht: Kluwer), 69 [NASA ADS] [CrossRef] [Google Scholar]
- Charpinet, S., Green, E. M., Baglin, A., et al. 2010, A&A, 516, L6 [NASA ADS] [CrossRef] [EDP Sciences] [Google Scholar]
- Christlieb, N., Wisotzki, L., Reimers, D., et al. 2001, A&A, 366, 898 [NASA ADS] [CrossRef] [EDP Sciences] [Google Scholar]
- Edelmann, H., Heber, U., Altmann, M., Karl, C., & Lisker, T. 2005, A&A, 442, 1023 [NASA ADS] [CrossRef] [EDP Sciences] [Google Scholar]
- Fontaine, G., Brassard, P., Green, E. M., et al. 2008, A&A, 486, L39 [NASA ADS] [CrossRef] [EDP Sciences] [Google Scholar]
- Fontaine, G., Brassard, P., Charpinet, S., et al. 2012, A&A, 539, A12 [NASA ADS] [CrossRef] [EDP Sciences] [Google Scholar]
- Geier, S. 2013, A&A, 549, A110 [NASA ADS] [CrossRef] [EDP Sciences] [Google Scholar]
- Geier, S., Hirsch, H., Tillich, A., et al. 2011, A&A, 530, A28 [NASA ADS] [CrossRef] [EDP Sciences] [Google Scholar]
- Green, E. M., Fontaine, G., Reed, M. D., et al. 2003, ApJ, 583, 31 [Google Scholar]
- Green, R. F., Schmidt, M., & Liebert, J. 1986, ApJS, 61, 305 [NASA ADS] [CrossRef] [Google Scholar]
- Han, Z., Podsiadlowski, P., Maxted, P. F. L., Marsh, T. R., & Ivanova, N. 2002, MNRAS, 336, 449 [Google Scholar]
- Holdsworth, D. L., Østensen, R. H., Smalley, B., & Telting, J. H. 2017, MNRAS, 466, 5020 [Google Scholar]
- Iben, I. J. 1990, ApJ, 353, 215 [NASA ADS] [CrossRef] [Google Scholar]
- Iben, I. J., & Tutukov, A. V. 1984, ApJS, 54, 335 [NASA ADS] [CrossRef] [Google Scholar]
- Johnson, C., Green, E., Wallace, S., et al. 2014, ASP Conf. Ser., 481, 153 [NASA ADS] [Google Scholar]
- Kawka, A., Vennes, S., Schmidt, G. D., Wickramasinghe, D. T., & Koch, R. 2007, ApJ, 654, 499 [NASA ADS] [CrossRef] [Google Scholar]
- Kawka, A., Vennes, S., O’Toole, S., et al. 2015, MNRAS, 450, 3514 [Google Scholar]
- Kilkenny, D., Heber, U., & Drilling, J. S. 1988, South Afr. Astron. Obs. Circ., 12, 1 [NASA ADS] [Google Scholar]
- Kilkenny, D., Marang, F., & Menzies, J. W. 1994, MNRAS, 267, 535 [NASA ADS] [CrossRef] [Google Scholar]
- Kilkenny, D., Koen, C., O’Donoghue, D., & Stobie, R. S. 1997a, MNRAS, 285, 640 [Google Scholar]
- Kilkenny, D., O’Donoghue, D., Koen, C., Stobie, R. S., & Chen, A. 1997b, MNRAS, 287, 867 [NASA ADS] [CrossRef] [Google Scholar]
- Kilkenny, D., Billères, M., Stobie, R. S., et al. 2002, MNRAS, 331, 399 [NASA ADS] [CrossRef] [Google Scholar]
- Kilkenny, D., Stobie, R. S., O’Donoghue, D., et al. 2006, MNRAS, 367, 1603 [CrossRef] [Google Scholar]
- Kilkenny, D., O’Donoghue, D., Crause, L., et al. 2009, MNRAS, 396, 548 [NASA ADS] [CrossRef] [Google Scholar]
- Kilkenny, D., Koen, C., & Worters, H. 2010, MNRAS, 404, 376 [NASA ADS] [Google Scholar]
- Kilkenny, D., O’Donoghue, D., Worters, H. L., et al. 2015, MNRAS, 453, 1879 [NASA ADS] [CrossRef] [Google Scholar]
- Kilkenny, D., Worters, H. L., O’Donoghue, D., et al. 2016, MNRAS, 459, 4343 [Google Scholar]
- Kilkenny, D., Worters, H. L., & Østensen, R. H. 2017, MNRAS, 467, 3963 [NASA ADS] [Google Scholar]
- Kilkenny, D., Worters, H. L., & Lynas-Gray, A. E. 2019, MNRAS, 485, 4330 [NASA ADS] [CrossRef] [Google Scholar]
- Koen, C. 2007, MNRAS, 377, 1275 [NASA ADS] [CrossRef] [Google Scholar]
- Koen, C., Kilkenny, D., O’Donoghue, D., van Wyk, F., & Stobie, R. S. 1997, MNRAS, 285, 645 [NASA ADS] [CrossRef] [Google Scholar]
- Koen, C., O’Donoghue, D., Kilkenny, D., Stobie, R. S., & Saffer, R. A. 1999, MNRAS, 306, 213 [CrossRef] [Google Scholar]
- Lamontagne, R., Demers, S., Wesemael, F., Fontaine, G., & Irwin, M. J. 2000, AJ, 119, 241 [Google Scholar]
- Latour, M., Green, E. M., & Fontaine, G. 2019, A&A, 623, L12 [NASA ADS] [CrossRef] [EDP Sciences] [Google Scholar]
- Lei, Z., Zhao, J., Németh, P., & Zhao, G. 2019, ApJ, 881, 135 [NASA ADS] [CrossRef] [Google Scholar]
- Luo, Y.-P., Németh, P., Liu, C., Deng, L.-C., & Han, Z.-W. 2016, ApJ, 818, 202 [NASA ADS] [CrossRef] [Google Scholar]
- Mackebrandt, F., Schuh, S., Silvotti, R., et al. 2020, A&A, 638, A108 [NASA ADS] [CrossRef] [EDP Sciences] [Google Scholar]
- McCook, G. P., & Sion, E. M. 1987, ApJS, 65, 603 [NASA ADS] [CrossRef] [Google Scholar]
- Menzies, J., & Marang, F. 1986, in Instrumentation and Research Programmes for Small Telescopes, eds. J. Hearnshaw, & P. Cottrell (Dordrecht: Reidel), Proceedings of the International Astronomical Union Symposium No. 118, 305 [CrossRef] [Google Scholar]
- Miller Bertolami, M. M., Althaus, L. G., Unglaub, K., & Weiss, A. 2008, A&A, 491, 253 [NASA ADS] [CrossRef] [EDP Sciences] [Google Scholar]
- Miller Bertolami, M. M., Battich, T., Córsico, A. H., Althaus, L. G., & Wachlin, F. C. 2022, MNRAS, 511, L60 [NASA ADS] [CrossRef] [Google Scholar]
- Moehler, S., de Boer, K. S., & Heber, U. 1990, A&A, 239, 265 [NASA ADS] [Google Scholar]
- Németh, P., Kawka, A., & Vennes, S. 2012, MNRAS, 427, 2180 [Google Scholar]
- O’Donoghue, D., Lynas-Gray, A. E., Kilkenny, D., Stobie, R. S., & Koen, C. 1997, MNRAS, 285, 657 [CrossRef] [Google Scholar]
- O’Donoghue, D., Koen, C., Lynas-Gray, A. E., Kilkenny, D., & van Wyk, F. 1998, MNRAS, 296, 306 [CrossRef] [Google Scholar]
- O’Donoghue, D., Kilkenny, D., Koen, C., et al. 2013, MNRAS, 431, 240 [CrossRef] [Google Scholar]
- Oreiro, R., Østensen, R. H., Green, E. M., & Geier, S. 2009, A&A, 496, 827 [NASA ADS] [CrossRef] [EDP Sciences] [Google Scholar]
- Østensen, R. H. 2012, ASP Conf. Ser., 452, 233 [Google Scholar]
- Østensen, R. H., Oreiro, R., Solheim, J. E., et al. 2010, A&A, 513, A6 [NASA ADS] [CrossRef] [EDP Sciences] [Google Scholar]
- Østensen, R. H., Jeffery, C. S., Saio, H., et al. 2020, MNRAS, 499, 3738 [Google Scholar]
- Preece, H. P., Hamers, A. S., Battich, T., & Rajamuthukumar, A. S. 2022, MNRAS, 517, 2111 [NASA ADS] [CrossRef] [Google Scholar]
- Ramsay, G., & Hakala, P. 2005, MNRAS, 360, 314 [NASA ADS] [CrossRef] [Google Scholar]
- Ramsay, G., Napiwotzki, R., Hakala, P., & Lehto, H. 2006, MNRAS, 371, 957 [NASA ADS] [CrossRef] [Google Scholar]
- Randall, S., van Grootel, V., Fontaine, G., Charpinet, S., & Brassard, P. 2009, A&A, 507, 911 [NASA ADS] [CrossRef] [EDP Sciences] [Google Scholar]
- Randall, S. K., Fontaine, G., Charpinet, S., et al. 2006, ApJ, 648, 637 [NASA ADS] [CrossRef] [Google Scholar]
- Randall, S. K., Calamida, A., Fontaine, G., Bono, G., & Brassard, P. 2011, ApJ, 737, L27 [NASA ADS] [CrossRef] [Google Scholar]
- Randall, S. K., Fontaine, G., Geier, S., Van Grootel, V., & Brassard, P. 2014, A&A, 563, A79 [NASA ADS] [CrossRef] [EDP Sciences] [Google Scholar]
- Reed, M., Armbrecht, E., Telting, J., et al. 2018, MNRAS, 474, 5186 [NASA ADS] [CrossRef] [Google Scholar]
- Reed, M. D., Kilkenny, D., O’Toole, S., et al. 2012, MNRAS, 421, 181 [NASA ADS] [Google Scholar]
- Reed, M. D., Telting, J. H., Ketzer, L., et al. 2019, MNRAS, 483, 2282 [NASA ADS] [Google Scholar]
- Reed, M. D., Yeager, M., Vos, J., et al. 2020, MNRAS, 492, 5202 [Google Scholar]
- Reindl, N., Geier, S., Kupfer, T., et al. 2016, A&A, 587, A101 [NASA ADS] [CrossRef] [EDP Sciences] [Google Scholar]
- Rodríguez-López, C., Ulla, A., & Garrido, R. 2007, MNRAS, 379, 1123 [CrossRef] [Google Scholar]
- Sahoo, S. K., Baran, A. S., Heber, U., et al. 2020a, MNRAS, 495, 2844 [Google Scholar]
- Sahoo, S. K., Baran, A. S., Sanjayan, S., & Ostrowski, J. 2020b, MNRAS, 499, 5508 [Google Scholar]
- Saio, H., & Jeffery, C. S. 2019, MNRAS, 482, 758 [NASA ADS] [CrossRef] [Google Scholar]
- Saio, H., & Jeffery, C. S. 2000, MNRAS, 313, 671 [NASA ADS] [CrossRef] [Google Scholar]
- Saio, H., & Jeffery, C. S. 2002, MNRAS, 333, 121 [CrossRef] [Google Scholar]
- Schuh, S., Huber, J., Dreizler, S., et al. 2006, A&A, 445, L31 [NASA ADS] [CrossRef] [EDP Sciences] [Google Scholar]
- Smith, B. A., Barlow, B. N., Rosenthal, B., Hermes, J. J., & Schaffenroth, V. 2022, ApJ, 939, 57 [NASA ADS] [CrossRef] [Google Scholar]
- Stroeer, A., Heber, U., Lisker, T., et al. 2007, A&A, 462, 269 [NASA ADS] [CrossRef] [EDP Sciences] [Google Scholar]
- Van Grootel, V., Charpinet, S., Fontaine, G., Brassard, P., & Green, E. M. 2014, ASP Conf. Ser., 481, 115 [NASA ADS] [Google Scholar]
- Vennes, S., Kawka, A., & Németh, P. 2011, MNRAS, 410, 2095 [NASA ADS] [Google Scholar]
- Webbink, R. F. 1984, ApJ, 277, 355 [NASA ADS] [CrossRef] [Google Scholar]
- Woudt, P. A., Kilkenny, D., Zietsman, E., et al. 2006, MNRAS, 371, 1497 [NASA ADS] [CrossRef] [Google Scholar]
- Zong, W., Charpinet, S., & Vauclair, G. 2016, A&A, 594, A46 [NASA ADS] [CrossRef] [EDP Sciences] [Google Scholar]
All Tables
All Figures
|
Fig. 1. Amplitude spectra of the targets observed in the SC mode. Left panels: frequency range, up to twice the Nyquist frequency. The arrows point at the Nyquist frequency of 4166.67 μHz. Right panels: close-ups at the detected frequencies. |
| In the text | |
|
Fig. 2. TESS data of TIC 754255960. Top panel: light curve derived from the Full Frame Images taken in Sector 33. Bottom panel: amplitude spectrum calculated from the light curve sampled at 30 min. The horizontal line denotes the detection threshold at 4.5 times the median noise level in a residual amplitude spectrum (with two significant peaks removed). |
| In the text | |
|
Fig. 3. Phase-folded light curve of TIC 142200764 showing a reflection effect. The number in the upper right corner is the orbital period, rounded to two significant digits, used for folding the light curve. |
| In the text | |
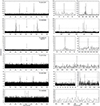 |
Fig. 4. Same as in Fig. 1, but for another six targets observed only in the SC mode. |
| In the text | |
|
Fig. 5. Amplitude spectrum of TIC 366656123. Top panel: close-up of the amplitude spectrum showing a high frequency in the sub-Nyquist region. Solid and dashed lines represent Sectors 34 and 44, respectively. Middle panel: Nyquist-frequency region. The arrows point at the Nyquist frequency in Sectors 34 and 44. Bottom panel: close-up of the amplitude spectrum showing a high frequency in the super-Nyquist region. |
| In the text | |
|
Fig. 6. Amplitude spectra of targets observed in the USC mode. Left panels: frequency range up to the Nyquist frequency. Right panels: close-ups at the detected frequencies. |
| In the text | |
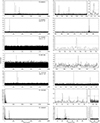 |
Fig. 7. Same as in Fig. 6, but for another seven targets observed in the USC mode. |
| In the text | |
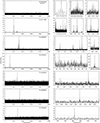 |
Fig. 8. Same as in Fig. 6 but for another seven targets observed in the USC. |
| In the text | |
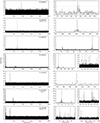 |
Fig. 9. Same as in Fig. 6, but for another seven targets observed in the USC mode. |
| In the text | |
|
Fig. 10. Phase-folded light curve of TIC 409644971 showing a reflection effect. The number in the upper right corner is the orbital period, rounded to two significant digits, used for folding the light curve. |
| In the text | |
|
Fig. 11. Phase-folded light curve of TIC 436579904 showing a reflection effect. The number in the upper right corner is the orbital period, rounded to two significant digits, used for folding the light curve. |
| In the text | |
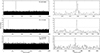 |
Fig. 12. Same as in Fig. 6, but for another three targets observed in the USC mode. |
| In the text | |
Current usage metrics show cumulative count of Article Views (full-text article views including HTML views, PDF and ePub downloads, according to the available data) and Abstracts Views on Vision4Press platform.
Data correspond to usage on the plateform after 2015. The current usage metrics is available 48-96 hours after online publication and is updated daily on week days.
Initial download of the metrics may take a while.