Fig. 4.
Download original image
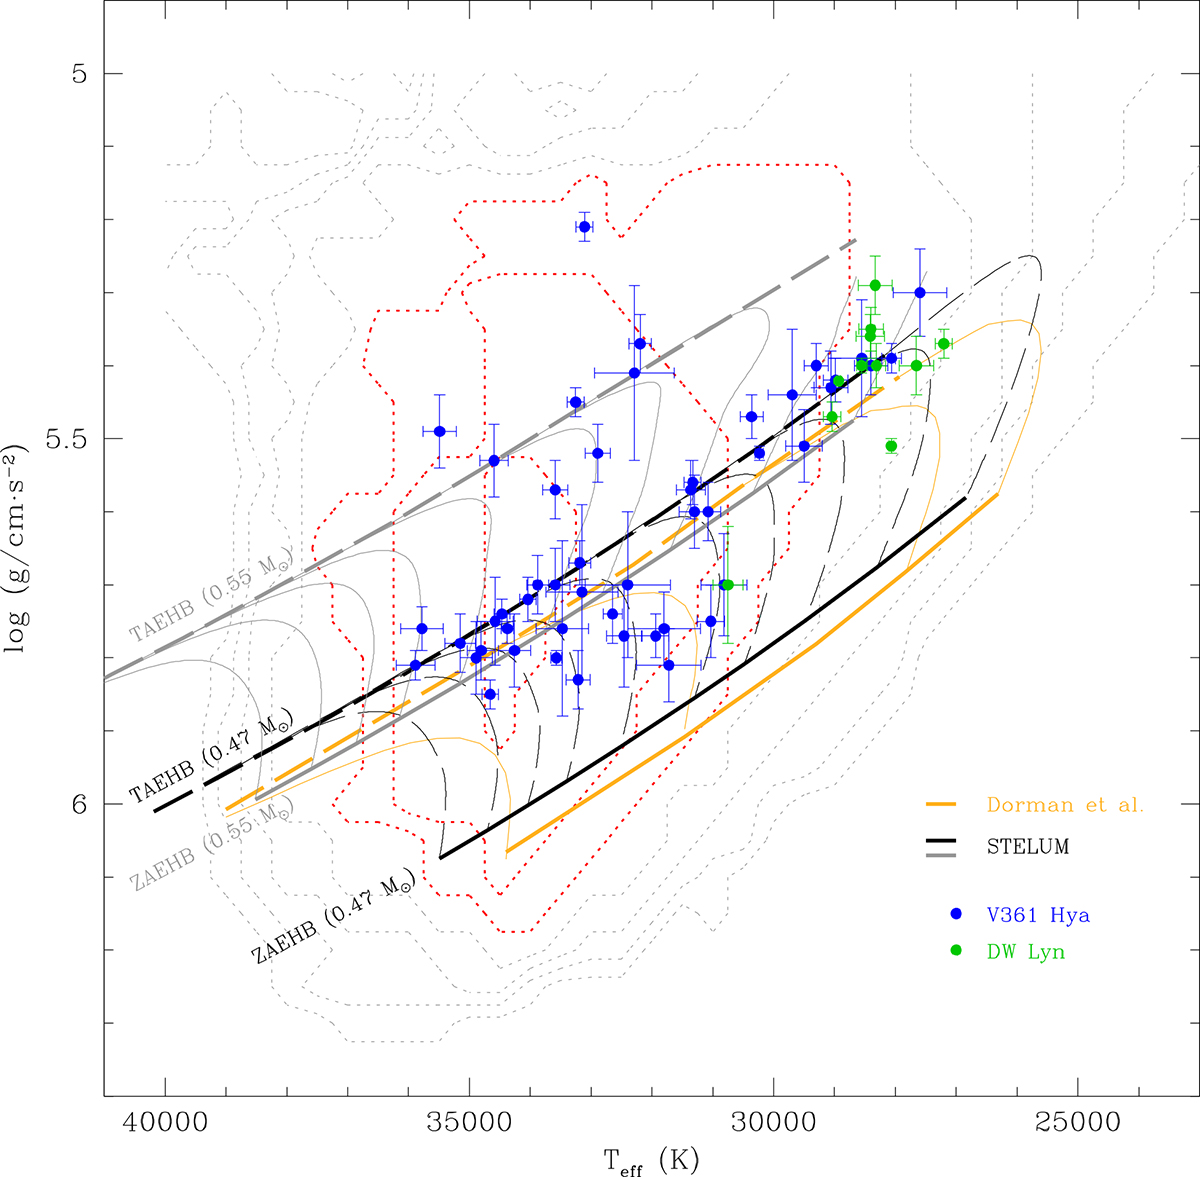
Distribution in the surface gravity (log g) – effective temperature (Teff) plane of the hot subdwarf stars observed by TESS throughout cycle 1–4 and displaying p-mode pulsations. Pure p-mode pulsators (V361 Hya stars) are represented as blue dots. Hybrid pulsators also featuring g-modes (DW Lyn stars) are shown as green dots. Superimposed to this sample, the ZAEHB and TAEHB positions are indicated for an assumed core mass of 0.47 M⊙ (black curves) and 0.55 M⊙ (grey curves), illustrating how the EHB location depends on stellar mass. The models that materialize the EHB tracks are computed with the STELUM code for the specified core mass and varying envelope masses such as D(H) ≡ log[Menv/Mcore + Menv)] = –6.0, –5.0, –4.5, –4.0, –3.5, –3.0, –2.75, –2.5, –2.25, and –2.0, from high to low Teff. These models incorporate in their envelope nonuniform iron abundance profiles derived from equilibrium between radiative levitation and gravitational settling (see text for details). For comparison purposes, typical 0.47 M⊙ tracks assuming solar uniform envelope composition are also represented (yellow curves; Charpinet et al. 2000; Dorman et al. 1993). Dotted-line contours in the background represent the predicted number of excited ℓ = 0 p-modes from non-adiabatic pulsation calculations as a proxy of the κ-mechanism efficiency (Charpinet et al. 2001). The three innermost contours (highlighted in red) delineate the region of the log g–Teff plane where the driving of p-modes is the strongest.
Current usage metrics show cumulative count of Article Views (full-text article views including HTML views, PDF and ePub downloads, according to the available data) and Abstracts Views on Vision4Press platform.
Data correspond to usage on the plateform after 2015. The current usage metrics is available 48-96 hours after online publication and is updated daily on week days.
Initial download of the metrics may take a while.