Fig. 3.
Download original image
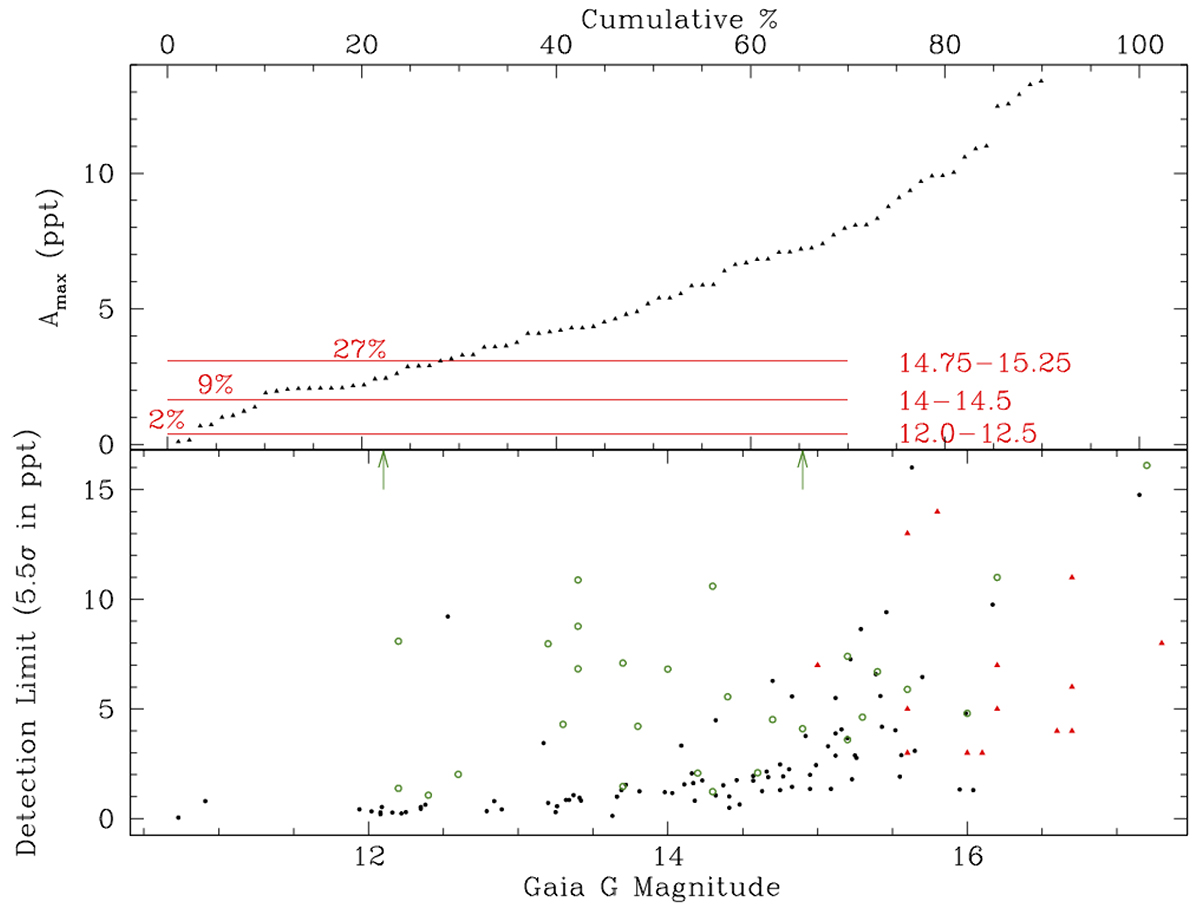
Tests of detection completeness. Bottom panel: Black circles indicate single-sector detection limits of p-mode sdBV stars observed by TESS. Green circles and red triangles are not detection limits, but Amax for stars listed in Østensen et al. (2010a) that were observed by TESS. The green circles indicate stars in which pulsations were detected (amplitudes from TESS data), while red triangles indicate stars in which pulsations were not detected by TESS, Østensen et al. (amplitudes as listed in 2010a). Green arrows indicate the stars TIC 90960668 and TIC 88565376, which have amplitudes too high to appear in this figure. Top panel: Amax of p-mode sdBV stars (black triangles) detected by TESS from low to high amplitude. The red lines indicate detection limits for those magnitude ranges and what fraction of detected sdBV stars would be undetected based on Amax.
Current usage metrics show cumulative count of Article Views (full-text article views including HTML views, PDF and ePub downloads, according to the available data) and Abstracts Views on Vision4Press platform.
Data correspond to usage on the plateform after 2015. The current usage metrics is available 48-96 hours after online publication and is updated daily on week days.
Initial download of the metrics may take a while.