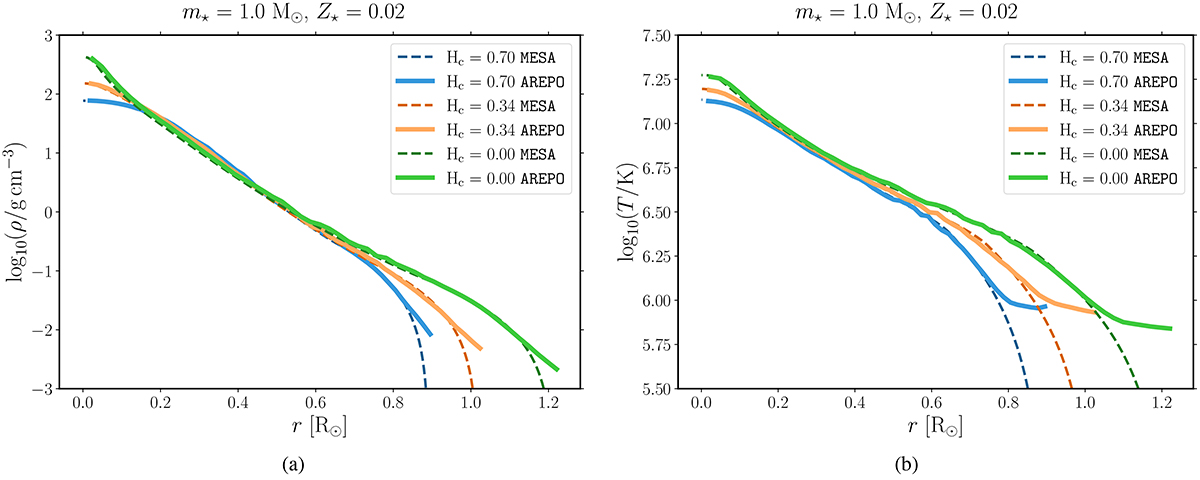
Fig. 1.
Download original image
Density (left) and temperature (right) profiles of a 1 M⊙ MS star of different models (see Table 1). The dashed and solid lines represent the 1D profiles generated by MESA and initialized (and subsequently relaxed for five dynamical timescales) in 3D in AREPO, respectively. They agree very well over most of the range, except close to the stellar surface because of smoothing during relaxation in AREPO. An older MS star (with lower Hc) has a denser and hotter core and a puffier outer layer than a younger MS star (with higher Hc).
Current usage metrics show cumulative count of Article Views (full-text article views including HTML views, PDF and ePub downloads, according to the available data) and Abstracts Views on Vision4Press platform.
Data correspond to usage on the plateform after 2015. The current usage metrics is available 48-96 hours after online publication and is updated daily on week days.
Initial download of the metrics may take a while.