| Issue |
A&A
Volume 685, May 2024
|
|
|---|---|---|
| Article Number | A114 | |
| Number of page(s) | 20 | |
| Section | Planets and planetary systems | |
| DOI | https://doi.org/10.1051/0004-6361/202347737 | |
| Published online | 15 May 2024 | |
Thermal processing of primordial pebbles in evolving protoplanetary disks
1
Department of Astronomy, University of Michigan,
323 West Hall, 1085 S. University Avenue,
Ann Arbor,
MI 48109,
USA
e-mail: mjcolmen@umich.edu
2
Center for Star and Planet Formation and Natural History Museum of Denmark, Globe Institute, University of Copenhagen,
Øster Voldgade 5-7,
1350
Copenhagen,
Denmark
3
Lund Observatory, Department of Astronomy and Theoretical Physics, Lund University,
Box 43,
22100
Lund,
Sweden
Received:
16
August
2023
Accepted:
6
February
2024
During protoplanetary disk formation, dust grains located in the outer disk retain their pristine icy composition, while solids in the inner stellar-heated disk undergo volatile loss. This process may have left a fossil record in Solar System material, showing different nucleosynthetic imprints that have been attributed to different degrees of thermal processing. However, it remains unclear how a large mass fraction of thermally processed inner-disk pebbles is produced and how these grains are subsequently transported throughout the disk. In this work, we numerically investigate the evolution in time of a two-component pebble disk consisting of both pristine pebbles and those that underwent ice sublimation. We find that stellar outbursts exceeding 1000 times the solar luminosity are efficient in thermally altering, through ice sublimation, a large mass fraction of pebbles (around 80%). After the establishment of this initial radial dust composition gradient throughout the disk, the subsequent mixing and inward drift of pristine outer-disk pebbles alter the inner disk bulk composition from processed to more unprocessed in time. Therefore, if processed pebbles without ice mantles have an isotopic composition similar to ureilite meteorites from the inner Solar System, inner-disk minor bodies forming from the early pebble flux (<1 Myr) will be isotopically ureilite-like, while later-formed bodies will be increasingly admixed with the signature of the lateincoming, CI chondrite-like unprocessed pebbles. This appears to be largely consistent with the trend seen between the accretion age of different meteoric classes and their different stable isotope composition anomalies (in μ54Cr, μ48Ca, μ30Si, and μ58Ni), but further work may be needed to explain the role of isotopically anomalous refractory inclusions and anomaly trends in other elements. Our findings further support an early thermal processing of ice mantles via stellar outbursts that are common around young Sun-like stars.
Key words: meteorites, meteors, meteoroids / minor planets, asteroids: general / planets and satellites: composition / planets and satellites: formation / protoplanetary disks
© The Authors 2024
 Open Access article, published by EDP Sciences, under the terms of the Creative Commons Attribution License (https://creativecommons.org/licenses/by/4.0), which permits unrestricted use, distribution, and reproduction in any medium, provided the original work is properly cited.
This article is published in open access under the Subscribe to Open model. Subscribe to A&A to support open access publication.
1 Introduction
Young stars are surrounded by protoplanetary disks that form as an outcome of the collapse of dense molecular cloud cores. Such disks are composed of a dominant hydrogenand helium gas component and a minor solid dust component that makes up only roughly one percent of the total mass. These solid particles efficiently grow to millimeter sizes, as observed in the protoplanetary disk survey of star-forming regions by the Atacama Large Millimeter Array (ALMA; Ansdell et al. 2016; Andrews et al. 2018; Tychoniec et al. 2020). The main mechanism that limits the size of these pebbles is believed to be collisional fragmentation, which occurs for millimeter-sized particles at characteristic collision velocities of 1-10 m s−1 (Blum & Wurm 2008; Musiolik & Wurm 2019). Pebbles in this size range also experience angular momentum loss due to gas drag, which causes them to spiral inward within disk lifetimes of a few megayears (Weidenschilling 1977). Disks are typically formed with hundreds of Earth masses in pebbles, but this mass budget decreases to less than an Earth mass after several megayears, consistent with fragmentation-limited pebble drift (Brauer et al. 2008; Birnstiel et al. 2010; Appelgren et al. 2023).
It is not well understood how large-scale pebble drift affected the composition of minor bodies and rocky planets in the Solar System. Measurements of the isotopic signature of meteorites show a clear distinction between the so-called carbonaceous (CC) and non-carbonaceous (NC) meteorite groups. This CC group is often related to more volatile-rich outer-disk parent bodies, similar to the pristine solar-like Ivuna-type carbonaceous chondrites (CIs). It carries a neutron-rich isotopic signature for elements such as Cr, Ca, Ti, and Si (Trinquier et al. 2007; Warren 2011; Schiller et al. 2018; Kruijer et al. 2020; Onyett et al. 2023). In contrast, the NC group is assumed to sample more volatile-depleted bodies originating from the inner Solar System. This group is paired with an opposing isotopic imprint, which is neutron poor for these elements. However, groups such as ordinary chondrites (OCs), typically classified as NC, are close to intermediate in the NC–CC isotope space, and therefore it may be more accurate to speak of a gradient than a true isotopic dichotomy (Onyett et al. 2023, see also our Sec. 4). Moreover, there is a third isotopically distinct group consisting of early-formed highly refractory inclusions in meteorites, the so-called Ca–Al-rich inclusions (CAIs) and amoeboid olivine aggregates (AOAs). Intriguingly, their isotopic composition is far more neutron enriched compared to the CC group, including CIs, in elements such as Cr and Ti (Trinquier et al. 2009). It is currently not clear if this implies that (i) the CC group should be seen as an isotopic mixture of NC and precursor material of CAIs and AOAs (Nanne et al. 2019), (ii) that the NC group should be seen as processed material that lost a neutron-rich component to CAI or AOA-like material (Trinquier et al. 2009), or (iii) that neither of these interpretations are fully correct. In any case, it does appear that (fragments of) these refractory inclusions, or isotopically similar material, were radially well spread and included in both NC and CC groups, including even in CI-like parent bodies such as Ryugu (Kawasaki et al. 2022). More in-depth reviews on the nucleosynthetic isotope compositions of meteorites can be found in Qin & Carlson (2016), Dauphas & Schauble (2016), Kleine et al. (2020), and Kruijer et al. (2020).
The existence of bodies with such distinct isotopic compositions has been interpreted to indicate either a spatial separation (an initial radial isotopic gradient that was maintained during disk evolution by somehow halting pebble drift) or a temporal evolution (a change in time of the composition of solids available for planet formation). The latter view appears to be supported by the evolving isotope composition in the terrestrial region, as traced by the refractory elements 48Ca and 30Si (Schiller et al. 2018; Onyett et al. 2023). Alternatively, it has been proposed that the presence of Jupiter spatially separated inner and outer disk reservoirs for a couple million years (Van Kooten et al. 2016; Kruijer et al. 2017; Alibert et al. 2018), which may be unlikely given the efficient transport of pebble fragments across planetary gaps (Stammler et al. 2023; Kalyaan et al. 2023).
These different views are linked to how we understand the formation of the Earth and the other terrestrial planets because their isotopic composition is the cumulative product of the accreted pebbles and planetesimals in the terrestrial-planet-forming zone (Lichtenberg et al. 2021; Johansen et al. 2021). A substantial contribution to Earth of late-accreted CC-like material with outer disk origins would favor the temporal evolution case. Studies tracing the refractory elements 48Ca and 30Si, major planetary components, allow for a substantial 30% CC mass fraction contribution to the Earth and approximately 10% for Mars (Schiller et al. 2018; Onyett et al. 2023), broadly in agreement with earlier work based on Cr and Ti isotopic anomalies (Warren 2011). Recent works exploring the isotope anomalies of more volatile elements, K (Nie et al. 2023) and Zn (Steller et al. 2022; Savage et al. 2022; Martins et al. 2023), generally argue for a lower CC contribution for the Earth, around 10%. When considering the s-process elements Zr and Mo, Burkhardt et al. (2021) argue that the Earth may have formed shielded from outer disk material and instead invoke a contribution from now lost, and thus un-sampled, inner-disk material. However, as argued in Onyett et al. (2023), Mo and other elements with a strong s-process component were likely modified by thermal processing during the accretion process. Finally, Dauphas et al. (2024) argue for a CI mass fraction for Earth below 10%, assuming an enstatite chondrite (EC) composition for the Earth, but this seems in tension with, for example, the 54Fe isotope composition (Schiller et al. 2020) and the positive 100Ru isotope anomaly of early Earth (Fischer-Gödde et al. 2020). Taken together, these findings illustrate the current debate regarding the origin and the possible subsequent mixing of the different isotopic reservoirs that are important for understanding mass transport and planet formation in the early Solar System.
Recently, Liu et al. (2022) presented a scenario in which a temporal evolution of the isotopic composition of the inner disk is consistent with pebble drift in a viscously expanding protoplanetary disk. Outer-disk pebbles initially move outward along with the gas and only later drift inward as the gas disk gets depleted. This causes a significant delay in the arrival of CC material into the inner region of the disk. Particles, limited in size by fragmentation, that are outside 30 AU only reach the terrestrial region after 2 Myr. As such, a too early pollution of the inner NC reservoir is avoided. After this time, CCs form in the outer regions of the disk, and the terrestrial planets can accrete their CC signature from inward drifting pebbles. A benefit of this scenario is that it allows for Jupiter to migrate inward after starting its accretion in a wide orbit. This is in contrast to the proposed in situ formation proposed in previous works (Kruijer et al. 2017; Nanne et al. 2019), where a non-migrating Jupiter would form an early gap in the gas distribution, blocking the drift of solids into the inner disk. Liu et al. (2022) argue that this would effectively deplete the NC reservoir quickly, which seems difficult to reconcile with a late-accreted CC imprint on the Earth. Alternatively, if the gap is less efficient in blocking inward drifting pebbles, CC material would drift through the gap and mix in the inner disk with the NC solids, in tension with the presence of relatively late-formed (~1.5 Myr) OCs.
It is believed that the different inner and outer isotopic reservoirs must have already been present early in the evolution of the solar nebula. One possibility is that the isotopic heterogeneity was passed down from an inefficiently mixed pre-solar molecular cloud onto the evolving disk (Dauphas et al. 2002a; Nanne et al. 2019). Specifically, Nanne et al. (2019) propose that an initial CAI-like disk was polluted by later NC infalling material. This second component would need to be accreted with low angular momentum to prevent an NC outer disk. In the final step, the authors speculate that an epoch of extreme outward viscous transport may then create a CI-like outer disk that is a mixture of a CAIs and NCs. However, this scenario is difficult to reconcile with numerical simulations that show that gas within an individual pre-stellar core appears to be very well mixed (Kuffmeier et al. 2016) and that material later accreted onto a disk generally has a higher angular momentum (Hueso & Guillot 2005; Kuffmeier et al. 2023). Moreover, gas and solids within the CAI formation zone would be in a disk region that is rapidly accreting inward (Zhu et al. 2024). Alternatively, as we explore more in this work, a thermal processing event in the disk could have favored the sublimation of the thermally unstable component of the solid grains, creating a relative depletion of CI-like material in the inner disk and thereby creating the observed dichotomy (Trinquier et al. 2009; Van Kooten et al. 2016; Ek et al. 2020; Schiller et al. 2015).
The mechanisms most commonly attributed to thermal processing events are the episodic accretion outbursts observed in young T Tauri stars, such as FU Orionis. The luminosity of these young stars can abruptly increase by up to a factor of 1000 on timescales of tens to hundreds of years (Hartmann & Kenyon 1996). During the outburst, disk accretion rates peak as high as 10−4 M⊙ yr−1 (Zhu et al. 2007). Observations indicate that there is a tendency for outbursts to occur when disks are massive (Mdisk ≍ 0.011–0.38 M⊙) and have relatively compact radii (Rdisk ≍ 16–69 AU, Kóspál et al. 2021). Nearly all young Sun-like stars are estimated to undergo an outburst phase during their Class I stages and, less frequently, during Class II stages (Scholz et al. 2013; Contreras Peña et al. 2019).
A wide range of mechanisms have been considered to explain the event that triggers the outbursts. Possible internal triggers include a gravitational fragmentation within the disk followed by the inward migration of the disk fragments (Vorobyov & Basu 2005; Dunham & Vorobyov 2012). Alternatively, the activation of the magnetorotational instability (MRI) in the inner disk, due to gravitational instabilities in the outer disk, could induce the rapid transport of great amounts of material onto the star (Zhu et al. 2009). In some cases, the outbursts are also thought to be products of external interactions with the late infall of gas from the molecular cloud onto the protoplanetary disk (Kuffmeier et al. 2018) or with other stellar companions, such as a binary (Reipurth & Aspin 2004). It is not clear which of these mechanisms dominates the stellar outburst activity, nor how they are potentially related to each other.
Several works have investigated the impact that stellar outbursts have on the solids present in protoplanetary disks. During outbursts the sublimation lines of different volatile species, such as water, carbon monoxide, and complex organic molecules, move significantly outward (Banzatti et al. 2015). For example, in the case of the 1.3 solar-mass protostar V883 Ori, an outburst with a stellar luminosity of L ≍ 200 L⊙ displaced the water ice line out to 42–80 AU (Cieza et al. 2016; Tobin et al. 2023). Displacement of the ice lines also affects the CO ice sublimation and chemistry in the outer disk of young protostars (Visser & Bergin 2012; Jørgensen et al. 2015). Additionally, more refractory dust can be affected: recent observations with the James Webb Space Telescope (JWST) of EX Lup strongly support a post-outburst, outward transport of thermally processed inner-disk dust grains (crystalline forsterite grains) to regions beyond 3 AU (Kóspál et al. 2023). Finally, in the Solar System, stellar outbursts may explain the depletion of refractory carbon in the terrestrial region with respect to cometary values (Binkert & Birnstiel 2023) and have been linked to the depletion of moderately volatile elements in carbonaceous chondrites (Hubbard & Ebel 2014; Li et al. 2020, 2023). Johansen & Dorn (2022) argued that the condensation of solids after an outburst leads to the formation of iron-rich planetesimals in the inner disk, potentially explaining the iron-rich composition of Mercury.
In this study, we assume that our Sun underwent outburst events during its formation. Our aim is to explore the long-term effect on the solid component after the last major event that thermally processed a significant fraction of the pebble reservoir, while remaining agnostic on the exact mechanism that triggered the outburst in the first place. We focus on the evolution in time of two radially separated solid species. For simplicity, we assume the inner solid species is thermally processed and carries the NC imprint. Unfortunately, it is not yet well understood how exactly thermal processing alters the composition of primordial material via the selective removal of, possibly unknown, isotopically anomalous carrier species. However, although the precise process is unclear, it appears from Liu et al. (2022) that a large fraction of the material has to be processed, out to distances of 10 AU, during or soon after the formation of the protoplanetary disk. Therefore, we considered FU Orionis outbursts that can heat the disk up to tens of AU away and concentrated on the subsequent evolution of the pebble populations in the disk that were initially separated by the water ice line.
The paper is structured as follows. In Sec. 2, we describe the initial setup for the disk evolution and pebble population, as well as the considerations taken for its thermal processing. We describe how we ran our simulations for four different initial parameters in Sec. 3. Additionally, in Sec. 4 we give the implications of our results in the context of the isotopic measurements of chondrites. In Sec. 5 we perform additional simulations to test the influence of particle size and briefly discuss the role of Jupiter in possibly reducing inward pebble drift. Finally, we present our conclusions in Sec. 6.
2 Methods
2.1 Gas disk evolution
The time evolution of the surface density of the gas, Σg, is given by the diffusion–advection equation
![$\[\frac{\partial \Sigma_{\mathrm{g}}}{\partial t}=\frac{3}{r} \frac{\partial}{\partial r}\left[r^{1 / 2} \frac{\partial}{\partial r}\left(v \Sigma_{\mathrm{g}} r^{1 / 2}\right)\right] \text {, }\]$](/articles/aa/full_html/2024/05/aa47737-23/aa47737-23-eq1.png) (1)
(1)
with r the orbital radius Pringle (1981). We adopted the disk viscosity from Shakura & Sunyaev (1973), given by
![$\[v=\alpha c_{\mathrm{s}} H.\]$](/articles/aa/full_html/2024/05/aa47737-23/aa47737-23-eq2.png) (2)
(2)
Here, cs is the sound speed, H is the scale height of the gas disk, and α is the viscosity parameter, set to α = 0.01. This high value is motivated by our aim to focus on the earliest stages of disk evolution where disks may be close to being gravitational unstable (Elbakyan et al. 2020) and the observed high accretion rates of young disks (Manara et al. 2016).
As the initial condition for the gas disk profile, we took the analytical solution for the surface density of the gas given by
![$\[\Sigma_{\mathrm{g}}=\frac{M_{\mathrm{d}, 0}}{2 \pi r_{\text {init }}^2} \frac{1}{\left(r / r_{\text {init }}\right)} e^{-\left(r / r_{\text {init }}\right)}\]$](/articles/aa/full_html/2024/05/aa47737-23/aa47737-23-eq3.png) (3)
(3)
where Md,0 represents the initial mass of the disk. Here we assumed a power-law viscosity ν ∝ rγ with γ = 1, which is valid when using Eq. (2) with Eq. (10) for the initial temperature profile (Hartmann et al. 1998). The initial radius, rinit, is the radius inside of which ≍0.6 of the total mass of the disk is initially located. To mimic the first stages of disk evolution, we started with a model of a massive and compact disk that is no longer accreting from the surrounding gas. Our model t = 0 can thus approximately be placed after the final infall stage and the end of the class I phase of disk evolution. We set the disk mass in all models to Md,0 = 0.1 M⊙, and the range of initial radii considered in our models is listed in Table 1. These initial conditions for massive and relatively compact disks are broadly consistent with disk observations of FU Orionis objects (Kóspál et al. 2021). We illustrate the evolution of the gas surface density for the Nominal model in panel a of Fig. 1.
2.2 Temperature evolution
We calculated the temperature considering the heating produced by viscous turbulence as well as the contribution from the irradiation of the central star. For the irradiated temperature, Tirr, we assumed that the star is a point-like source as done in Menou & Goodman (2004), so the irradiation temperature follows the equation
![$\[\sigma_{\mathrm{SB}} T_{\mathrm{irr}}^4=\frac{L}{4 \pi r^2} \frac{H}{r}\left(\frac{\partial \ln H}{\partial \ln r}-1\right) .\]$](/articles/aa/full_html/2024/05/aa47737-23/aa47737-23-eq4.png) (4)
(4)
Here, σSB is the Stefan-Boltzmann constant and L is the luminosity of the central star. The term (∂ ln H/∂ ln r - 1) represents the shielding factor, where we set ∂ ln H/∂ ln r to 9/7 (Hueso & Guillot 2005). We determined the equilibrium temperature of the viscous heating by balancing the cooling rate,
![$\[\Lambda_{\mathrm{rad}}=\frac{8 \sigma_{\mathrm{SB}} T_{\mathrm{vis}}^4}{3(\tau / 2+1 / \sqrt{3}+1 / 3 \tau)},\]$](/articles/aa/full_html/2024/05/aa47737-23/aa47737-23-eq5.png) (5)
(5)
with a heating rate defined by
![$\[\Gamma_{\text {vis }}=\frac{9}{4} v \Sigma \Omega^2 .\]$](/articles/aa/full_html/2024/05/aa47737-23/aa47737-23-eq6.png) (6)
(6)
Here τ is the optical depth, taken to be τ = κΣg, with κ the opacity. Combining both expressions, we find that the temperature component from the viscous turbulence in the disk is given by
![$\[T_{\mathrm{vis}}^4=\frac{27 v \Sigma_{\mathrm{g}} \Omega^2}{64 \sigma_{\mathrm{SB}}}(\tau / 2+1 / \sqrt{3}+1 / 3 \tau) .\]$](/articles/aa/full_html/2024/05/aa47737-23/aa47737-23-eq7.png) (7)
(7)
To determine the disk temperature at the midplane, Td, we calculated
![$\[T_{\mathrm{d}}^4=T_{\mathrm{irr}}^4+T_{\mathrm{vis}}^4,\]$](/articles/aa/full_html/2024/05/aa47737-23/aa47737-23-eq8.png) (8)
(8)
following Kimura et al. (2016). The sound speed relates to the midplane temperature as
![$\[c_{\mathrm{s}}^2=\frac{k_{\mathrm{B}} T_{\mathrm{d}}}{\mu m_{\mathrm{H}}} .\]$](/articles/aa/full_html/2024/05/aa47737-23/aa47737-23-eq9.png) (9)
(9)
Here, μ = 2.34 is the mean molecular weight, and mH the mass of the hydrogen atom.
We assumed a simple opacity prescription, as we kept the opacity fixed at k = 1 cm2 g−1. We implemented a maximum allowed value in the temperature distribution, which we set to Tmax = 2500 K. This is because temperatures in the inner disk are unlikely to exceed a few 103 K as solids sublimates and gas opacities start dominating (Birnstiel et al. 2010; Li et al. 2021).
When initiating the simulations, we adopted an initial temperature profile as described in Hayashi (1981),
![$\[T_{\mathrm{d}}=280\left(\frac{r}{\mathrm{AU}}\right)^{-1 / 2} \mathrm{~K} .\]$](/articles/aa/full_html/2024/05/aa47737-23/aa47737-23-eq10.png) (10)
(10)
An example of the evolution of the temperature profile including contributions from both irradiation and viscosity is shown in panel b of Fig. 1.
For those models where we include an accretion outburst (see Sec. 3.2), we modified the luminosity after the disk has converged to thermal equilibrium. Mass accretion episodes are accompanied by a rise in the accretion luminosity in the innermost disk, which effectively increases the heating from irradiation exerted onto the outer disk (Zhu et al. 2007). We did not explicitly model the accretion outburst but instead altered the stellar luminosity by adding the additional accretion luminosity, in line with other theoretical studies (Binkert & Birnstiel 2023; Houge & Krijt 2023). In practice, we altered the luminosity from Linit = 1 L⊙ to Lout = 1000 L⊙ in the nominal outburst case (see Table 1). The outburst is introduced after a time tout = 104 yr, in line with an outburst recurrence of ≍ 100 kyr in Class II young stellar objects (Contreras Peña et al. 2019), and lasts for 100 yr (Fischer et al. 2023, and references therein). This setup results in an effective water ice line excursion out to ~70 AU, in line with the observed thermal expansion seen in V883 Ori (Tobin et al. 2023). We explore different outburst timings Sec. 3.2 and lower luminosities around of 100–400 L⊙ (Audard et al. 2014) in Appendix A. For simplicity, we only considered the last major outburst, meaning that any imprint from previous smaller outbursts is lost (Li et al. 2023).
Parameters of the models studied.
2.3 Solid component evolution
We considered several pebble populations in the disk that are individually evolved according to the advection equation
![$\[\frac{\partial \Sigma_{\mathrm{p}}}{\partial t}=-\frac{1}{r} \frac{\partial}{\partial r}\left(r \Sigma_{\mathrm{p}} v_r\right) .\]$](/articles/aa/full_html/2024/05/aa47737-23/aa47737-23-eq11.png) (11)
(11)
Here Σp is the surface density of the solid component made out of pebbles, r the orbital radius and υr the radial velocity of the solid particles. This velocity has contributions from the radial movement of gas, υgas, and from drag-induced radial drift, υdrift. The radial gas velocity is given by
![$\[v_{\mathrm{r}, \mathrm{gas}}=-\frac{3}{\Sigma_{\mathrm{g}} r^{1 / 2}} \frac{\partial}{\partial r}\left(\Sigma_{\mathrm{g}} v r^{1 / 2}\right),\]$](/articles/aa/full_html/2024/05/aa47737-23/aa47737-23-eq12.png) (12)
(12)
and the drag-induced drifting velocity for the pebbles is given by (Weidenschilling 1977)
![$\[v_{\mathrm{r}, \mathrm{drift}}=-\frac{2 v_n}{\mathrm{St}+\mathrm{St}^{-1}} .\]$](/articles/aa/full_html/2024/05/aa47737-23/aa47737-23-eq13.png) (13)
(13)
Here, the Stokes number St is given by
![$\[\mathrm{St}=\frac{\pi}{2} \frac{\rho_{\mathrm{s}} R_{\mathrm{p}}}{\Sigma_{\mathrm{g}}}\]$](/articles/aa/full_html/2024/05/aa47737-23/aa47737-23-eq14.png) (14)
(14)
in the Epstein drag regime, with Rp being the particle size and ρs its density. Initially, we considered a constant particle size of Rp = 0.1 mm, consistent with the lower bounds on particle sizes inferred from the outer parts of observed protoplanetary disks (e.g., Pérez et al. 2015; Macías et al. 2021; Ohashi et al. 2023). We explore the influence of particle size in Sec. 5.1. Finally, the sub-Keplerian speed of the gas υn (Brauer et al. 2008), is given by
![$\[v_{\mathrm{n}}=-\frac{1}{2} \frac{\partial \ln P}{\partial \ln r}\left(\frac{H}{r}\right)^2 v_{\mathrm{K}},\]$](/articles/aa/full_html/2024/05/aa47737-23/aa47737-23-eq15.png) (15)
(15)
with υK the Keplerian velocity and P the pressure of the gas. Panel c of Fig. 1 shows the evolution of the solid surface density in the Nominal model, for the population of unprocessed solids (see Sec. 2.4).
We do not include here additional turbulence-driven radial particle diffusion. The degree of this contribution is dependent on the physical source of turbulence, which is different than the alpha-viscosity used here only for the secular evolution of the gas disk. For example, turbulence may be highly anisotropic and largely suppressed in the dense pebble midplane layer, as is the case for turbulent motions triggered by the vertical shear instability (Flock et al. 2017; Schäfer & Johansen 2022). Furthermore, observations hint that particle stirring is low in protoplanetary disks (Jiang et al. 2024; Zagaria et al. 2023). Thus, our work can be seen as exploring the case of minimal particle stirring, while future works could explore physical-driven additional radial particle diffusion.
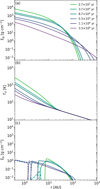 |
Fig. 1 Gas surface density, gas temperature, and pebble surface density evolution for the Nominal disk model. (a) The mass in the inner disk decreases in time due to accretion onto the central star, whereas the mass in the outer gas disk expands into wider orbits to conserve angular momentum. (b) At early times the midplane temperature inside 30 AU is dominated by viscous heating and the outer part of the disk is heated by irradiation from the central star. (c) Solid lines show the distribution of the unprocessed pebbles that are located behind the water ice line (see Sec. 2.4). After ~1 Myr the inner surface density increases since a fraction of these solids moves inward due to radial drift. These pebbles subsequently sublimate at the water evaporation evaporation front now located near approximately 1 AU. The surface density of this vapor component is shown with the dashed lines. |
2.4 Initial populations and sublimation
We explored how the early thermal processing influences the composition of pebbles and how their movement affects the final compositions of planetary and meteoritic bodies in the disk. For simplicity, we assumed two different pebble populations: unprocessed and processed pebbles (indicated with subscripts up and p henceforth).
Unprocessed (up) material has never experienced temperatures above the water sublimation point. We took a fixed sublimation temperature for water Tsub,up = 160 K (Ros & Johansen 2013).
Processed (p) solids have experienced temperatures between the water sublimation temperature and the temperature at which solid refractory materials get altered. For this latter temperature, we took the sublimation temperature of a representative refractory element, Si, with T50,p = 1310 K. Here T50 stands for the 50% condensation temperature, where half of a given element is found in the solid state and the other half in the gas, for a solar gas mixture (Wood et al. 2019).
The two populations considered can be found in one of two states in the disk: gas or solid form. In the gas form the population follows the same dynamic behavior as the gas disk, whilst the solid component experiences radial pebble drift. When unprocessed solid material crosses the sublimation line, it gets fully sublimated at the rate
![$\[\left(\frac{\partial \Sigma_{\text {d,up }}}{\partial t}\right)_{\text {sub }}=f_{\text {sub,up }} \epsilon \Omega \Sigma_{\text {d,up }} \text {. }\]$](/articles/aa/full_html/2024/05/aa47737-23/aa47737-23-eq16.png) (16)
(16)
The term Σd,up is the surface density of the unprocessed solid component. Here ϵ is an efficiency parameter that regulates the rate of material sublimated. We simply set ϵ = 1, corresponding to sublimation on orbital timescales. When considering the desorption of monolayers of water, Piso et al. (2015) argued for lower efficiencies exceeding ϵ = 10−2 for sub-millimeter-sized grains. Our results are not sensitive to the precise choice, but long sublimation timescales, and the possible disintegration of grains, could matter in the case of short-timescale luminosity outbursts (for more detail, see Sec. 5.1). Finally, the term fsub,up describes the mass fraction that gets sublimated. We considered that for up pebbles crossing the water sublimation line, half of the pebble mass fraction (fsub,up = 0.5) is added to the p solid component. This is an ad hoc value for the amount of volatile loss, corresponding approximately to the water mass fraction of a solar composition. Smaller water mass fractions of around a third have been inferred for cometary solids (Fulle et al. 2019), but on the other hand, less volatile species could also be lost as pebbles disintegrate.
The processed material in the disk starts with all the material that has experienced T > Tsub,H2O during disk formation and is subsequently complemented by material that gets heated above that temperature during disk evolution. We did not consider recondensation of up vapor to up solid, if up vapor is advected outward across its sublimation line into a cooler zone in the disk. We found that this choice has little impact on our models and it allows for an easier interpretation of the results. With this model choice all up material are pristine solids that have never been processed during the full disk lifetime. Moreover, the actual process is complicated as condensation prefers nucleation onto small grains and is grain composition dependent (Ros & Johansen 2013). We, on the other hand, traced the solid component only via the larger pebbles that make up most of the solid mass. The processed p solids fully sublimate when crossing the silicate sublimation line. It remains only as a vapor component that is unable to re-condense onto the solid component, as explained above.
In practice, we set up the initial condition for the different pebble species in the following way. We started evolving the pebbles after 1 kyr, when the irradiation and viscous heating have reached equilibrium in the disk and the sublimation lines are at maximal radial separation. To set the initial separation radius between the processed and unprocessed solid components, we found the location in the disk where the temperature matches the T50 for water and define it as the separation radius, where everything outside it is considered to be unprocessed pebbles and inside it is processed pebbles.
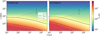 |
Fig. 2 Temperature structure evolution for the (a) Nominal and (b) Compact cases. The colorbar shows the disk temperature at the midplane. The dashed gray line shows the location where the gas advection changes direction: the material inside the line is accreted onto the star and the material outside is moved outward due to the viscous expansion of the gas disk. The solid and dash-dotted lines correspond to the location of the water and silicates sublimation lines with temperatures of 160 K and 1314 K, respectively. |
3 Results
We ran simulations for a total of nine models with parameters that are given in Table 1. First we considered two models with disks that have heating contributions from both irradiation and viscosity but differ in terms of their initial radius, rinit (Sec. 3.1). The first model, the Nominal model, has an initial radius of rinit = 20 AU, while the Compact model has a smaller initial radius of rinit = 2.5 AU. The latter model is inspired by models of ultra-compact disk formation (Hennebelle et al. 2020; Morbidelli et al. 2022), which may be difficult to reconcile with views of a longer-term disk buildup, in part driven by streamers (Valdivia-Mena et al. 2022; Kuffmeier et al. 2023).
We next considered two models that follow the evolution after an accretion outburst (Sec. 3.2). In model Outburst, we include viscous heating, but we also show a case without viscous heating (Outburst-NoVisc) and varying outburst intensities (Small-outburst and Med-outburst). Finally, we also included three additional models to explore the other parameters. We modified the time at which we introduce the outburst in Appendix A (model Late-Outburst), and the amount of viscosity in Appendix B (Low-visc-alpha and Med-visc-alpha).
3.1 Nominal and compact models
3.1.1 Evolution of the disk temperature
The decrease in the surface density decreases the viscous heating, which cools the disk and makes the sublimation lines move inward. Figure 2, panel a, shows how sublimation lines move inward in the Nominal model as the surface density decreases in the region with inward accretion. This region is marked with the rυ=0-line, which describes the position where material changes advection direction from moving inward inside of the line to moving outward outside of it.
In the Compact model, a higher mass fraction of the initial disk mass is located in the inner disk with more substantial viscous heating, allowing more than 70% of the solid mass fraction of the whole disk to be thermally processed, compared to 15% in the Nominal case. The silicate line is farther from the star, at ~2 AU, as shown in panel b of Fig. 2, due to increased viscous heating in the very inner disk. However, the outer disk is less affected and therefore the initial location of the water sublimation line is located similarly around 7 AU for this more compact disk. The rv=0 line has a similar behavior in both cases, starting within 2 AU and moving outward as the disk expands with time.
3.1.2 Pebble fluxes and mass fraction of unprocessed material
We next focused on studying the effects of advection and drift in the evolution of the two pebble populations. We show the evolution of the absolute value of the pebble flux in Fig. 3. The top panels show the pebble fluxes at different radii for both the up and p components as a function of time. The bottom plots show the evolution of the mass fraction of unprocessed pebbles in relation to the total mass of solids present throughout the disk,
![$\[\chi_{\text {up }}=\frac{\Sigma_{\text {up }}}{\Sigma_{\text {up }}+\Sigma_{\text {p }}} .\]$](/articles/aa/full_html/2024/05/aa47737-23/aa47737-23-eq17.png) (17)
(17)
In the Nominal model (panel a), the processed component is constantly replenished by inward drifting unprocessed material across the water sublimation line. In this case, the rυ=0 line lays far outside of the water sublimation line, so that little processed material mixes with outer disk material. The top panel of Fig. 3 shows that the unprocessed component becomes dominant at 1 AU after 2.1 Myr and final pebbles are almost pure up.
For the Compact model in panel b, more processed material moves outward due to the initial location of the rυ=0 well within the water ice line, causing the outer disk to get more enriched with p pebbles, compared to the Nominal model. However, pebbles are lost quickly compared to the Nominal case, due to the small radial extent of the disk. After ~2 Myr there is no material left to accrete.
We conclude that neither of these scenarios are able to explain the presence of processed material outside the water ice line at late times. In the Nominal case, the terrestrial region outside 1 AU is dominated by the icy pristine up pebbles from the outer disk, because of the inefficient outward mixing of early processed material. We argue in Sec. 4 that this is in apparent conflict with the isotopic composition of meteorites, in the sense that they do not show an exclusive up-like composition, which would then correspond to a CI-like isotopic imprint.
In the compact case, more material is processed at early times and diffused outward. However, even using a high viscosity (α = 10−2), which promotes outward expansion, the pebble flux dries up well before the inferred formation times of the terrestrial planets and the undifferentiated minor bodies of the asteroid belt (this is further explored in Sec. 4). We are thus faced with the need for an alternative model where the separation of the populations is located well in the outward moving portion of the disk so that the processed material can be efficiently pushed outward.
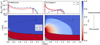 |
Fig. 3 Time evolution of the distribution of processed and unprocessed pebbles, for the Nominal case (left panels) and the Compact case (right panels). The top plots show the pebble flux evolution for the processed (red) and unprocessed (blue) pebble components at two different radii (full line 1 AU and dashed line 5 AU). The bottom panels illustrate the evolution of the mass fraction of unprocessed pebbles, following the color code of the legend, at different radii and times in the disk. In the Compact case, the processed component is more efficiently advected outward initially compared to the Nominal case. This results in more mixing with the unprocessed pebbles, but also in loosing most pebbles from the disk within already 2 Myr. |
3.2 Outburst models
FU Orionis outbursts are known to be present in the early stages of disk evolution and play a fundamental role in increasing the temperature in the outer disk. Therefore, we studied their influence on the thermal processing of solids in the disk. Although young disks are understood to undergo repeated outbursts, we limited ourselves here to modeling the last major outburst. We first introduced an outburst into a disk similar to the Nominal model described in Sec. 2.2. Then, we removed the viscous heating component, as the magnitude of this contribution is difficult to precisely determine due to its opacity dependence and assumption on vigorous MRI-driven turbulence (Nomura 2002; Bitsch et al. 2015). Under nonideal magnetohydrodynamic conditions, viscous midplane heating may be largely suppressed (Mori et al. 2019, 2021). Additionally, because the range of observed luminosities in outbursts is very wide, displaying changes between 10 and 1000 L⊙ (Hartmann & Kenyon 1996; Audard et al. 2014; Fischer et al. 2023), we explored this parameter, comparing models Small-outburst, Med-outburst, and Outburst-NoVisc with three different luminosities that cover the higher-end of the observed systems. We also explore the timing of the outburst in Appendix A.
3.2.1 Evolution of the disk temperature
We compare the temperature evolution of two outburst cases (Outburst and Outburst-NoVisc) in Fig. 4. Both panels show the same general behavior in sublimation line evolution; the sudden increase in temperature at the beginning of the outburst affects mostly the outer region of the disk. The water sublimation line moves its position drastically out to ~70 AU, while the inner sublimation lines only undergo a minor excursion. However, there are also significant differences between the two models. In model Outburst, the rυ=0 line is initially located within 0.5 AU. Subsequently, the rυ=0 line quickly moves to 10 AU in the first 10 kyr of evolution, as seen in panel a of Fig. 4, while in the Outburst-NoVisc run the rυ=0 line remains stable at approximately 10 AU during this period. In the latter case, the separation between inward and outward gas advection is located at rυ=0 ≍ rinit/2, as expected in a disk heated by irradiation only (Hartmann et al. 1998; Liu et al. 2022). However, as seen here, in disks with additional viscous heating this relation, which assumes a power-law viscosity profile, does not hold longer. The increased viscosity in the inner disk drives rυ=0 closer to the host star. Another difference is that without any viscous heating the water ice line is located well within the terrestrial region at 0.8 AU. We note that the Outburst-NoVisc model is the only case in our study where, due the lack of viscous heating, the inner disk (<0.5 AU) is heated above 1000 K only for a small fraction of time (~100 yr). Lastly, the temperatures outside ~10 AU before and after the outburst remain similar in time throughout all four cases, as they are regulated by nominal stellar irradiation.
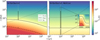 |
Fig. 4 Temperature evolution for disks that include a luminosity outburst of 1000 L⊙. Both cases have an initial disk radius of 20 AU. Panel a shows a disk that includes viscous heating, and panel b shows a disk that only has heating from irradiation. In the disk of theOutburst model (panel a), the sublimation lines move slowly inward due to the contribution from viscous heating, which eventually decreases, but the material in the inner disk of the Outburst-NoVisc model (panel b) is too cold for the silicate lines to be present. |
3.2.2 Pebble fluxes and mass fraction of unprocessed material
We next analyzed the effect of the outburst on the composition of the pebble fluxes. For the Outburst model (L = 1000 L⊙), we can see in the upper panel of Fig. 5 that the processed pebble component dominates the pebble flux until the water sublimation line crosses 1 AU at 2.1 Myr. The bottom panel also shows a high degree of mixing outside the water sublimation line, making the p-pebble composition dominate out to 100 AU within the first megayear of evolution. This is because the separation radius between the two populations, the water ice line, has been pushed outward due to the increase in heating caused by the outburst. This therefore results in a large mass fraction of 40% of all processed material located in the outward-moving section of the disk, causing p pebbles to advect outward into the unprocessed reservoir.
In Fig. 6, we show the evolution of the pebble fluxes for models without viscous heating, but with outbursts that reach up to L = 100 L⊙, 500 L⊙, and 1000 L⊙. They show a similar behavior in terms of unprocessed-processed mixing, with an initial overabundance of the p component, which gets taken over by unprocessed pebbles. The main difference between these models is how far away the ice line gets pushed outward, which in return affects how much material gets processed and the time at which the transition from p to up occurs. The heating of the disk during a strong (L = 1000 L⊙) outburst pushes the separation radius of the populations outward and proves to be an efficient way of inducing mixing in the early stages of the system. This, in turn, allows the late delivery of unprocessed material into the inner disk. This stands in contrast to the disks with weaker outbursts, where not enough material is moved out, creating an early delivery of unprocessed materials after 0.5 Myr and 1.5 Myr in the Small-outburst and Med-outburst models, respectively, as seen in panels a and b of Fig. 6.
4 Application: an evolving nucleosynthetic composition
Meteorites sample the composition of the pebble flux at different locations and times during the evolution of the Solar Nebula. This is because their parent bodies are believed to form after dense pebble swarms collapse on orbital timescales, triggered by the streaming instability (Youdin & Goodman 2005; Johansen & Youdin 2007). We assessed whether our model for the pebble flux composition can match the evolution of the nucleosynthetic composition of different meteorite classes with different accretion ages. In order to do so, we considered that the carriers of the isotopic differences between different meteorites are small pre-solar grains. We then made the key assumption that these grains are (partly) irreversibly lost during the sublimation of the icy shells on dust particles that enter inward of the water ice line during disk evolution (Fig. 7). We speculate here that, once small nanoparticles are lost from the host pebble, they are trapped below the electrostatic barrier (Okuzumi 2009) and do not efficiently re-coagulate (Matthews et al. 2012; Akimkin et al. 2023). We further discuss this assumption in Sec. 5.1.
Currently, it is not well understood which types of presolar grains are the carriers of different isotopic anomalies and how they are distributed within the precursor solids (for reviews, see Nittler & Ciesla 2016; Hoppe et al. 2022). These very small grains, nanometers to micrometers in size, can still be identified in fine-grained matrix (Floss & Haenecour 2016) and ultra-primitive clasts (Nguyen et al. 2023). However, these grains are easily destroyed in more thermally altered materials by aqueous alteration, thermal metamorphism or prolonged oxidation (Davidson et al. 2014). It is therefore complex to establish stardust abundance differences in matrix, chondrule and CAI precursor materials and it is difficult to explain the differing isotopic compositions by solely different matrix mass fractions (Qin et al. 2010, see also Sec. 4.2). Nevertheless, recent Ryugu data appear consistent with the notion that inner disk material is depleted in isotopic-anomalous stardust compared to primitive clasts that are likely tracing primitive outer disk solids (Nguyen et al. 2023).
In what follows we do not explicitly model the formation and possible outward viscous transport of the isotopically anomalous CAI and AOA that likely formed early in the evolution of the disk close to the host star (Connelly et al. 2012; Larsen et al. 2020). They are unlikely to be the sole carriers of the observed isotopic spread, due to their non-chondritic composition (e.g., Nanne et al. 2019; van Kooten et al. 2021; Hellmann et al. 2023), but their role in possible causing the observed spread of the CC group in isotope space will be discussed in Sec. 4.2. Nor did we explicitly model the formation and evolution of the highly processed chondrules found in the matrix that makes up chondrites that also show an NC-CC spread (Schneider et al. 2020).
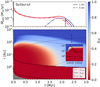 |
Fig. 5 Same as Fig. 3, but for the Outburst model. The location of the water sublimation line, which separates the processed and unprocessed pebbles and is indicated by the solid line, is located beyond the location where the gas velocity reverses (rH2O > rυ=0), indicated by the dashed line, at the time of the outburst. As a result, we see substantial mixing of both up and p pebbles even at late times. |
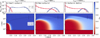 |
Fig. 6 Same as Fig. 3, but for the outburst models that do not include viscous heating (Small-outburst, Med-outburst and Outburst-NoVisc). |
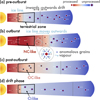 |
Fig. 7 Thermal processing of icy grains. Panel a shows the state of the disk before a stellar outburst. The blue dash line represents the water ice line, the gray dashed line the radial location (rυ=0) that separates the inward- and outward-drifting pebbles, and the black-outlined region the terrestrial-planet-forming region. During an outburst (panel b) the ice line moves outward and particles in the inner disk lose their icy mantles containing isotopically anomalous grains. Afterward, the disk cools down and the iceline retreats (panel c) resulting in the inner disk with a mixture of processed and unprocessed grains, altering the solid composition from NC- to OC-like. However, on longer timescales evermore unprocessed pebbles drift inward resulting in a pebble composition that is close to CI outside the water ice line (panel d). |
Ages and isotopic measurements for the meteoritic bodies studied.
4.1 Different meteoritic classes and selected isotopes
Meteorite ages can be conceivably constrained thanks to the presence of short-lived radionuclides (Davis 2022) or long-lived chronometric systems (Connelly et al. 2017). The dating constraints used here were obtained with different methods: the 82Hf-182W isotope system for iron meteorite parent bodies (Kruijer et al. 2013; Kleine et al. 2009), the lower-limit aqueous alteration ages of chondrites from radiometric 53Mn-53Cr (Doyle et al. 2015), and upper-limit chondrule ages from 26Al-26Mg (Pape et al. 2019) or U-corrected Pb-Pb dating (Bollard et al. 2017; see our Table 2 for more). In contrast, the primordial formation locations of meteorite parent bodies prior to their possible dynamical delivery to the asteroid belt, are much more enigmatic (see introduction). Below, we briefly review key characteristics of the different meteorite classes we consider here.
The carbonaceous chondrites consist of undifferentiated chondrites (CI, CO, CV, CM, and CR) that have seen little thermal processing (Scott & Krot 2014) and have an elevated water content compared to other chondrites (Alexander et al. 2012). The CI class is special in that it is mainly composed of fine-grained matrix material that has a solar-like chemical composition, whereas other carbonaceous chondrites also contain variable abundances of chondrules, metal and calcium-aluminum inclusions (Scott & Krot 2014). Table 2 lists the accretion ages of the different carbonaceous chondrites considered here. In general, the carbonaceous chondrites formed relatively late, approximately 2–5 Myr after CAI formation. Interestingly, the samples returned from asteroid Ryugu are CI-like, as probed via their iron isotopic composition (Hopp et al. 2022a).
The non-carbonaceous chondrites are composed of the ECs, Rumuruti chondrites (RCs), and OCs that have a distinct chemical and isotopic composition from the carbonaceous chondrites. They are reported to have formed earlier, within the first 2 Myr of disk evolution (Table 2) and to have seen a higher degree of thermal processing (Trinquier et al. 2009; Larsen et al. 2011; Miyazaki & Korenaga 2021).
Achondrites originate from differentiated parent bodies that formed early in the evolution of the protoplan-etary disk (≲1.5 Myr; see Table 2). The parent bodies of these meteorites are unknown, with the exception of the howardite–eucrite–diogenite (HED) meteorites that originate from Vesta (McSween et al. 2011). The early-formed ureilite class are believed to sample some of the earliest inner-disk solid materials (Schiller et al. 2018). The iron meteorite group represents differentiated Fe-Ni cores of distinct planetesimals (Burbine et al. 2002). The complete melting of the iron meteorite parent bodies may imply even earlier formation, particularly if the 26Al/27Al was lower than the nominal value (Larsen et al. 2011; Johansen et al. 2023).
In summary, a timeline is established where achondrites (≲1.5 Myr) formed before the non-carbonaceous chondrites (≲2 Myr), and where the carbonaceous chondrites generally have the oldest ages (≳2 Myr). However, determining a temporal sequence within these groups is more difficult (Spitzer et al. 2020): accretion age estimates come with significant spread, driven by formal measurement error, different methods, and modeling assumptions in the case of achondrite accretion ages (Kruijer et al. 2017; Spitzer et al. 2021).
We considered, for each meteoritic class, the nucleosynthetic composition for a collection of different elements. Specifically, we considered the isotope variations in μ54Cr, μ30Si, μ48Ca, μ58Ni, and μ54Fe. Here the μ notation reflects the standard normalized isotope ratio expressed in parts per million (see Appendix C for the definition and used isotope ratio). Table 2 gives literature measurements for the different meteorite classes. These isotopes mainly have supernova (SN) origins, but the precise nature of the SN dust carriers remains unclear. However, at least for 54Cr it is understood that SN-produced chromium-rich oxide (chromite) pre-solar grains contribute to observed nucleosynthetic variations (Dauphas et al. 2010). For Ni, we chose the neutron-poor isotope 58Ni, which is the main carrier of the isotopic anomaly with a SN origin (Steele et al. 2012; Makhatadze et al. 2023). The selected elements are chosen to span a range of condensation temperatures, to include both lithophile (silicate-mantle-loving) elements as well as siderophile (iron-core-loving) elements, and to sample iron-peak elements. The chosen elements are all refractory, in order of increasing 50% -condensation temperature: Cr (Tc = 1291 K), Si (Tc = 1314 K), Fe (Tc = 1338 K), Ni (Tc = 1363 K), Ca (Tc = 1535 K), following Wood et al. (2019). We both include lithophile elements (Cr, Si, Ca), as well as siderophile elements (Ni, Fe; Lodders 2003). Finally, we note that Cr, Fe and Ni are so-called iron-peak elements near the maximum in nuclear binding energy and that Si is special in the sense that is the most abundant nonvolatile element in the Solar System.
In this work we do not focus on s-process sensitive elements (such as siderophile Mo or lithophile Zr) that are are not major planet-forming elements (Budde et al. 2016; Burkhardt et al. 2021; Spitzer et al. 2020). Instead, we present in Appendix D our analysis for the well-studied element Mo. This requires a more complex interpretation due to s-process variation that is likely carried by asymptotic-giant-branch-produced silicon carbide (SiC) stardust grains.
4.2 A comprehensive analysis
In order to collectively show the nucleosynthetic anomalies in different elements, we rescaled the different nucleosynthetic anomalies such that the unprocessed mass fraction χup = 1 represents the high-μ, end-member and χup = 0 represents the low-μ end-member and corresponds to thermally altered material (Sect. 3.1.2). The choice of the end-members is based on the most extreme values measured in different chondrite and achondrite groups, which can be found in Table 2. In principle, other choices for end-member compositions could be made. The high-μ, end-member could for example be matched to CAI or AOA refractory inclusions. Or, rather, to a hypothetical version with chondritic composition (Burkhardt et al. 2019), although the isotopic diversity between CAIs presents a further challenge (Larsen et al. 2020). However, in practice such a procedure would only achieve a rescaling of the χup parameter. A more detailed description of this rescaling approach is given in Appendix C. Using this method, we inconveniently remain agnostic to the exact nature of the SN-made carriers of the isotopic imprint present in unprocessed material and how exactly these nanoparticles are lost during the thermal processing of particles with icy mantles.
Under the assumption that the low-μ end-member composition maps to fully thermally processed dust, we find that an outburst model would be consistent with the nucleosynthetic evolution seen in Solar System meteorites. As discussed in Sec. 3.2, models without outbursts are typically not as efficient in thermally processing a large mass fraction of dust and therefore do not match the observed nucleosynthetic evolution (see Fig. E.1). We therefore focused on models that include accretion outbursts. We first considered the evolution of the pebble composition for the model with the strongest outburst (Outburst-NoVisc). Figure 8 shows the evolution of the pebble composition, with time following the vertical y-axis and the unprocessed mass fraction on the horizontal x-axis. Different contour lines trace the composition at different locations in the disk, with the thick black line showing the inner-disk composition at 1 AU.
Initially the disk is made out of pure pristine unprocessed material. In model Outburst-NoVisc, an outburst after 0.01 Myr processes the material in the disk out to 70 AU. This causes the near-horizontal line at the bottom of the plot, illustrating the large-scale thermal processing of disk material. After the outburst, the viscously expanding gas disk pushes processed material outward, as discussed in Sec. 3. Later, after approximately 1.5 Myr, the inner disk composition gets slowly taken over by inward-drifting unprocessed pebbles coming from the outer disk (r ≳ 100 AU), which causes the transition from processed back toward an unprocessed composition after the outburst. In contrast, the composition of the outer disk (r ≳ 50 AU) undergoes less thermal processing and loses this signature more efficiently due to inward pebble drift.
To compare the nucleosynthetic evolution, the overplotted symbols show the composition of different meteorite classes (indicated with labels and different colors). Differentiated early-formed bodies (ureilite, angrite, and Vesta HEDs) collectively have a low-μ signature in line with being formed from heavily thermally processed solids present early in the inner disk. The exception are IID iron meteorites with a high-μ, imprint in 58Ni and 54Fe (Nanne et al. 2019; Hopp et al. 2022b). These could be consistent with the model, if they indeed formed prior to the thermal processing event, which has then to occur before the upper limit on their accretion age (≤0.5 Myr, Kruijer et al. 2017). In fact, iron meteorites come with a wide range of isotopic compositions intermediate between the IIIAB and IID end members shown in Fig. 8 (Nanne et al. 2019; Hopp et al. 2022b). For completeness, the composition range of the iron meteorites in 58Ni and 54Fe is shown in panels d and e of Fig. C.1, in our view illustrating the rapidly evolving inner disk composition during the outburst phase.
Later formed ordinary and EC parent bodies have an isotopic composition in between the low-μ and high-μ end-members, corresponding to an epoch in the disk model where processed and unprocessed pebbles are well mixed in the terrestrial-planet-forming zone around 1 AU. Their existence suggests that no strict dichotomy existed between the carbonaceous chondrites and the differentiated, OC, and EC parent bodies – which are part of the so-called NC group, as earlier proposed by, for example, Warren (2011), Kruijer et al. (2020), and Burkhardt et al. (2021).
Finally, carbonaceous chondrites represent late-formed bodies (≳2 Myr). In our model, their formation locations are not constrained, as location contours naturally tend to a final unprocessed composition at all locations in the disk. Even CI-like bodies could form in the inner disk, as long as they form late in the evolution of the disk.
The relatively large spread in the nucleosynthetic composition seen in the carbonaceous chondrites may be due to the heterogeneous composition of chondrites composed of different mass fractions of fine-grained matrix, chondrules, and calcium-aluminium-rich inclusions (CAIs). For example, the CC group shows a large spread in μ48Ca, with CV, rather than CI, being the high-μ end-member. This may be due CI chondrites lacking the presence of CAIs enriched in the refractory species 48Ca (Schiller et al. 2015, Fig. C.1, panel a). Similarly, the CI chondrites are not a high-μ end-member for μ54Fe. Instead CI is highly 54Fe-poor, possibly due to the lack of chondrules in CI that may have been the dominant metal component carrier (Schiller et al. 2020, Fig. C.1, panel e). We also note that the measurement of the isotopic anomalies in Ni show large differences, for example for CI, between different works (Nanne et al. 2019; Makhatadze et al. 2023). Other element choices, μ54Cr, μ30Si, and μ58Ni, do show CI as the expected high-μ end-member. In particular, CV chondrites contain a μ-rich CI-like matrix that includes chondrules that carry a μ54Cr poor signature, similar to NC achondrites, consistent with their precursor formation in the processed inner disk as proposed here (van Kooten et al. 2021). Hence, although we argued here that thermal processing of pebbles could be a dominant factor in determining the nucleosynthetic composition of different Solar System objects, it also appears that an additional component is the transport and inclusion of material in the form of chondrules and refractory inclusions (van Kooten et al. 2021; Hellmann et al. 2023). Therefore, an interesting avenue for future work would be to extend the model to also include explicitly the contributions of early-formed anomalous CAIs to the final bulk isotope composition. Their high-μ nature could be explained if they selectively acquired the sublimated dust fraction during the thermal processing event (Trinquier et al. 2009; Larsen et al. 2020).
For completeness, we also briefly discuss models where we consider lower-luminosity outbursts. As discussed before (Sec. 3.2), the increase in luminosity in models Small-outburst and Med-outburst is not high enough to efficiently push the ice lines outward, which results in less overall thermal processing. For the 100 L⊙ outburst, material gets processed out to only ~10 AU and quickly gets replenished by the inward drift of unprocessed pebbles. Therefore, all late-formed differentiated bodies retain an unprocessed composition (Fig. 9). By increasing the intensity of the outburst to a luminosity of 500 L⊙, the fraction of processed pebbles increases to ~70% and results in more outward mixing of processed material, as seen in the right-hand panel of Fig. 9 This case is able to match the composition of the earliest-formed bodies (angrites, ureilites, and HEDs) and some of the late-formed carbonaceous chondrites, but would not be consistent with the composition of the OCs and early-formed carbonaceous chondrites (CO and CV).
To conclude, a strong large-scale thermal processing event, triggered by a stellar outburst, appears to be consistent with the interpretation that the nucleosynthetic isotope differences between meteorites are due the temporal evolution of the composition of the disk (rather than due to a fixed spatial separation of different planetesimal reservoirs). However, in opposition with this hypothesis, the early inward drift of low-μ material naturally explains the lack of late-formed parent bodies with a low-μ signature (the empty upper left-hand corned of Fig. 8). The interpretation of the siderophile elements, 58Ni and 54Fe, is more complex, but the high-μ and low-μ end-member compositions of iron meteorites may be due their formation, respectively, before or after the last major outburst that triggered a near disk-wide thermal processing event.
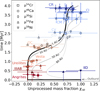 |
Fig. 8 Evolution of the mass fraction of unprocessed pebbles with time at different locations in the disk (contours). The bold black line represents the inner disk composition at 1 AU. The symbols show normalized nucleosynthetic measurements, for different elements as indicated by the legend. The different meteorite classes are colored from red to blue. The corresponding estimates for their accretion ages are given with vertical error bars (or upper limit arrows), slightly displaced for the different elements for visibility. Horizontal error bars are the uncertainties on the normalized nucleosynthetic composition. |
 |
Fig. 9 Same as Fig. 8, but for models with less intense outbursts (Small-outburst and Med-outburst). The outbursts in these cases are not strong enough to push the ice line sufficiently outward. This prevents a long-lived mixing of the processed and unprocessed components, which in our model is needed to match the isotopic differences. |
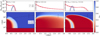 |
Fig. 10 Pebble flux evolution for the Outburst-NoVisc model with different particle sizes. Panel a shows the case with Rp = 1 mm particles, panel b the case with Rp = 0.01 mm particles, and panel c shows a simulation with a varying particle size for each pebble component. Increasing the particle size decreases the lifetime of the pebble disk, due to increased pebble drift rates. If the different pebbles species have different particle radii, large particles in the outer disk can drift inward before smaller processed pebbles are first diffused outward and subsequently later drift inward. |
5 Discussion and future work
5.1 Particle size dependence
In this section, we explore the effect of changing the size of the solid particles in the Outburst-NoVisc model. We consider three scenarios, two with different constant particle sizes (Rp = 0. 01 mm and 1 mm) and one with varying size between both pebble populations (up and p).
For the bigger particle case (Rp = 1 mm), the pebble component drifts inward on a shorter timescale, causing the disk to run out of material faster (≲1.5 Myr), as shown in panel a of Fig. 10. Such rapid dust depletion would be inconsistent with meteoritic ages and protoplanetary disk ages of several megayears that have been inferred with ALMA (Ansdell et al. 2016; Appelgren et al. 2023). The opposite happens with smaller particles (Rp = 0.01 mm), where the longer drift time makes the pebble disk long lived with pebble fluxes higher than 10−6 M⊕ yr−1 after 3 Myr, as shown in panel b of Fig. 10. Nevertheless, although both scenarios with different particle sizes have a different temporal evolution compared to the Outburst model with 0. 1 millimeter-sized particles, they still show a similar qualitative evolution in their composition, where the inner disk (≤ 10 AU) experiences a mixing of the inner processed component with outer unprocessed material drifting inward.
The final case is one where we considered a disk with different pebble sizes for the different populations. This case is presented as a numerical experiment to illustrate the complex behavior when relaxing the assumption of constant particle size. Here, we took the outer unprocessed particles to have a size of Rup,p = 1 mm and the processed component Rp,p = 0.1 mm. This was done to reflect the inferred primitive millimeter-sized pebbles that make up pristine comets (Blum et al. 2017), while chondrules have similar or smaller sizes. This may, in turn, reflect that when material gets heated and turns from unprocessed to processed, it loses part of its mass and might decrease in size.
In this case, the small p pebbles initially flow outward along with the viscous expansion of the gas disk, while the larger up pebbles already drift inward to the larger drag force on them (panel c of Fig. 10). This process results in a region where the outward moving p pebbles begin to exceed the surface density of depleted up pebbles. The rapid drift of the larger up pebbles creates an enrichment of unprocessed material in the inner part of the disk (≲10 AU). This enhancement is maintained for ~0.5 Myr. However, once this unprocessed component has completely drifted inward and been accreted into the star, the disk starts to follow a similar behavior as before, where the processed component dominating most of the inner disk. This brief early period of up enrichment would allow bodies forming in the inner disk to accrete a fraction of unprocessed material at earlier times compared to the models previously presented.
The above numerical experiments illustrate how our results may depend on a more detailed treatment of the particle size evolution. Therefore, it will be important to explicitly investigate the role of particle coagulation, compaction and fragmentation (Güttler et al. 2010; Zsom et al. 2010). Future work will need to go beyond the simplified constant pebble size model used here, which only approximates the fact that most mass in solids is carried in pebbles limited in size by fragmentation (Brauer et al. 2008; Birnstiel et al. 2010; Appelgren et al. 2020, 2023). This process was believed to be less efficient for icy particles (Gundlach & Blum 2015). However, recent laboratory experiments argue fragmentation velocities are not much influenced and remain around 1 m s−1 (Musiolik et al. 2016a,b). In particular, during the outburst, particles undergoing water sublimation may undergo complete destruction down to the monomer level, before re-coagulating (Schoonenberg et al. 2017; Houge & Krijt 2023). However, results from the dust modeling of V883 Ori do not support such aggregate destruction during an outburst (Houge et al. 2024).
Collectively, these coagulation and fragmentation processes will redistribute, possibly preferentially, isotope carriers along the particle size distribution, especially when nano-sized particles are trapped below an electrostatic barrier for particle growth (Akimkin et al. 2023). Moreover, the subsequent reduced drift rates of gas-coupled stardust grains, compared to larger pebbles, will further separate these components and leave an imprint in the global disk composition (Steele et al. 2012; Pignatale et al. 2017; Hutchison et al. 2022). Taken together, this is an important avenue for future work.
5.2 Processes that impact the global pebble flux
5.2.1 An initially outward expanding disk
A fundamental element of the work presented here is that the disk undergoes an initial phase of strong outward expansion. This early expansion appears to be supported by observations of dust radii of class 0/I young disks (Maury et al. 2019). Here we made use of a simplified viscous expansion model (Sect. 2.1), but determining the exact nature of the outward expansion of dust in disks is of key importance, as it regulates the pebble flux at late times (Liu et al. 2022).
Recent nonideal magnetohydrodynamic simulations illustrate disk where inward mass transport is driven by disk winds also can show outward expansion, due to reconnecting poloidal field lines in the outer disk (Yang & Bai 2021). In earlier disk phases, the newly formed massive and compact disks are close to being gravitational unstable, which would then drive the initial viscous relaxation of the outer disk (Elbakyan et al. 2020). Moreover, future work is needed to more carefully model the outbursts themselves as the accretion burst itself triggers global angular momentum redistribution (Cleaver et al. 2023). Finally, disks may expand non-viscously. Even after the collapse of the pre-stellar core, high angular momentum material, with possibly anomalous composition, may be accreted onto the disk in wide orbits through streamers (Kuffmeier et al. 2023).
5.2.2 Role of Jupiter
It is not clear to what degree Jupiter, and the other giant planets in the Solar System, played a role in reducing the pebble flux to the inner disk. Even a moderate reduction in the pebble flux can suppress the formation of super-Earths in the inner disk and instead lead to terrestrial planet formation (Lambrechts et al. 2019b). Possibly, Jupiter reduced the pebble flux to the inner disk, but it is unlikely this happened early, as it appears the rapid accretion of the envelope of Jupiter was halted by disk dissipation (Lambrechts et al. 2019a). Moreover, even gap-forming planets allow for the mass transport of pebble fragments through diffusion across its orbit (Pinilla et al. 2012; Drążkowska et al. 2019; Stammler et al. 2023; Kalyaan et al. 2023). It therefore seems unlikely that the NC–CC divide in the iron meteorites can be explained solely by an early-formed Jupiter that would permanently seal off the inner disk from solid delivery (Kruijer et al. 2017). Instead, we propose here that this early separation in 58Ni and 54Fe is due to sampling parent bodies formed from pre-and post-outburst dust (Sec. 4.2). This is different from the proposal by Liu et al. (2022) who suggested that the parent bodies of the CC-like iron meteorites formed early, but far in the outer disk, and could then subsequently be dynamically delivered to the asteroid belt during giant planet formation.
Nevertheless, although gap-formation by giant planets is not directly required to explain the NC–CC divide, it very well may have left a clear imprint in the transport of less fragmentationprone species like chondrules and CAIs (Desch et al. 2018; Haugbølle et al. 2019; Jongejan et al. 2023). In this context, it is interesting to speculate that CI chondrites formed devoid of strongly thermally altered material because the fragmentation-resilient component consisting of chondrules and CAIs did not efficiently pass the pressure bumps outside of the Solar System giant planets. Such a scenario has also been suggested to explain the observed late addition of CI-like fine-grained dust rims onto earlier-formed inner-disk NC-like chondrule cores (van Kooten et al. 2021).
6 Conclusions
In this work, we have investigated the thermal processing of pebbles in the earliest phases of the disk lifetime, following Liu et al. (2022). We first considered a scenario where disks form compactly with very small radii (<10 AU), which allows a large fraction of solids to experience elevated temperatures. However, in this case pebbles are lost due to drift well within the gas disk lifetime, before the formation of carbonaceous chondrites. This occurs even when assuming high levels of viscous expansion for the outer disk (Sec. 3.1). Moreover, both observations and simulations support a more continuous view of gas delivery to young protoplanetary disks (Valdivia-Mena et al. 2022; Kuznetsova et al. 2022; Kuffmeier et al. 2023). We have explored how stellar outbursts, common in the early stages of disk evolution, could have triggered the thermal processing of a large mass fraction of the solids that were present in the inner regions of a larger protoplanetary disk. Our model shows how the luminosity increase efficiently pushes the separation radius between processed and unprocessed components outward. We numerically traced how these different early-generated pebble reservoirs evolve with time, separating the pebbles that underwent thermal processing via water ice sublimation from those that did not. We find that a large-scale thermal processing event, followed by an evolving composition of the pebble flux in the inner disk, is largely consistent with the evolving nucleosynthetic signature of the Solar System, in line with Schiller et al. (2018), Liu et al. (2022), and Onyett et al. (2023). This view requires that the loss of the icy mantles surrounding primitive dust grains leads the preferential removing of grains with an isotope signature of likely SN origin. Exploring this assumption, together with an improved treatment of particle growth, sublimation, and fragmentation, should be a focus of further investigations.
Overall, our results support a scenario in which disks are generically formed with thermally processed solids in the inner disk and pristine icy pebbles in the outer disk. During the lifetime of the gas disk, these icy pebbles drift and mix with the inner component. The subsequent formation of planetesimals and protoplanetary bodies in the inner few AUs of disks, which includes the habitable zone, will then inherit the altering elemental and isotopic composition of their pebble-sized building blocks.
Acknowledgements
The authors thank the two referees for their valuable comments. M.J.C. acknowledges funding from the NASA grant XRP 80NSSC20K0259. M.L. acknowledges funding from the European Research Council (ERC Starting Grant 101041466-EXODOSS). M.L. and M.J.C. thank the Gunnar och Gunnel Källéns minnesfond for supporting a 3-month research visit to Lund Observatory. E.v.K. acknowledges funding from the Danish Villum Young Investigator grant (no. 53024). A.J. acknowledges funding from the European Research Foundation (ERC Consolidator Grant 724687-PLANETESYS), the Knut and Alice Wallenberg Foundation (Wallenberg Scholar Grant 2019.0442), the Swedish Research Council (Project Grant 2018-04867), the Danish National Research Foundation (DNRF Chair Grant DNRF159) and the Göran Gustafsson Foundation.
Appendix A Outburst time
As discussed before in Section 3.2, the timing, duration and intensity of accretion outbursts change substantially between objects. Outburst are observed to occur typically with the first megayear of disk evolution and last days to centuries (Hartmann & Kenyon 1996; Fischer et al. 2023). Therefore, in this section we briefly explore if a late-inserted outburst can be consistent with the evolution of the nucleosynthetic composition of meteorites.
For this purpose, we explored a new model, Late-Outburst, which uses the same parameters as model Outburst-NoVisc except that we modified the age at which we introduce the outburst from tout = 104 yr to tout = 105 yr. The time evolution of the pebble composition, along with the different meteorite classes, is shown in Figure A.1 (panel a and b). In this case, the water iceline that separates the processed and unprocessed reservoirs gets pushed to ~70 AU, similar to model Outburst-NoVisc. However, by the time the outburst is introduced at 105 yr a lot of the material has already drifted inward and been accreted into the star. This means that less material gets processed and that there is a lower degree of mixing, resulting in the composition to be more up-like. From Figure A.1 (panel c), we can see that the disk would still be able to form achondrite-like bodies early on, but the composition after 1.5 Myr would be too unprocessed to form bodies with an intermediate composition that is similar to ordinary, CV and CO chondrites. From this we can conclude that outbursts are most efficient in thermally processing material in the compact young disks with which FU Ori outbursts are typically associated (Kóspál et al. 2023).
Appendix B Viscosity variation
The distribution of angular momentum in the disk is determined by the viscous parameter α (Equation (2)) in our simulations. In the previously presented models, we selected a nominal value of α = 0. 01 that aligns with the observed disk lifetimes and measured gas accretion rates (Appelgren et al. 2023). In this section, we show two additional iterations of the model Outburst-NoVisc with lowered viscosity to highlight the impact of decelerating the viscous evolution of the disk.
We first ran the model Med-visc-alpha with α = 0.005. The evolution of the pebble flux in the disk is shown in panel (a) of Figure B.1. As the viscosity in the disk is decreased, the disk evolves on a longer timescale. Therefore, unprocessed material only becomes dominant inside 5 AU after 3 Myr. This is because the lower disk viscosity results in a higher gas surface density at late times, which leads to slower pebble drift (for particles with fixed size, see Equation (13)). Because of this effect, we ran model Low-visc-alpha, where we decreased the viscosity parameter to α = 0.001 and increased the particle size to Rp = 1 mm, thereby promoting drift (Section 5.1). In this way the disk starts to be depleted of pebbles within a few million years, more consistent with observed disk lifetimes. Nevertheless, as shown in in panel (b) of Figure B.1, drift remains relatively inefficient for this particle size choice and the inner disk retains a processed composition within 2.5 Myr. The more rapid decrease in the pebble flux at 5 AU, compared at 1 AU, illustrates the depletion of a smaller reservoir of outer-disk solids, due a lower degree of initial outward-drifting pebbles during the viscous expansion phase of the disk and subsequent drift. In summary, the evolution of the disk composition is only moderately sensitive to the choice of the viscosity for the initial disk expansion, but the effective Stokes number of the inward-drifting pebbles regulates the delivery of unprocessed material to the inner disk.
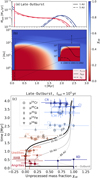 |
Fig. A.1 Evolution of the mass fraction of unprocessed pebbles for a late outburst model. Panels (a) and (b): Evolution of the mass fraction of up Late-Outburst, where the outburst is introduced at tout = 105 yr (similar to Figure 3). Panel (c): Evolution of the mass fraction of up pebbles compared to isotopic compositions of meteorites for the Late-Outburst model (similar to Fig. 8). |
The slower disk evolution can also be seen reflected in the modeled meteoritic compositions in Figure B.2. The model Med-visc-alpha (left panel) is able to match the composition of early-formed, differentiated bodies, but even after ~1.5 Myr it maintains a high amount of processed material, inconsistent with the isotopic composition of several carbonaceous chondrites. The evolution of the composition of model Low-visc-alpha is slightly more extreme (Figure B.2, right panel). Inside 10 AU the disk remains dominated by mostly processed pebbles within 2 Myr after the outburst. This mainly indicates that the pebble drift has to be more efficient to explain the composition of the carbonaceous chondrites.
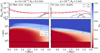 |
Fig. B.1 Pebble flux evolution for the Outburst-NoVisc model using viscosities of α = 0.005 (a) and α = 0.001 (b). |
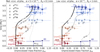 |
Fig. B.2 Unprocessed mass fraction evolution for the Outburst-NoVisc model using viscosities of α = 0.005 (a) and α = 0.001(b), similar to Fig. 8 |
Appendix C Calculation of the unprocessed mass fraction
In section 4 we expressed the nucleosynthetic measurements for different isotopes in a normalized form by defining the unprocessed mass fraction χup. We give a more detailed description here. Isotopic anomalies are typically expressed with either so-called μ notation, defined as follows:
![$\[\mu^i \mathrm{X}=\left[\frac{\left({ }^i \mathrm{X} /{ }^j \mathrm{X}\right)_{\text {sample }}}{\left({ }^{\mathrm{i}} \mathrm{X} /{ }^j \mathrm{X}\right)_{\text {standard }}}-1\right] \times 10^6\]$](/articles/aa/full_html/2024/05/aa47737-23/aa47737-23-eq18.png) (C.1)
(C.1)
Here, i and j correspond to 54 and 52 in the case of Cr, 48 and 44 for Ca, 58 and 61 for Ni, 30 and 28 for Si, and 54 and 56 for Fe, respectively. All isotope measurements considered in this work are listed in Table 2 and can be inspected, for each element, in Fig. C.1. The values for the additional iron meteorites shown in Fig. C.1, panels (d) and (e), are taken from Nanne et al. (2019) and Hopp et al. (2022b), respectively.
To calculate the unprocessed mass fraction, χup, for an element X, we used the following definition:
![$\[\chi_{\mathrm{up}, i}=\frac{\mu X_i-\mu X_{\mathrm{dep}}}{\mu X_{\mathrm{enr}}-\mu X_{\mathrm{dep}}},\]$](/articles/aa/full_html/2024/05/aa47737-23/aa47737-23-eq19.png) (C.2)
(C.2)
where μXdep and μXenr represent the measurement for the low-μ and high-μ end-members, respectively.
To select the end-members, we chose the bodies that have the two most extreme values. For example, for μ54Cr, the ureilites were chosen as the 54Cr-poor end-member, while the CI chondrites were taken for the 54Cr-rich end-member. The end-members of each isotope are indicated in Table 2. In the case of μ58Ni, both end-members correspond to iron meteorites. For the other isotopes the high-μ end-member usually corresponds to undifferentiated chondrites like CV and CI for μ48Ca and μ30Si, respectively. However, the measurement of μ54Fe for CI chondrites is highly 54Fe poor; therefore, we took EC as the low-μ end-member.
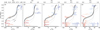 |
Fig. C.1 Nucleosynthetic measurements for each of the isotopes considered in this work. Each panel represents a different element. The different meteorite classes are red to blue colored, and the horizontal error bars are the uncertainties on the nucleosynthetic composition. The corresponding estimates for their accretion ages are given with vertical error bars (or upper limit arrows). The upper axis represents the normalized values, similar to Fig. 8. The normalization is discussed in the text. The contours show the evolution of the mass fraction of unprocessed pebbles with time at different locations in the disk. The bold black line represents the inner disk composition at 1AU. |
As a final step, we propagated the uncertainties from the end-members into the error bars of Fig. 8. For this, we simply considered that the error is
![$\[\begin{aligned}& \sigma_{\chi_{\mathrm{up}, i}}^2=\left(\mu X_{\mathrm{enr}}-\mu X_{\mathrm{dep}}\right)^{-4}\left[\sigma_{\mathrm{enr}}^2\left(\mu X_{\mathrm{dep}}-\mu X_i\right)^2+\right. \\& \qquad\qquad\quad\quad\left.\sigma_{\mathrm{dep}}^2\left(\mu X_{\mathrm{enr}}-\mu X_i\right)^2+\sigma_i^2\left(\mu X_{\mathrm{enr}}-\mu X_{\mathrm{dep}}\right)^2\right]\end{aligned}\]$](/articles/aa/full_html/2024/05/aa47737-23/aa47737-23-eq20.png) (C.3)
(C.3)
where σenr and σdep are the uncertainties for the end-members.
Appendix D Molybdenum as an example of an element with s-process variability
Our main paper focuses on the isotopic variability between different meteorite classes of r-process sensitive elements, likely linked to SN grains (section 4.1). In contrast, the different isotopic signatures of the so-called s-process elements have been considered to be more complex, likely due to SiC grains driving s-process variability, and have been interpreted in multiple different ways (Budde et al. 2016; Yokoyama et al. 2019; Stephan & Davis 2021). Here, we focus on the well-studied element Molybdenum (Mo) and show that its isotopic signature is also consistent with our interpretation of outburst-driven thermal processing.
Molybdenum is a moderately siderophile element that shows both r- and s-process-driven variation in bulk meteorites. Therefore, a simple analysis with μ-variability in a single isotope, as for example done in Fig. 8, is no longer instructive. Instead, we focus here on a μ94Mo versus μ95Mo diagram , a so-called three-isotope plot (Fig. D.1).
The different carbonaceous chondrites classes are approximately located on a single line in Fig. D.1. The blue a CC-line fit from Budde et al. (2016) also includes, not shown here, CC achondrites (Kruijer et al. 2017) and carbonaceous chondrites with strong s-process depletion (high μ values), like Ryugu (Nakanishi et al. 2023), which plot outside the axis range used here. This CC-line also includes the primitive CI chondrites, marked with a bold blue cross (Burkhardt et al. 2011, although Dauphas et al. (2002b) reports an offset value). The substantial s-process variation along the CC-line reflects the heterogeneous distribution of s-process carriers. This has been interpreted as being driven by embedded SiC grains that show Mo isotope variability with the same slope as the CC-line. The CC-slope used here has a linear slope of sCC = 0.60 (Budde et al. 2016; Yokoyama et al. 2019). SiC grains have a reported s-process slope of sSiC = 0.59 ± 0.02 (Nicolussi et al. 1998; Dauphas et al. 2004). Alternatively, variability along the blue line may be driven by chondrules carrying a positive anomaly in both μ94Mo and μ95Mo compared to matrix, possibly driven by metal-silicate fractionation during chondrule formation (Budde et al. 2016).
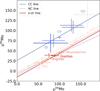 |
Fig. D.1 Mo isotope compositions of the CC and NC meteorite groups in a μ94Mo versus μ95Mo diagram (using the same color scheme as in Fig. 8). The blue CC-line fit is taken from Budde et al. (2016). NC meteorites are plotted close to an s-process mixing line through ureilite (thick red s-Ur line). Thin contours give the unprocessed mass fraction encompassing the OC and EC chondrites. The dashed gray line represents the line fit through the NC group obtained by Yokoyama et al. (2019). Literature data sources: CI (Burkhardt et al. 2011), CO (Burkhardt et al. 2014), CV, OC, EC (Yokoyama et al. 2019), ureilites, angrites, and mesosiderites (Budde et al. 2018). The mesosiderites may represent Vesta-like material (Haba et al. 2019). |
For the NC group, the isotopic distribution in a μ94Mo versus μ95Mo diagram is clearly distinct and offset from the CC group (Fig. D.1). However, it is not readily apparent if the NC distribution is located on a single line with a SiC-like slope, or even on a single mixing line at all. Previous works have generally argued for an NC line with a less steep slope compared to SiC (however, see also Stephan & Davis 2021). Budde et al. (2016) reported a slope of sNC = 0.47 ± 0.14, similar to the sNC = 0.488 ± 0.085 that we used here (Yokoyama et al. 2019, gray dashed line). Recently, Spitzer et al. (2020) found sNC = 0.528 ± 0.045, shallower than the earlier estimate by Budde et al. (2018) of sNC = 0.595 ± 0.011. This shallow slope is driven by the s-process enriched OC end EC samples that lean away from the s-Ur line in the lower left-hand corner of Fig. D.1.
Following our outburst model of section 4, the CI chondrites (bold blue cross in Fig. D.1) correspond to an unprocessed component (χup = 1). The NC achondrite ureilite would represent a fully processed endmember (χup = 0). Therefore, the red s-Ur line with a SiC slope represents an s-process mixing line onto which fully processed solids with SiC-carried heterogeneity would then plot. We also show parallel curves that represent mixtures between the s-Ur line and the CI chondrite endmember, corresponding to partly processed compositions (χup = 0.10 and χup = 0.3). The OCs, in our model a mixture of outburst-processed pebbles and inward-drifted pristine outer-disk pebbles, fall in this range, as well as the ECs. In summary, the Mo isotope data can be interpreted to be consistent with the progressive loss of isotopically distinct Mo from ice-embedded dust: from unprocessed CI to OC and finally fully processed ureilites, as also argued in the main paper. This interpretation is different from, for example Budde et al. (2016), who argued for an addition of r-process Mo to the CC reservoir. That being said, we acknowledge the substantial error bars on Mo isotopic compositions and alternative explanations cannot be excluded. Future work is needed to further explore how elements with strong s-element variability fit with the thermal processing model.
Appendix E Unprocessed mass fraction of the non-outburst models
For completeness, we show in this section the evolution of the pebble composition for the Nominal and Compact models in Fig. E.1. As discussed in section 3.1.2, in the Nominal model a sharp transition from processed to unprocessed material occurs at approximately 2.7 Myr at a radius of 1 AU shown by the black solid line. This makes it not longer possible to create bodies with a mixed OC-like composition. The Compact models are traced by the dashed line. This case initially show a higher degree of mixing that subsequently gets dominated by the drift of unprocessed material after ~2.5 Myr, which makes it difficult to match to composition of OCs.
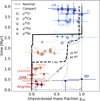 |
Fig. E.1 Evolution of the mass fraction of unprocessed pebbles for the Nominal and Compact models (similar to Fig. 8). Here, the Nominal model is shown with solid lines (thick black line is 1 AU, the subsequent gray lines show the 10 AU, 50 AU and 80 AU contours), while the dashed lines show the Compact model. |
References
- Akimkin, V., Ivlev, A. V., Caselli, P., et al. 2023, ApJ, 953, 72 [NASA ADS] [CrossRef] [Google Scholar]
- Alexander, C. M. O., Bowden, R., Fogel, M. L., et al. 2012, Science, 337, 721 [NASA ADS] [CrossRef] [Google Scholar]
- Alibert, Y., Venturini, J., Helled, R., et al. 2018, Nat. Astron., 2, 873 [NASA ADS] [CrossRef] [Google Scholar]
- Andrews, S. M., Huang, J., Pérez, L. M., et al. 2018, ApJ, 869, L41 [NASA ADS] [CrossRef] [Google Scholar]
- Ansdell, M., Williams, J. P., van der Marel, N., et al. 2016, ApJ, 828, 46 [Google Scholar]
- Appelgren, J., Lambrechts, M., & Johansen, A. 2020, A&A, 638, A156 [NASA ADS] [CrossRef] [EDP Sciences] [Google Scholar]
- Appelgren, J., Lambrechts, M., & van der Marel, N. 2023, A&A, 673, A139 [NASA ADS] [CrossRef] [EDP Sciences] [Google Scholar]
- Audard, M., Ábrahám, P., Dunham, M. M., et al. 2014, in Protostars and Planets VI, eds. H. Beuther, R. S. Klessen, C. P. Dullemond, & T. Henning, 387 [Google Scholar]
- Banzatti, A., Pinilla, P., Ricci, L., et al. 2015, ApJ, 815, L15 [Google Scholar]
- Binkert, F., & Birnstiel, T. 2023, MNRAS, 520, 2055 [NASA ADS] [CrossRef] [Google Scholar]
- Birnstiel, T., Dullemond, C. P., & Brauer, F. 2010, A&A, 513, A79 [NASA ADS] [CrossRef] [EDP Sciences] [Google Scholar]
- Bitsch, B., Johansen, A., Lambrechts, M., & Morbidelli, A. 2015, A&A, 575, A28 [NASA ADS] [CrossRef] [EDP Sciences] [Google Scholar]
- Blum, J., & Wurm, G. 2008, ARA&A, 46, 21 [Google Scholar]
- Blum, J., Gundlach, B., Krause, M., et al. 2017, MNRAS, 469, S755 [Google Scholar]
- Bollard, J., Connelly, J. N., Whitehouse, M. J., et al. 2017, Sci. Adv., 3, e1700407 [Google Scholar]
- Brauer, F., Dullemond, C. P., & Henning, T. 2008, A&A, 480, 859 [NASA ADS] [CrossRef] [EDP Sciences] [Google Scholar]
- Budde, G., Burkhardt, C., Brennecka, G. A., et al. 2016, Earth Planet. Sci. Lett., 454, 293 [CrossRef] [Google Scholar]
- Budde, G., Kruijer, T. S., & Kleine, T. 2018, Geochim. Cosmochim. Acta, 222, 284 [CrossRef] [Google Scholar]
- Burbine, T. H., McCoy, T. J., Meibom, A., Gladman, B., & Keil, K. 2002, in Asteroids III (University of Arizona Press), 653 [Google Scholar]
- Burkhardt, C., Kleine, T., Oberli, F., et al. 2011, Earth Planet. Sci. Lett., 312, 390 [CrossRef] [Google Scholar]
- Burkhardt, C., Hin, R. C., Kleine, T., & Bourdon, B. 2014, Earth Planet. Sci. Lett., 391, 201 [CrossRef] [Google Scholar]
- Burkhardt, C., Dauphas, N., Hans, U., Bourdon, B., & Kleine, T. 2019, Geochim. Cosmochim. Acta, 261, 145 [NASA ADS] [CrossRef] [Google Scholar]
- Burkhardt, C., Spitzer, F., Morbidelli, A., et al. 2021, Sci. Adv., 7, eabj7601 [NASA ADS] [CrossRef] [Google Scholar]
- Cieza, L. A., Casassus, S., Tobin, J., et al. 2016, Nature, 535, 258 [Google Scholar]
- Cleaver, J., Hartmann, L., & Bae, J. 2023, MNRAS, 523, 5522 [NASA ADS] [CrossRef] [Google Scholar]
- Connelly, J. N., Bizzarro, M., Krot, A. N., et al. 2012, Science, 338, 651 [Google Scholar]
- Connelly, J. N., Bollard, J., & Bizzarro, M. 2017, Geochim. Cosmochim. Acta, 201, 345 [NASA ADS] [CrossRef] [Google Scholar]
- Contreras Peña, C., Naylor, T., & Morrell, S. 2019, MNRAS, 486, 4590 [CrossRef] [Google Scholar]
- Dauphas, N., & Schauble, E. A. 2016, Annu. Rev. Earth Planet. Sci., 44, 709 [CrossRef] [Google Scholar]
- Dauphas, N., Marty, B., & Reisberg, L. 2002a, ApJ, 565, 640 [NASA ADS] [CrossRef] [Google Scholar]
- Dauphas, N., Marty, B., & Reisberg, L. 2002b, ApJ, 569, L139 [NASA ADS] [CrossRef] [Google Scholar]
- Dauphas, N., Davis, A. M., Marty, B., & Reisberg, L. 2004, Earth Planet. Sci. Lett., 226, 465 [CrossRef] [Google Scholar]
- Dauphas, N., Remusat, L., Chen, J. H., et al. 2010, ApJ, 720, 1577 [NASA ADS] [CrossRef] [Google Scholar]
- Dauphas, N., Chen, J. H., Zhang, J., et al. 2014, Earth Planet. Sci. Lett., 407, 96 [CrossRef] [Google Scholar]
- Dauphas, N., Hopp, T., & Nesvorný, D. 2024, Icarus, 408, 115805 [NASA ADS] [CrossRef] [Google Scholar]
- Davidson, J., Busemann, H., Nittler, L. R., et al. 2014, Geochim. Cosmochim. Acta, 139, 248 [CrossRef] [Google Scholar]
- Davis, A. M. 2022, Annu. Rev. Nuclear Part. Sci., 72 [Google Scholar]
- Desch, S. J., Kalyaan, A., & O'D Alexander, C. M. 2018, ApJS, 238, 11 [NASA ADS] [CrossRef] [Google Scholar]
- Doyle, P. M., Jogo, K., Nagashima, K., et al. 2015, Nat. Commun., 6, 7444 [NASA ADS] [CrossRef] [Google Scholar]
- Drążkowska, J., Li, S., Birnstiel, T., Stammler, S. M., & Li, H. 2019, ApJ, 885, 91 [Google Scholar]
- Dunham, M. M., & Vorobyov, E. I. 2012, ApJ, 747, 52 [NASA ADS] [CrossRef] [Google Scholar]
- Ek, M., Hunt, A. C., Lugaro, M., & Schönbächler, M. 2020, Nat. Astron., 4, 273 [NASA ADS] [CrossRef] [Google Scholar]
- Elbakyan, V. G., Johansen, A., Lambrechts, M., Akimkin, V., & Vorobyov, E. I. 2020, A&A, 637, A5 [NASA ADS] [CrossRef] [EDP Sciences] [Google Scholar]
- Fischer, W. J., Hillenbrand, L. A., Herczeg, G. J., et al. 2023, in ASP Conf. Ser., 534, eds. S. Inutsuka, Y. Aikawa, T. Muto, et al. 355 [Google Scholar]
- Fischer-Gödde, M., Elfers, B.-M., Münker, C., et al. 2020, Nature, 579, 240 [CrossRef] [Google Scholar]
- Flock, M., Nelson, R. P., Turner, N. J., et al. 2017, ApJ, 850, 131 [Google Scholar]
- Floss, C., & Haenecour, P. 2016, Geochem. J., 50, 3 [NASA ADS] [CrossRef] [Google Scholar]
- Fujiya, W., Sugiura, N., Hotta, H., Ichimura, K., & Sano, Y. 2012, Nat. Commun., 3, 627 [NASA ADS] [CrossRef] [Google Scholar]
- Fulle, M., Blum, J., Green, S. F., et al. 2019, MNRAS, 482, 3326 [NASA ADS] [CrossRef] [Google Scholar]
- Gundlach, B., & Blum, J. 2015, ApJ, 798, 34 [Google Scholar]
- Güttler, C., Blum, J., Zsom, A., Ormel, C. W., & Dullemond, C. P. 2010, A&A, 513, A56 [Google Scholar]
- Haba, M. K., Wotzlaw, J.-F., Lai, Y.-J., Yamaguchi, A., & Schönbächler, M. 2019, Nat. Geosci., 12, 510 [NASA ADS] [CrossRef] [Google Scholar]
- Hartmann, L., & Kenyon, S. J. 1996, ARA&A, 34, 207 [NASA ADS] [CrossRef] [Google Scholar]
- Hartmann, L., Calvet, N., Gullbring, E., & D'Alessio, P. 1998, ApJ, 495, 385 [NASA ADS] [CrossRef] [Google Scholar]
- Haugbølle, T., Weber, P., Wielandt, D. P., et al. 2019, AJ, 158, 55 [Google Scholar]
- Hayashi, C. 1981, Progr. Theoret. Phys. Suppl., 70, 35 [CrossRef] [Google Scholar]
- Hellmann, J. L., Schneider, J. M., Wölfer, E., et al. 2023, ApJ, 946, L34 [NASA ADS] [CrossRef] [Google Scholar]
- Hennebelle, P., Commerçon, B., Lee, Y.-N., & Charnoz, S. 2020, A&A, 635, A67 [NASA ADS] [CrossRef] [EDP Sciences] [Google Scholar]
- Hopp, T., Dauphas, N., Abe, Y., et al. 2022a, Sci. Adv., 8, eadd8141 [NASA ADS] [CrossRef] [Google Scholar]
- Hopp, T., Dauphas, N., Spitzer, F., Burkhardt, C., & Kleine, T. 2022b, Earth Planet. Sci. Lett., 577, 117245 [NASA ADS] [CrossRef] [Google Scholar]
- Hoppe, P., Leitner, J., Kodolányi, J., Borrmann, S., & Jones, A. P. 2022, Nat. Astron., 6, 1027 [Google Scholar]
- Houge, A., & Krijt, S. 2023, MNRAS, 521, 5826 [NASA ADS] [CrossRef] [Google Scholar]
- Houge, A., Macías, E., & Krijt, S. 2024, MNRAS, 527, 9668 [Google Scholar]
- Hubbard, A., & Ebel, D. S. 2014, Icarus, 237, 84 [NASA ADS] [CrossRef] [Google Scholar]
- Hueso, R., & Guillot, T. 2005, A&A, 442, 703 [NASA ADS] [CrossRef] [EDP Sciences] [Google Scholar]
- Hutchison, M. A., Bodénan, J.-D., Mayer, L., & Schönbächler, M. 2022, MNRAS, 512, 5874 [NASA ADS] [CrossRef] [Google Scholar]
- Jiang, H., Macías, E., Guerra-Alvarado, O. M., & Carrasco-González, C. 2024, A&A, 682, A32 [NASA ADS] [CrossRef] [EDP Sciences] [Google Scholar]
- Johansen, A., & Dorn, C. 2022, A&A, 662, A19 [NASA ADS] [CrossRef] [EDP Sciences] [Google Scholar]
- Johansen, A., & Youdin, A. 2007, ApJ, 662, 627 [Google Scholar]
- Johansen, A., Ronnet, T., Bizzarro, M., et al. 2021, Sci. Adv., 7, eabc0444 [NASA ADS] [CrossRef] [Google Scholar]
- Johansen, A., Ronnet, T., Schiller, M., Deng, Z., & Bizzarro, M. 2023, A&A, 671, A74 [NASA ADS] [CrossRef] [EDP Sciences] [Google Scholar]
- Jongejan, S., Dominik, C., & Dullemond, C. P. 2023, A&A, 679, A45 [NASA ADS] [CrossRef] [EDP Sciences] [Google Scholar]
- Jørgensen, J. K., Visser, R., Williams, J. P., & Bergin, E. A. 2015, A&A, 579, A23 [NASA ADS] [CrossRef] [EDP Sciences] [Google Scholar]
- Kalyaan, A., Pinilla, P., Krijt, S., et al. 2023, ApJ, 954, 66 [NASA ADS] [CrossRef] [Google Scholar]
- Kawasaki, N., Nagashima, K., Sakamoto, N., et al. 2022, Sci. Adv., 8, eade2067 [NASA ADS] [CrossRef] [Google Scholar]
- Kimura, S. S., Kunitomo, M., & Takahashi, S. Z. 2016, MNRAS, 461, 2257 [NASA ADS] [CrossRef] [Google Scholar]
- Kleine, T., Touboul, M., Bourdon, B., et al. 2009, Geochim. Cosmochim. Acta, 73, 5150 [Google Scholar]
- Kleine, T., Budde, G., Burkhardt, C., et al. 2020, Space Sci. Rev., 216, 55 [CrossRef] [Google Scholar]
- Kóspál, Á., Cruz-Sáenz de Miera, F., White, J. A., et al. 2021, ApJS, 256, 30 [CrossRef] [Google Scholar]
- Kóspál, Á., Ábrahám, P., Diehl, L., et al. 2023, ApJ, 945, L7 [CrossRef] [Google Scholar]
- Kruijer, T. S., Fischer-Gödde, M., Kleine, T., et al. 2013, Earth Planet. Sci. Lett., 361, 162 [CrossRef] [Google Scholar]
- Kruijer, T. S., Burkhardt, C., Budde, G., & Kleine, T. 2017, PNAS, 114, 6712 [NASA ADS] [CrossRef] [Google Scholar]
- Kruijer, T. S., Kleine, T., & Borg, L. E. 2020, Nat. Astron., 4, 32 [Google Scholar]
- Kuffmeier, M., Frostholm Mogensen, T., Haugbølle, T., Bizzarro, M., & Nordlund, Ǻ. 2016, ApJ, 826, 22 [NASA ADS] [CrossRef] [Google Scholar]
- Kuffmeier, M., Frimann, S., Jensen, S. S., & Haugbølle, T. 2018, MNRAS, 475, 2642 [NASA ADS] [CrossRef] [Google Scholar]
- Kuffmeier, M., Jensen, S. S., & Haugbølle, T. 2023, Eur. Phys. J. Plus, 138, 272 [NASA ADS] [CrossRef] [Google Scholar]
- Kuznetsova, A., Bae, J., Hartmann, L., & Mac Low, M.-M. 2022, ApJ, 928, 92 [NASA ADS] [CrossRef] [Google Scholar]
- Lambrechts, M., Lega, E., Nelson, R. P., Crida, A., & Morbidelli, A. 2019a, A&A, 630, A82 [NASA ADS] [CrossRef] [EDP Sciences] [Google Scholar]
- Lambrechts, M., Morbidelli, A., Jacobson, S. A., et al. 2019b, A&A, 627, A83 [NASA ADS] [CrossRef] [EDP Sciences] [Google Scholar]
- Larsen, K. K., Trinquier, A., Paton, C., et al. 2011, ApJ, 735, L37 [NASA ADS] [CrossRef] [Google Scholar]
- Larsen, K. K., Wielandt, D., Schiller, M., Krot, A. N., & Bizzarro, M. 2020, Earth Planet. Sci. Lett., 535, 116088 [CrossRef] [Google Scholar]
- Li, M., Huang, S., Petaev, M. I., Zhu, Z., & Steffen, J. H. 2020, MNRAS, 495, 2543 [CrossRef] [Google Scholar]
- Li, M., Huang, S., Zhu, Z., Petaev, M. I., & Steffen, J. H. 2021, MNRAS, 503, 5254 [NASA ADS] [CrossRef] [Google Scholar]
- Li, M., Zhu, Z., Huang, S., et al. 2023, ApJ, 958, 58 [NASA ADS] [CrossRef] [Google Scholar]
- Lichtenberg, T., Drążkowska, J., Schönbächler, M., Golabek, G. J., & Hands, T. O. 2021, Science, 371, 365 [NASA ADS] [CrossRef] [Google Scholar]
- Liu, B., Johansen, A., Lambrechts, M., Bizzarro, M., & Haugbølle, T. 2022, Sci. Adv., 8, eabm3045 [NASA ADS] [CrossRef] [Google Scholar]
- Lodders, K. 2003, ApJ, 591, 1220 [Google Scholar]
- Macías, E., Guerra-Alvarado, O., Carrasco-González, C., et al. 2021, A&A, 648, A33 [EDP Sciences] [Google Scholar]
- Makhatadze, G. V., Schiller, M., & Bizzarro, M. 2023, Geochim. Cosmochim. Acta, 343, 17 [CrossRef] [Google Scholar]
- Manara, C. F., Rosotti, G., Testi, L., et al. 2016, A&A, 591, L3 [NASA ADS] [CrossRef] [EDP Sciences] [Google Scholar]
- Martins, R., Kuthning, S., Coles, B. J., Kreissig, K., & Rehkämper, M. 2023, Science, 379, 369 [NASA ADS] [CrossRef] [Google Scholar]
- Matthews, L. S., Land, V., & Hyde, T. W. 2012, ApJ, 744, 8 [NASA ADS] [CrossRef] [Google Scholar]
- Maury, A. J., André, P., Testi, L., et al. 2019, A&A, 621, A76 [NASA ADS] [CrossRef] [EDP Sciences] [Google Scholar]
- McSween, H. Y., Mittlefehldt, D. W., Beck, A. W., Mayne, R. G., & McCoy, T. J. 2011, Space Sci. Rev., 163, 141 [NASA ADS] [CrossRef] [Google Scholar]
- Menou, K., & Goodman, J. 2004, ApJ, 606, 520 [NASA ADS] [CrossRef] [Google Scholar]
- Miyazaki, Y., & Korenaga, J. 2021, Icarus, 361, 114368 [NASA ADS] [CrossRef] [Google Scholar]
- Morbidelli, A., Baillié, K., Batygin, K., et al. 2022, Nat. Astron., 6, 72 [Google Scholar]
- Mori, S., Bai, X.-N., & Okuzumi, S. 2019, ApJ, 872, 98 [NASA ADS] [CrossRef] [Google Scholar]
- Mori, S., Okuzumi, S., Kunitomo, M., & Bai, X.-N. 2021, ApJ, 916, 72 [NASA ADS] [CrossRef] [Google Scholar]
- Moynier, F., Simon, J. I., Podosek, F. A., et al. 2010, ApJ, 718, L7 [NASA ADS] [CrossRef] [Google Scholar]
- Musiolik, G., & Wurm, G. 2019, ApJ, 873, 58 [NASA ADS] [CrossRef] [Google Scholar]
- Musiolik, G., Teiser, J., Jankowski, T., & Wurm, G. 2016a, ApJ, 818, 16 [Google Scholar]
- Musiolik, G., Teiser, J., Jankowski, T., & Wurm, G. 2016b, ApJ, 827, 63 [NASA ADS] [CrossRef] [Google Scholar]
- Nakanishi, N., Yokoyama, T., Ishikawa, A., et al. 2023, Geochem. Perspect. Lett., 28, 31 [NASA ADS] [CrossRef] [Google Scholar]
- Nanne, J. A. M., Nimmo, F., Cuzzi, J. N., & Kleine, T. 2019, Earth Planet. Sci. Lett., 511, 44 [CrossRef] [Google Scholar]
- Nguyen, A. N., Mane, P., Keller, L. P., et al. 2023, Sci. Adv., 9, eadh1003 [NASA ADS] [CrossRef] [Google Scholar]
- Nicolussi, G. K., Pellin, M. J., Lewis, R. S., et al. 1998, Geochim. Cosmochim. Acta, 62, 1093 [CrossRef] [Google Scholar]
- Nie, N. X., Wang, D., Torrano, Z. A., et al. 2023, Science, 379, 372 [NASA ADS] [CrossRef] [Google Scholar]
- Nittler, L. R., & Ciesla, F. 2016, ARA&A, 54, 53 [NASA ADS] [CrossRef] [Google Scholar]
- Nomura, H. 2002, ApJ, 567, 587 [NASA ADS] [CrossRef] [Google Scholar]
- Ohashi, S., Momose, M., Kataoka, A., et al. 2023, ApJ, 954, 110 [NASA ADS] [CrossRef] [Google Scholar]
- Okuzumi, S. 2009, ApJ, 698, 1122 [Google Scholar]
- Onyett, I. J., Schiller, M., Makhatadze, G. V., et al. 2023, Nature, 619, 539 [NASA ADS] [CrossRef] [Google Scholar]
- Pape, J., Mezger, K., Bouvier, A. S., & Baumgartner, L. P. 2019, Geochim. Cosmochim. Acta, 244, 416 [NASA ADS] [CrossRef] [Google Scholar]
- Pérez, L. M., Chandler, C. J., Isella, A., et al. 2015, ApJ, 813, 41 [CrossRef] [Google Scholar]
- Pignatale, F. C., Gonzalez, J. F., Cuello, N., Bourdon, B., & Fitoussi, C. 2017, MNRAS, 469, 237 [NASA ADS] [CrossRef] [Google Scholar]
- Pinilla, P., Benisty, M., & Birnstiel, T. 2012, A&A, 545, A81 [NASA ADS] [CrossRef] [EDP Sciences] [Google Scholar]
- Piso, A.-M. A., Öberg, K. I., Birnstiel, T., & Murray-Clay, R. A. 2015, ApJ, 815, 109 [Google Scholar]
- Pringle, J. E. 1981, ARA&A, 19, 137 [NASA ADS] [CrossRef] [Google Scholar]
- Qin, L., & Carlson, R. W. 2016, Geochem. J., 50, 43 [NASA ADS] [CrossRef] [Google Scholar]
- Qin, L., Alexander, C. M. O. D., Carlson, R. W., Horan, M. F., & Yokoyama, T. 2010, Geochim. Cosmochim. Acta, 74, 1122 [NASA ADS] [CrossRef] [Google Scholar]
- Reipurth, B., & Aspin, C. 2004, ApJ, 608, L65 [Google Scholar]
- Ros, K., & Johansen, A. 2013, A&A, 552, A137 [NASA ADS] [CrossRef] [EDP Sciences] [Google Scholar]
- Savage, P. S., Moynier, F., & Boyet, M. 2022, Icarus, 386, 115172 [NASA ADS] [CrossRef] [Google Scholar]
- Schäfer, U., & Johansen, A. 2022, A&A, 666, A98 [NASA ADS] [CrossRef] [EDP Sciences] [Google Scholar]
- Schiller, M., Paton, C., & Bizzarro, M. 2015, Geochim. Cosmochim. Acta, 149, 88 [NASA ADS] [CrossRef] [Google Scholar]
- Schiller, M., Connelly, J. N., & Bizzarro, M. 2017, Meteorit. Planet. Sci., 52, 1233 [NASA ADS] [CrossRef] [Google Scholar]
- Schiller, M., Bizzarro, M., & Fernandes, V. A. 2018, Nature, 555, 507 [Google Scholar]
- Schiller, M., Bizzarro, M., & Siebert, J. 2020, Sci. Adv., 6, eaay7604 [NASA ADS] [CrossRef] [Google Scholar]
- Schneider, J. M., Burkhardt, C., Marrocchi, Y., Brennecka, G. A., & Kleine, T. 2020, Earth Planet. Sci. Lett., 551, 116585 [CrossRef] [Google Scholar]
- Scholz, A., Froebrich, D., & Wood, K. 2013, MNRAS, 430, 2910 [Google Scholar]
- Schoonenberg, D., Okuzumi, S., & Ormel, C. W. 2017, A&A, 605, A2 [NASA ADS] [CrossRef] [EDP Sciences] [Google Scholar]
- Scott, E. R. D., & Krot, A. N. 2014, in Meteorites and Cosmochemical Processes, 1, ed. A. M., Davis, 65 [Google Scholar]
- Shakura, N. I., & Sunyaev, R. A. 1973, A&A, 500, 33 [NASA ADS] [Google Scholar]
- Spitzer, F., Burkhardt, C., Budde, G., et al. 2020, ApJ, 898, L2 [NASA ADS] [CrossRef] [Google Scholar]
- Spitzer, F., Burkhardt, C., Nimmo, F., & Kleine, T. 2021, Earth Planet. Sci. Lett., 576, 117211 [CrossRef] [Google Scholar]
- Stammler, S. M., Lichtenberg, T., Drążkowska, J., & Birnstiel, T. 2023, A&A, 670, L5 [NASA ADS] [CrossRef] [EDP Sciences] [Google Scholar]
- Steele, R. C. J., Coath, C. D., Regelous, M., Russell, S., & Elliott, T. 2012, ApJ, 758, 59 [NASA ADS] [CrossRef] [Google Scholar]
- Steller, T., Burkhardt, C., Yang, C., & Kleine, T. 2022, Icarus, 386, 115171 [NASA ADS] [CrossRef] [Google Scholar]
- Stephan, T., & Davis, A. M. 2021, ApJ, 909, 8 [NASA ADS] [CrossRef] [Google Scholar]
- Sugiura, N., & Fujiya, W. 2014, Meteorit. Planet. Sci., 49, 772 [NASA ADS] [CrossRef] [Google Scholar]
- Tobin, J. J., van't Hoff, M. L. R., Leemker, M., et al. 2023, Nature, 615, 227 [NASA ADS] [CrossRef] [Google Scholar]
- Trinquier, A., Birck, J.-L., & Jean Allègre, C. 2006, Earth Planet. Sci. Lett., 241, 780 [CrossRef] [Google Scholar]
- Trinquier, A., Birck, J.-L., & Allègre, C. J. 2007, ApJ, 655, 1179 [NASA ADS] [CrossRef] [Google Scholar]
- Trinquier, A., Elliott, T., Ulfbeck, D., et al. 2009, Science, 324, 374 [Google Scholar]
- Tychoniec, Ł., Manara, C. F., Rosotti, G. P., et al. 2020, A&A, 640, A19 [NASA ADS] [CrossRef] [EDP Sciences] [Google Scholar]
- Valdivia-Mena, M. T., Pineda, J. E., Segura-Cox, D. M., et al. 2022, A&A, 667, A12 [NASA ADS] [CrossRef] [EDP Sciences] [Google Scholar]
- Van Kooten, E. M. M. E., Wielandt, D., Schiller, M., et al. 2016, PNAS, 113, 2011 [NASA ADS] [CrossRef] [Google Scholar]
- van Kooten, E. M. M. E., Schiller, M., & Bizzarro, M. 2017, Geochim. Cosmochim. Acta, 208, 1 [CrossRef] [Google Scholar]
- van Kooten, E., Cavalcante, L., Wielandt, D., & Bizzarro, M. 2020, Meteorit. Planet. Sci., 55, 575 [NASA ADS] [CrossRef] [Google Scholar]
- van Kooten, E., Schiller, M., Moynier, F., et al. 2021, ApJ, 910, 70 [NASA ADS] [CrossRef] [Google Scholar]
- Visser, R., & Bergin, E. A. 2012, ApJ, 754, L18 [NASA ADS] [CrossRef] [Google Scholar]
- Vorobyov, E. I., & Basu, S. 2005, ApJ, 633, L137 [NASA ADS] [CrossRef] [Google Scholar]
- Warren, P. H. 2011, Earth Planet. Sci. Lett., 311, 93 [Google Scholar]
- Weidenschilling, S. J. 1977, MNRAS, 180, 57 [Google Scholar]
- Wood, B. J., Smythe, D. J., & Harrison, T. 2019, Am. Mineralogist, 104, 844 [NASA ADS] [CrossRef] [Google Scholar]
- Yang, H., & Bai, X.-N. 2021, ApJ, 922, 201 [CrossRef] [Google Scholar]
- Yokoyama, T., Nagai, Y., Fukai, R., & Hirata, T. 2019, ApJ, 883, 62 [NASA ADS] [CrossRef] [Google Scholar]
- Youdin, A. N., & Goodman, J. 2005, ApJ, 620, 459 [Google Scholar]
- Zagaria, F., Clarke, C. J., Booth, R. A., Facchini, S., & Rosotti, G. P. 2023, ApJ, 959, L15 [NASA ADS] [CrossRef] [Google Scholar]
- Zhu, Z., Hartmann, L., Calvet, N., et al. 2007, ApJ, 669, 483 [NASA ADS] [CrossRef] [Google Scholar]
- Zhu, Z., Hartmann, L., Gammie, C., & McKinney, J. C. 2009, ApJ, 701, 620 [CrossRef] [Google Scholar]
- Zhu, K., Liu, J., Moynier, F., et al. 2019, ApJ, 873, 82 [NASA ADS] [CrossRef] [Google Scholar]
- Zhu, K., Moynier, F., Schiller, M., & Bizzarro, M. 2020, ApJ, 894, L26 [NASA ADS] [CrossRef] [Google Scholar]
- Zhu, K., Schiller, M., Moynier, F., et al. 2023, Geochim. Cosmochim. Acta, 342, 156 [CrossRef] [Google Scholar]
- Zhu, Z., Stone, J. M., & Calvet, N. 2024, MNRAS, 528, 2883 [NASA ADS] [CrossRef] [Google Scholar]
- Zsom, A., Ormel, C. W., Güttler, C., Blum, J., & Dullemond, C. P. 2010, A&A, 513, A57 [NASA ADS] [CrossRef] [EDP Sciences] [Google Scholar]
All Tables
All Figures
|
Fig. 1 Gas surface density, gas temperature, and pebble surface density evolution for the Nominal disk model. (a) The mass in the inner disk decreases in time due to accretion onto the central star, whereas the mass in the outer gas disk expands into wider orbits to conserve angular momentum. (b) At early times the midplane temperature inside 30 AU is dominated by viscous heating and the outer part of the disk is heated by irradiation from the central star. (c) Solid lines show the distribution of the unprocessed pebbles that are located behind the water ice line (see Sec. 2.4). After ~1 Myr the inner surface density increases since a fraction of these solids moves inward due to radial drift. These pebbles subsequently sublimate at the water evaporation evaporation front now located near approximately 1 AU. The surface density of this vapor component is shown with the dashed lines. |
| In the text | |
|
Fig. 2 Temperature structure evolution for the (a) Nominal and (b) Compact cases. The colorbar shows the disk temperature at the midplane. The dashed gray line shows the location where the gas advection changes direction: the material inside the line is accreted onto the star and the material outside is moved outward due to the viscous expansion of the gas disk. The solid and dash-dotted lines correspond to the location of the water and silicates sublimation lines with temperatures of 160 K and 1314 K, respectively. |
| In the text | |
|
Fig. 3 Time evolution of the distribution of processed and unprocessed pebbles, for the Nominal case (left panels) and the Compact case (right panels). The top plots show the pebble flux evolution for the processed (red) and unprocessed (blue) pebble components at two different radii (full line 1 AU and dashed line 5 AU). The bottom panels illustrate the evolution of the mass fraction of unprocessed pebbles, following the color code of the legend, at different radii and times in the disk. In the Compact case, the processed component is more efficiently advected outward initially compared to the Nominal case. This results in more mixing with the unprocessed pebbles, but also in loosing most pebbles from the disk within already 2 Myr. |
| In the text | |
|
Fig. 4 Temperature evolution for disks that include a luminosity outburst of 1000 L⊙. Both cases have an initial disk radius of 20 AU. Panel a shows a disk that includes viscous heating, and panel b shows a disk that only has heating from irradiation. In the disk of theOutburst model (panel a), the sublimation lines move slowly inward due to the contribution from viscous heating, which eventually decreases, but the material in the inner disk of the Outburst-NoVisc model (panel b) is too cold for the silicate lines to be present. |
| In the text | |
|
Fig. 5 Same as Fig. 3, but for the Outburst model. The location of the water sublimation line, which separates the processed and unprocessed pebbles and is indicated by the solid line, is located beyond the location where the gas velocity reverses (rH2O > rυ=0), indicated by the dashed line, at the time of the outburst. As a result, we see substantial mixing of both up and p pebbles even at late times. |
| In the text | |
|
Fig. 6 Same as Fig. 3, but for the outburst models that do not include viscous heating (Small-outburst, Med-outburst and Outburst-NoVisc). |
| In the text | |
|
Fig. 7 Thermal processing of icy grains. Panel a shows the state of the disk before a stellar outburst. The blue dash line represents the water ice line, the gray dashed line the radial location (rυ=0) that separates the inward- and outward-drifting pebbles, and the black-outlined region the terrestrial-planet-forming region. During an outburst (panel b) the ice line moves outward and particles in the inner disk lose their icy mantles containing isotopically anomalous grains. Afterward, the disk cools down and the iceline retreats (panel c) resulting in the inner disk with a mixture of processed and unprocessed grains, altering the solid composition from NC- to OC-like. However, on longer timescales evermore unprocessed pebbles drift inward resulting in a pebble composition that is close to CI outside the water ice line (panel d). |
| In the text | |
|
Fig. 8 Evolution of the mass fraction of unprocessed pebbles with time at different locations in the disk (contours). The bold black line represents the inner disk composition at 1 AU. The symbols show normalized nucleosynthetic measurements, for different elements as indicated by the legend. The different meteorite classes are colored from red to blue. The corresponding estimates for their accretion ages are given with vertical error bars (or upper limit arrows), slightly displaced for the different elements for visibility. Horizontal error bars are the uncertainties on the normalized nucleosynthetic composition. |
| In the text | |
|
Fig. 9 Same as Fig. 8, but for models with less intense outbursts (Small-outburst and Med-outburst). The outbursts in these cases are not strong enough to push the ice line sufficiently outward. This prevents a long-lived mixing of the processed and unprocessed components, which in our model is needed to match the isotopic differences. |
| In the text | |
|
Fig. 10 Pebble flux evolution for the Outburst-NoVisc model with different particle sizes. Panel a shows the case with Rp = 1 mm particles, panel b the case with Rp = 0.01 mm particles, and panel c shows a simulation with a varying particle size for each pebble component. Increasing the particle size decreases the lifetime of the pebble disk, due to increased pebble drift rates. If the different pebbles species have different particle radii, large particles in the outer disk can drift inward before smaller processed pebbles are first diffused outward and subsequently later drift inward. |
| In the text | |
|
Fig. A.1 Evolution of the mass fraction of unprocessed pebbles for a late outburst model. Panels (a) and (b): Evolution of the mass fraction of up Late-Outburst, where the outburst is introduced at tout = 105 yr (similar to Figure 3). Panel (c): Evolution of the mass fraction of up pebbles compared to isotopic compositions of meteorites for the Late-Outburst model (similar to Fig. 8). |
| In the text | |
|
Fig. B.1 Pebble flux evolution for the Outburst-NoVisc model using viscosities of α = 0.005 (a) and α = 0.001 (b). |
| In the text | |
|
Fig. B.2 Unprocessed mass fraction evolution for the Outburst-NoVisc model using viscosities of α = 0.005 (a) and α = 0.001(b), similar to Fig. 8 |
| In the text | |
|
Fig. C.1 Nucleosynthetic measurements for each of the isotopes considered in this work. Each panel represents a different element. The different meteorite classes are red to blue colored, and the horizontal error bars are the uncertainties on the nucleosynthetic composition. The corresponding estimates for their accretion ages are given with vertical error bars (or upper limit arrows). The upper axis represents the normalized values, similar to Fig. 8. The normalization is discussed in the text. The contours show the evolution of the mass fraction of unprocessed pebbles with time at different locations in the disk. The bold black line represents the inner disk composition at 1AU. |
| In the text | |
|
Fig. D.1 Mo isotope compositions of the CC and NC meteorite groups in a μ94Mo versus μ95Mo diagram (using the same color scheme as in Fig. 8). The blue CC-line fit is taken from Budde et al. (2016). NC meteorites are plotted close to an s-process mixing line through ureilite (thick red s-Ur line). Thin contours give the unprocessed mass fraction encompassing the OC and EC chondrites. The dashed gray line represents the line fit through the NC group obtained by Yokoyama et al. (2019). Literature data sources: CI (Burkhardt et al. 2011), CO (Burkhardt et al. 2014), CV, OC, EC (Yokoyama et al. 2019), ureilites, angrites, and mesosiderites (Budde et al. 2018). The mesosiderites may represent Vesta-like material (Haba et al. 2019). |
| In the text | |
|
Fig. E.1 Evolution of the mass fraction of unprocessed pebbles for the Nominal and Compact models (similar to Fig. 8). Here, the Nominal model is shown with solid lines (thick black line is 1 AU, the subsequent gray lines show the 10 AU, 50 AU and 80 AU contours), while the dashed lines show the Compact model. |
| In the text | |
Current usage metrics show cumulative count of Article Views (full-text article views including HTML views, PDF and ePub downloads, according to the available data) and Abstracts Views on Vision4Press platform.
Data correspond to usage on the plateform after 2015. The current usage metrics is available 48-96 hours after online publication and is updated daily on week days.
Initial download of the metrics may take a while.