Fig. C.1
Download original image
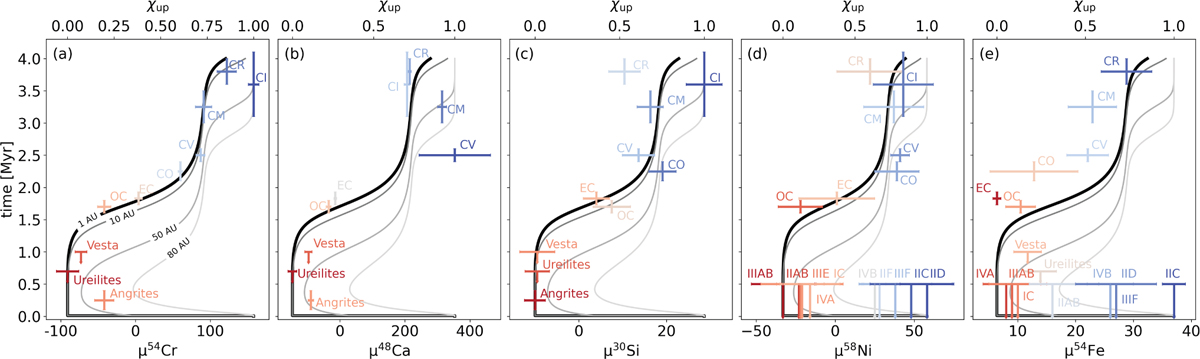
Nucleosynthetic measurements for each of the isotopes considered in this work. Each panel represents a different element. The different meteorite classes are red to blue colored, and the horizontal error bars are the uncertainties on the nucleosynthetic composition. The corresponding estimates for their accretion ages are given with vertical error bars (or upper limit arrows). The upper axis represents the normalized values, similar to Fig. 8. The normalization is discussed in the text. The contours show the evolution of the mass fraction of unprocessed pebbles with time at different locations in the disk. The bold black line represents the inner disk composition at 1AU.
Current usage metrics show cumulative count of Article Views (full-text article views including HTML views, PDF and ePub downloads, according to the available data) and Abstracts Views on Vision4Press platform.
Data correspond to usage on the plateform after 2015. The current usage metrics is available 48-96 hours after online publication and is updated daily on week days.
Initial download of the metrics may take a while.