Fig. 3
Download original image
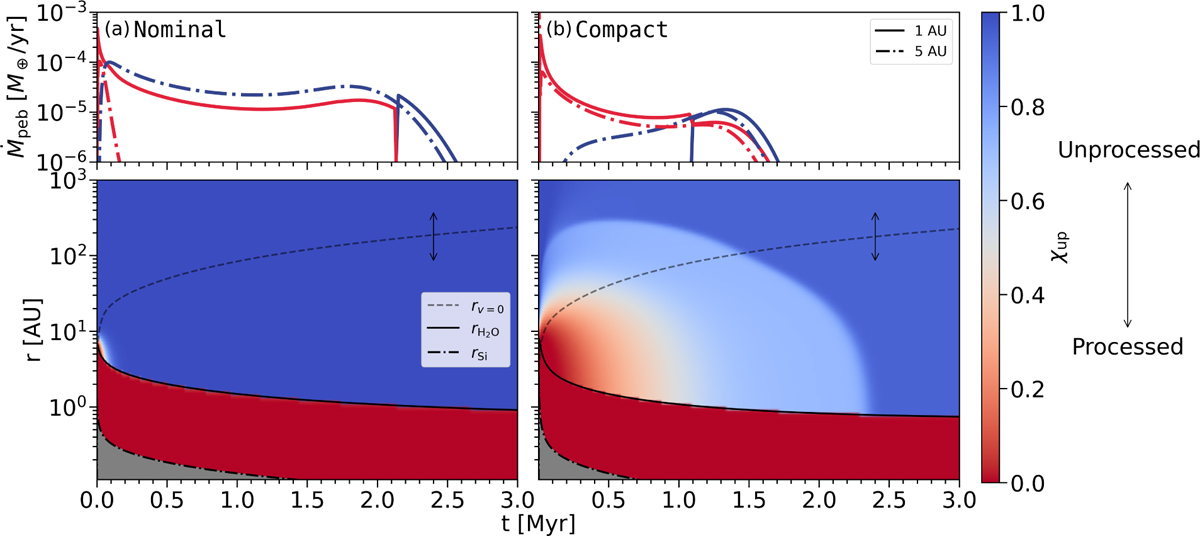
Time evolution of the distribution of processed and unprocessed pebbles, for the Nominal case (left panels) and the Compact case (right panels). The top plots show the pebble flux evolution for the processed (red) and unprocessed (blue) pebble components at two different radii (full line 1 AU and dashed line 5 AU). The bottom panels illustrate the evolution of the mass fraction of unprocessed pebbles, following the color code of the legend, at different radii and times in the disk. In the Compact case, the processed component is more efficiently advected outward initially compared to the Nominal case. This results in more mixing with the unprocessed pebbles, but also in loosing most pebbles from the disk within already 2 Myr.
Current usage metrics show cumulative count of Article Views (full-text article views including HTML views, PDF and ePub downloads, according to the available data) and Abstracts Views on Vision4Press platform.
Data correspond to usage on the plateform after 2015. The current usage metrics is available 48-96 hours after online publication and is updated daily on week days.
Initial download of the metrics may take a while.