| Issue |
A&A
Volume 684, April 2024
|
|
|---|---|---|
| Article Number | A65 | |
| Number of page(s) | 15 | |
| Section | Extragalactic astronomy | |
| DOI | https://doi.org/10.1051/0004-6361/202348208 | |
| Published online | 04 April 2024 | |
Investigating X-ray emission in the GeV-emitting compact symmetric objects PKS 1718–649 and TXS 1146+596
1
Dipartimento di Fisica e Astronomia “Augusto Righi”, Università di Bologna, Via P. Gobetti 93/2, 40129 Bologna, Italy
2
INAF, Astrophysics and Space Science Observatory Bologna, Via P. Gobetti 93/3, 40129 Bologna, Italy
e-mail: This email address is being protected from spambots. You need JavaScript enabled to view it.
3
INAF, Istituto di Radioastronomia, Via P. Gobetti 101, 40129 Bologna, Italy
4
Center for Astrophysics | Harvard & Smithsonian, 60 Garden Street, Cambridge, MA 02138, USA
5
Astronomical Observatory of the Jagiellonian University, ul. Orla 171, 30-244 Kraków, Poland
6
Dipartimento di Fisica, Università di Trieste, 34127 Trieste, Italy
7
INFN, Sezione di Trieste, 34127 Trieste, Italy
8
National Tsing Hua University, Kuang-Fu Road, Hsinchu 30013, Taiwan, ROC
Received:
9
October 2023
Accepted:
29
January 2024
Abstract
Aims. Compact symmetric objects (CSOs) are thought to represent the first step in the evolutionary path of radio galaxies. In the present study, we investigated the X-ray emission of two CSOs confirmed to emit at GeV energies: PKS 1718–649 and TXS 1146+596. Unveiling the origin of their observed high-energy emission is crucial to establishing the physical parameters of the radio source and understanding how CSOs interact with the surrounding medium.
Methods. We combined archival and new NuSTAR observations of PKS 1718–649 and TXS 1146+596 to have broadband X-ray coverage. For both sources, we modeled the broadband spectral energy distribution (SED) from the radio band up to γ-rays in order to derive their physical parameters. We also discuss the role of the ambient medium in confining the source expansion, which we investigate using X-ray obscuration.
Results. For the first time, we report X-ray detections of PKS 1718–649 and 1146+596 with NuSTAR at energies higher than 10 keV. Combining Chandra and NuSTAR observations of TXS 1146+596, we reveal the presence of a multitemperature thermal component dominating the soft X-ray spectrum, and we interpret this finding as indicative of an AGN feedback process in action in this source. In addition, we show that two emitting electron populations are necessary to reproduce the observed broadband SED of TXS 1146+596: in our models, the X-ray emission could either be produced by synchrotron radiation or by a weak X-ray corona, or could be an ADAF-type emission. Interestingly, an additional X-ray component, namely a weak corona, is also required for PKS 1718–649. Moreover, we argue that heavily obscured and possibly frustrated sources tend to show different radio sizes with respect to those that are unobscured and free to expand.
Key words: radiation mechanisms: non-thermal / galaxies: active / galaxies: jets / X-rays: galaxies
© The Authors 2024
 Open Access article, published by EDP Sciences, under the terms of the Creative Commons Attribution License (https://creativecommons.org/licenses/by/4.0), which permits unrestricted use, distribution, and reproduction in any medium, provided the original work is properly cited.
This article is published in open access under the Subscribe to Open model. This email address is being protected from spambots. You need JavaScript enabled to view it. to support open access publication.
1. Introduction
Compact symmetric objects (CSOs), which are defined as sources with radio lobes on both sides of an active nucleus and viewed from the direction perpendicular to the direction of the lobes’ expansion, and have an overall size of less than about 1 kpc, are thought to represent the first step in the evolutionary path of radio galaxies (see Readhead et al. 1994, 1996a,b; Readhead et al. 2021, for reviews on CSOs). In addition to these standard criteria, Kiehlmann et al. (2024) recently introduced two additional ones for CSO classification: (i) these sources show fluctuations in flux density, which have to be lower than ∼10% of the total flux density on yearly timescales, and (ii) the observed speed of the components moving along the jets is less than 2.5 c in any jet component. With these criteria, these latter authors compiled a sample of 79 bona fide CSOs, including 26 CSOs detected at high energies (X-rays and/or γ-rays).
While the CSO classification is based on their radio morphology, from the spectral point of view, young radio sources are characterized by a convex peaked synchrotron radio spectrum and are generally split into two classes: compact steep-spectrum (CSS) sources, which have a peak frequency of below about 400–500 MHz, and gigahertz-peaked-spectrum (GPS) sources, which show a peak of between ∼500 MHz and a few gigahertz (see O’Dea & Baum 1997; Orienti 2016; O’Dea & Saikia 2021, for complete reviews on the radio properties of CSS and GPS sources). In addition to these, Dallacasa et al. (2000) introduced a further subclass, the high-frequency peakers (HFPs), defined as those with a peak at 5 GHz or even higher in the radio spectrum.
The idea that CSOs are characteristically young is still a matter of debate. These sources might be compact because they are confined by interaction with dense clouds in the host galaxy interstellar medium (ISM; e.g., van Breugel et al. 1984; O’Dea et al. 1991; Dicken et al. 2012), or they might go through a transient or intermittent phase of radio activity due to for example pressure instabilities in accretion disks (Czerny et al. 2009). Jet disruption is another way of producing short-lived radio sources (e.g., De Young 1991; Sutherland & Bicknell 2007; Wagner & Bicknell 2011; Bicknell et al. 2018; Mukherjee et al. 2018), as is a limited fuel supply to power the jets, for example by a star capture (Readhead et al. 1994).
Studies of young radio sources at high energies are useful for constraining important parameters, such as the accretion and jet power, thus shedding light on their evolution. Furthermore, X-rays are important for determining how these sources release energy into the surrounding medium (if in radiative or mechanical form), which makes them equally important for studying the feedback between CSOs and their host galaxies (see Siemiginowska 2009, for a review about the X-ray properties of GPS and CSS sources). There are several hypotheses as to the origin of the X-ray emission in CSOs. It is possible that it is produced primarily by a so-called corona above the accretion disk (e.g., Tengstrand et al. 2009). However, it is also possible that the X-ray emission is produced in the jets or lobes of the radio source via inverse Compton (IC) scattering off different seed photons (i.e., ultraviolet photons from the accretion disk, infrared photons of the dusty torus, or synchrotron photons from different regions in the jets or lobes; Stawarz et al. 2008; Ostorero et al. 2010; Migliori et al. 2014) and/or by an expanding cocoon that impacts and shocks the ISM of the host galaxy (Ito et al. 2011; Kino et al. 2013). Due to the milliarcsecond-scale linear radio sizes, CSOs remain unresolved by current X-ray facilities. Therefore, their X-ray morphologies on the scales of their radio lobes cannot be obtained. At the same time, their X-ray spectra are typically described by a power-law model with photon indices in the range Γ ≃ 1.4 − 1.7 and luminosities of the order of ℒ2 − 10 keV ≃ 1041 − 1045 erg s−1 (Siemiginowska et al. 2016; Sobolewska et al. 2019a, S19): these parameters can equally well model both a hot corona and jets or lobes as the origin for the X-ray emission making it difficult to establish the origin of the observed emission.
X-ray observations also provide useful information on the environment surrounding CSOs. The soft band (≲2 keV) of their X-ray spectra often reveals the presence of an obscuring medium (NH ≃ 1021 − 1024 cm−2, Siemiginowska et al. 2016). S19 identified CSOs with moderate-to-high intrinsic hydrogen column densities (NH > 1023 cm−2), which, in a linear size versus radio luminosity (at 5 GHz) plot, appear to form a branch characterized by smaller sizes than CSOs that have the same 5 GHz luminosity but low intrinsic column densities (NH ≲ 1022 cm−2). This finding suggests that a dense medium in X-ray-obscured CSOs may be able to confine the radio jets, or slow down their expansion. Alternatively, X-ray-obscured CSOs could be brighter in the radio band than their unobscured counterparts because the high-density environments ensure high accretion rates and possibly high jet powers.
Moreover, since the first hard X-ray (> 10 keV) detection of a CSO (OQ+208, Sobolewska et al. 2019b), it has been clear that broadband X-ray spectra are necessary to fully characterize the properties of CSOs and to probe the medium surrounding the expanding radio source. In particular, NuSTAR observations allow us to extend the X-ray analyses up to a few tens of keV, overcoming issues due to obscuration and better constraining the primary X-ray emission of the sources.
According to theoretical models, the jets and lobes of young radio sources could be the site of production of γ-ray emission (Stawarz et al. 2008; Ostorero et al. 2010; Migliori et al. 2014). For CSOs, the model presented in Stawarz et al. (2008) predicts an isotropic nonthermal emission in the 0.1 − 100 GeV band produced in the radio lobes, with luminosities between 1041 erg s−1 and 1046 erg s−1 depending on the source parameters. Alternatively, Kino & Asano (2011) discussed a possible hadronic origin for the γ-ray emission in the compact lobes of CSOs. Currently, only a handful of young radio galaxies have been detected in γ-rays by Fermi-LAT (see Migliori et al. 2016; Principe et al. 2020, 2021; Lister et al. 2020). Young radio galaxies are γ-ray faint, not significantly variable, and have γ-ray photon indices (typically Γ ≃ 2.0 − 2.6) and luminosities (generally ℒ0.1 − 100 GeV ≃ 0.9 − 1.1 × 1044 erg s−1, up to ℒ0.1 − 100 GeV ≃ 1 × 1045 erg s−1) similar to misaligned jetted AGN (Principe et al. 2021). Such features are in principle compatible with the origin of the γ-ray emission (or a fraction of it) in the lobes.
Combining X-ray and γ-ray information with data from other bands allows us to build and model the spectral energy distribution (SED) of the sources, from which we can derive constraints on their physical properties and total jet power. Comparing the inferred results with the most recent numerical simulations of jet–ISM interaction (e.g., Mukherjee et al. 2017) allows us to make predictions as to the fate of the sources. The case of PKS 1718–649 provides a good illustration of the relevance of a γ-ray detection to our understanding of the origin of the high-energy emission in young radio sources. Sobolewska et al. (2022) performed novel modeling of the radio-to-γ-ray SED of PKS 1718–649. The symmetric morphology rules out significant beamed emission from a jet. These authors therefore applied the dynamic and radiative model of Stawarz et al. (2008) to investigate the emission of the mini radio lobes. They showed that, in the framework of this model, the γ-ray emission is reproduced by IC of the UV photons from an accretion disk off energetic electrons in the mini radio lobes. Based on their modeling, Sobolewska et al. (2022) were able to estimate important physical parameters of the source. A moderate departure from energy equipartition conditions, with the energy density of the particles dominating over the magnetic field, is required to reproduce the high-energy emission. The model infers a jet kinetic power of ℒkin ≃ 2.2 × 1042 erg s−1, in agreement with the upper limit of ℒjet ≲ 2 × 1043 erg s−1 reported in Maccagni et al. (2014) based on constrains from very long baseline interferometry (VLBI) observations by Tingay et al. (2002).
The cases of PKS 1718–649 and OQ+208 show that a detection in γ-rays as well as broadening of the observing X-ray window can be strategic to unveiling the nature of high-energy emission in CSOs. In the present work, we adopt this approach to study a sample of two CSOs. Our major aims are to (i) investigate the nature of their X-ray and γ-ray emission, (ii) constrain their physical parameters from their broadband (radio-to-γ-ray) SED, and to (iii) probe the environment in which the sources are expanding.
The paper is organized as follows: in Sect. 2, we present the selected sample. In Sects. 3 and 4 we describe the data reduction process and the X-ray analysis performed, respectively. In Sect. 5 we present the broadband SED modeling of the sources. We then conclude, discussing the role of the ambient medium in the evolution of radio galaxies, and present our results concerning the origin of high-energy emission in CSOs (Sect. 6). Throughout this paper, we assume a flat ΛCDM cosmology and use the most recent estimates of the cosmological parameters (Planck Collaboration VI 2020): Ωm = 0.315, ΩΛ = 0.685, and H0 = 67.4 km s−1Mpc−1.
2. Sample selection
For this work, we selected two young radio sources in the sample of bona fide CSOs compiled by Kiehlmann et al. (2024), which are confirmed to be γ-ray emitters (Migliori et al. 2016; Principe et al. 2020, 2021; Ajello et al. 2020), with a detection significance of σ ≥ 5: PKS 1718–649 (hereafter 1718–649, also known as NGC 6328) and TXS 1146+596 (hereafter 1146+596, also known as NGC 3894). In addition to the archival X-ray data, we obtained NuSTAR observations of the two sources to characterize their X-ray spectrum at > 10 keV. The basic properties of each source are provided in Table 1. In the following, we briefly summarize the results of previous multiwavelength studies.
Main properties of the selected sample.
2.1. 1718–649
CSO 1718–649, hosted in the galaxy NGC 6328 (z ≃ 0.014 Meyer et al. 2004), is one of the most thoroughly studied CSOs. The host galaxy shows a prominent nuclear bulge surrounded by spiral arms of very low surface brightness, which makes its classification uncertain between an S0 or SAB(s)ab galaxy (Maccagni et al. 2014, and references therein). Spectroscopic observations in the mid-infrared band show features typical of star-forming gas (SFR ≃ 0.8 − 1.9 ℳ⊙ yr−1, Willett et al. 2010).
1718–649 has been extensively studied in the radio band (Bolton & Butler 1975; Gregory et al. 1994; Healey et al. 2007; Wright & Otrupcek 1990; Veron-Cetty et al. 1995; Tingay et al. 1997, 2015; Tingay & de Kool 2003; Ricci et al. 2006; Sadler et al. 2006; Massardi et al. 2008, 2009; Murphy et al. 2010; Maccagni et al. 2014; Bennett et al. 2003; Chen et al. 1995; Wright et al. 2009; Gold et al. 2011). VLBI observations at 4.8 GHz unveiled two mini lobes with a linear size of LS ≃ 2 pc (Tingay et al. 1997; Tingay & de Kool 2003; Angioni et al. 2019), while the radio core remains undetected even at 22 GHz (Tingay & de Kool 2003). The hotspot advance velocity, ∼0.07 c (Giroletti & Polatidis 2009), implies a kinematic age of about τj ≃ 100 years. Tingay et al. (2015) showed that the low-energy radio spectrum is shaped by synchrotron self-absorption and free-free absorption processes. The presence of an inhomogeneous absorbing medium close to the black hole, which could possibly be the gas fuelling the AGN, is also supported by ALMA observations in the submillimeter (submm) band (Maccagni et al. 2018). Furthermore, high-quality optical spectra of NGC 6328 obtained by Filippenko (1985) show that high-density (106 − 107 cm−3) clouds exist within ∼500 pc of the nucleus and that photo-ionization is the most favored mechanism responsible for the strong optical emission lines. A weak nonstellar power-law component in the optical spectrum is related to the AGN, which is classified as a low-ionization nuclear emission-line region (LINER, Heckman 1980). Estimates of the SMBH mass are of a few 108 ℳ⊙ based on the measurement of the transition of [O IV] at 25.8 μm (Willett et al. 2010).
In X-rays, the source was first detected with Chandra by Siemiginowska et al. (2016), who identified an unresolved, moderately absorbed (NH = (0.08±0.07) × 1022 cm−2) nonthermal (Γ = 1.6 ± 0.2) component, and detected the presence of an extended, diffuse component. Later, combining Chandra and XMM-Newton observations, Beuchert et al. (2018) refined the spectral parameters of the point-like component ( ) and investigated the nature of the extended emission. The latter appears to be due to two components: a gas photoionized by the central AGN (
 ) and a collisionally ionized plasma (
 ) related to the supernova activity in the host galaxy. In addition, these latter authors reported variability in the intrinsic equivalent hydrogen column density and flux by approximately a factor of 2 over a timescale of 7 years. We note that Beuchert et al. (2018) reported a source-intrinsic column density varying in the range NH = 0.3 − 0.7 × 1022 cm−2, that is about one order of magnitude higher than the values reported in Siemiginowska et al. (2016): we ascribe this difference to the different choice of the Galactic absorption taken into account. In particular, Siemiginowska et al. (2016) assumed NH, Gal = 7.15 × 1020 cm−2, while Beuchert et al. (2018)NH, Gal = 5.7 × 1019 cm−2. From the latest estimates by HI4PI Collaboration (2016), the Galactic attenuation is of the order of NH, Gal = 5.9 × 1020 cm−2, and we therefore assumed this value for our analyses.
1718–649 is the first confirmed GPS radio galaxy to be detected in γ-rays (Migliori et al. 2016). The source is listed in the Fourth Fermi-LAT catalog of γ-ray AGN (4LAC, Ajello et al. 2020). The source is detected at σ ≃ 6 in about 11 years of Fermi-LAT data by Principe et al. (2021): the authors reported a 0.1-100 GeV flux of ℱ0.1 − 100 GeV = (5.30±1.86) × 10−9 ph cm−2 s−1 and a corresponding luminosity of ℒ1 − 100 GeV ≃ 1.1 × 1042 erg s−1, with a power-law photon index of ΓLAT = 2.54 ± 0.17. No significant γ-ray variability was found. The rich radio-to-γ-ray dataset enabled the first SED modeling, with a particular focus on the high-energy emission (Sobolewska et al. 2022). In the 0.5–10 keV band, the authors concluded that more than one process contributes to the observed X-ray emission: the Comptonization of the IR photons coming from the torus by the electrons in the lobe and a weak additional X-ray component (perhaps an X-ray corona). Sobolewska et al. (2022) argue that the two processes should result in a different > 10 keV spectrum. This motivated the NuSTAR observation of 1718–649.
2.2. 1146+596
CSO 1146+596 is located in the galaxy NGC 3894 at a redshift of z ≃ 0.011 (van den Bosch et al. 2015). Multi-epoch VLBI observations unveiled a core–jet parsec-scale morphology (Taylor et al. 1998). Very Long Baseline Array (VLBA) data at 8.4 GHz presented in Principe et al. (2020) confirmed the compact morphology, with a detected core and two jets at a distance of 5 pc moving apart at about 0.2 c, seen at an inclination angle with respect to the observers line of sight (LOS) of 10 ° < θ < 21°. The inferred kinematic age is τj ≃ 60 yr (Principe et al. 2020). Multifrequency Very Large Array (VLA) radio observations at 1.4 GHz and 5 GHz of the source pointed out large-scale emission (∼1 kpc) related to multiple radio outbursts (Taylor et al. 1998). The estimated mass of the central SMBH is approximately 2 × 10⁹ ℳ⊙, based on the measurement of the transition of [O IV] at 25 μm (Willett et al. 2010), and the AGN is classified as a LINER (Gonçalves & Serote Roos 2004). NGC 3894 shows an elliptical or lenticular morphology and is classified as a E4-5 galaxy (de Vaucouleurs et al. 1991). The optical continuum is dominated by starlight (Condon & Broderick 1988), and spectroscopic optical observations (Kim 1989; Perlman et al. 2001) reveal the presence of a dust lane and ionized gas along the major axis of the galaxy; the gas kinematics are rather peculiar, exhibiting noncircular motions.
The first dedicated X-ray study of the system was performed by Balasubramaniam et al. (2021) based on an archival Chandra observation. As in the case of 1718–649, a point-like source is spatially coincident with the CSO position. The core spectrum is best fitted by a combination of a collisionally ionized thermal plasma with the temperature of kT = 0.8 ± 0.1 keV and a moderately absorbed, hard power-law component (Γ = 1.4 ± 0.4, NH = (2.4±0.7) × 1022 cm−2). Interestingly, these latter authors also report the detection of the iron Kα line at Eℓ = 6.5 ± 0.1 keV with a large equivalent width  keV, possibly indicative of X-ray reflection from a cold neutral absorber located in the central region of the host galaxy. Typically, EW of this order is expected from Compton-thick AGN (CT AGN) whose primary X-ray emission is absorbed with NH > 1.5 × 1024 cm−2, giving rise to an X-ray-reflection-dominated spectrum (e.g., Hickox & Alexander 2018, and references therein). Therefore, the existing high-quality broadband data allowed Balasubramaniam et al. (2021) to argue that the absorbing column density could be significantly underestimated, making 1146+596 a CT AGN candidate. Alternatively, the underlying continuum inferred from only the soft X-ray band data could be biased, leading to a biased estimate of the equivalent width of the iron line. We additionally supplemented this dataset by acquiring the NuSTAR X-ray data extending beyond 10 keV to obtain a reliable measure of the intrinsic column density in order to establish the true shape of the X-ray continuum, and perform a test of radiative models as in the case of 1718–649 (Sobolewska et al. 2022). We note that a high-quality broadband dataset exists for 1146+596, and it allowed Balasubramaniam et al. (2021) to estimate the accretion rate (λEdd ≡ ℒbol/ℒEdd ∼ 10−4) and the minimum kinetic power of the CSO jets (ℒkin ≃ 2 × 1042 erg s−1).
1146+596 has been detected in γ-rays by Fermi-LAT with a significance of σ ≃ 9.7 and no significant variability has been observed in the γ-ray flux on a yearly timescale (Principe et al. 2020). The γ-ray spectrum is well modeled by a flat power-law (ΓLAT = 2.05 ± 0.09) and a flux of ℱ0.1 − 100 GeV = (2.2±1) × 10−9 ph s−1 cm−2, with a corresponding luminosity of ℒ1 − 100 GeV ≃ 6 × 1041 erg s−1. It is worth noting that 1146+596 is the only CT AGN candidate among the young radio galaxies detected in γ-rays so far.
In view of its multiwavelength features, the source is an ideal laboratory for investigating the origin of the high-energy emission in young radio sources and the physics of the feedback process during the early stages of a radio source expansion.
3. Observations and data reduction
In the following, we present the observations used in this work. We analyzed the new NuSTAR observations of 1718–649 and 1146+596. We also analyzed the latest XMM-Newton observation of 1718–649 for the first time and reanalyzed the Chandra observation of 1146+596 presented in Balasubramaniam et al. (2021). In all of the available datasets, the source extraction region was chosen to maximize the signal-to-noise ratio.
3.1. Chandra
We reanalyzed the archival 38.5 ks Chandra ACIS-S observation of 1146+596 (ObsID=10389, see Table 2 for details) previously reported in Balasubramaniam et al. (2021). We used Chandra CIAO software v.4.131 (Fruscione et al. 2006) and CALDB v.4.9.4 for data processing. We reprocessed the data by running the CIAO tool chandra_repro.
X-ray observations of 1718–649 and 1146+596 analyzed in this work.
The data reduction was carried out following the standard steps. The observation was performed in VFAINT mode. We verified that the observation was not affected by periods of high flares, and therefore the exposure time of the final, cleaned file is mostly unchanged (see Table 2). We checked that the observation did not suffer pile-up issues and then the task specextract was used to obtain source and background spectra. The source spectrum was extracted from a circular region with a radius of 2.5″ centered on the source. For the background spectrum, we selected two circular source-free regions of 30″ in radius on the same chip as the target. As the spatial analysis revealed the presence of diffuse emission in the soft X-ray band (Balasubramaniam et al. 2021), the source spectrum was also extracted from a circular region of 10″ in radius centered on the source. Data were grouped at 15 counts per energy bin.
3.2. XMM-Newton
We acquired new observations of 1718–649 with XMM-Newton (see Table 2). We used the SAS v.19.1.02 software package to reprocess XMM-Newton data. First, we generated event files for each EPIC camera using the task emproc and epproc for the MOS and the pn, respectively. We then extracted the source light curve in the 10–12 keV energy range from the event file of each observation in order to filter the flaring particle background. We filtered data according to the standard routine: the observation was checked for high-background periods and all the periods with a count rate above 0.5 cts s−1 were excluded (see Table 2 for nominal and final exposure times). We checked that the observation did not suffer from pile-up. For all the detectors, we then extracted the source spectrum from a circular region of 25″ in radius centered on the source. For the background spectrum, we selected a circular source-free region of 80″ in radius. We grouped the data at 20 counts per energy bin.
3.3. NuSTAR
We acquired new observations of 1718–649 and 1146+596 with NuSTAR (Harrison et al. 2013), which are 77.4 ks and 68.9 ks in length, respectively (ObsID=60601020002 and ObsID=60601019002, see Table 2 for details). We used Heasoft v.6.28 and NuSTARDAS v.2.0.03 with CALDB v.202112024 for data processing. For both observations, we ran the nupipeline for data calibration and screening. With the nuproducts task, we then extracted the scientific products of both instruments on board NuSTAR, including spectra. The source spectra were extracted from circular regions of 30″ in radius centered on the source coordinates. For the background spectra, we selected a source-free circular region of 90″ in radius for both telescopes. Data were grouped at 20 and 15 counts per energy bin for 1718–649 and 1146+596, respectively.
4. X-ray analysis
The angular sizes of CSOs (≲0.1″, e.g., Orienti 2016) are too compact for them to be spatially resolved by current X-ray facilities. However, given the proximity of our targets, it is possible to study the emission on the scales of the host galaxy and beyond by taking advantage of the subarcsecond angular resolution of Chandra (∼0.5″ on-axis). The extended X-ray emission has been previously detected in both 1718–649 (Siemiginowska et al. 2016; Beuchert et al. 2018) and 1146+596 (Balasubramaniam et al. 2021).
For the spectral analysis, we used XSPEC v.12.11.1 (Arnaud 1996) and χ2 fitting statistics to analyze the background-subtracted data of the sources. The Levenberg-Marquardt minimization technique was adopted. All the errors are listed at a 90% level of confidence for one significant parameter (Avni 1976) unless stated otherwise. We adopted the Fisher test (Fisher 1922) to evaluate the statistical significance for one additional model component. Tested models discussed in the following sections are summarized in Table 3.
Tested models for X-ray analysis.
4.1. 1718–649
We began by modeling the XMM-Newton spectra. In the following, only the pn detector spectrum is discussed because of the higher available statistics with respect to MOS1 and MOS2. However, as a consistency check, a MOS data analysis was also performed and the results are consistent with the pn results.
We first assumed a simple power-law model (model I, PHABS×POWERLAW, in XSPEC nomenclature), where the PHABS component accounts for the Galactic absorption in the 0.35–8.5 keV energy range. The best-fit parameters are listed in Table 4; however, the reduced χ2 (∼2) indicates that this model poorly reproduces the observed spectrum. Indeed the residuals show that the model significantly overestimates the observed data below 0.7 keV by up to 5 σ. We therefore added a second obscuring component (ZPHABS, in Xspec nomenclature) in order to look for intrinsic absorption of the emission (model II, PHABS×ZPHABS×POWERLAW, in XSPEC nomenclature). The fit leaves positive residuals below 2 keV. Given the imaging analysis results indicating the presence of extended emission (Beuchert et al. 2018), we added a thermal component to the model (model III, PHABS×(ZPHABS×POWERLAW+APEC), in XSPEC nomenclature). The best-fit parameters are listed in Table 4. The addition of the thermal component improves the fit in a statistically significant way: from the Fisher test, the significance of this addition is larger than 5 σ (see Table 4), confirming the necessity of at least one thermal component (kT ≃ 0.7 keV) to model the soft band (< 2 keV) of the spectrum, as suggested by Beuchert et al. (2018). From the fit, we obtained a low level of intrinsic absorption (NH ≃ 0.8 × 1021 cm−2) with the photon index of the power-law component ( ) found to be in agreement with Beuchert et al. (2018) and with the typical values found in CSOs (Siemiginowska et al. 2016). There is no indication of any statistically significant residuals near the energy of the iron lines, which is also in agreement with the previous studies (Beuchert et al. 2018; Siemiginowska et al. 2016). The source is clearly detected in the 3–19 keV energy range with NuSTAR (see the left panel in Fig. 1). The white circle in the figure represents the 30″ extraction region of the source spectrum. We performed a simultaneous fit of the FPMA and FPMB spectra (see Table 4). The best-fit value of the photon index obtained with NuSTAR data is harder (
 ) than that from XMM-Newton data. However, this tension of about 3 σ appears to be driven by the FPMA instrument (
 ), while the fit of the FPMB spectrum (
 ) is in line with the XMM-Newton results. Therefore, we conclude that the hardening is likely a consequence of the low count statistics rather than being indicative of a real spectral change. As in the case of XMM-Newton/pn data, no statistically significant residuals near the energy of the iron lines were found in NuSTAR data.
1718–649 best-fit parameters from X-ray analysis.
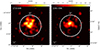 |
Fig. 1. NuSTAR/FPMA images of 1718–649 (left panel) and 1146+596 (right panel) in the 3–19 keV energy range. The white circular regions of 30″ in radius were used to extract the spectra of the sources. A Gaussian smoothing filter (σ = 1 pixel, native pixel size) was applied for graphical reasons. The first NuSTAR detection of 1718–649 and 1146+596 are at more than 14 σ and 9 σ, respectively. |
Assuming model III, we performed a simultaneous fit between XMM-Newton/pn and NuSTAR observations, linking the spectra parameters with the exception of normalizations for both telescopes. The best-fit parameters are listed in Table 4 and the spectra are shown in Fig. 2. The fit returns a satisfactory value of the reduced χ2 (χ2/d.o.f. = 523.4/521). The fit results are driven by the XMM-Newton/pn data. The best-fit value of the photon index of the power-law is  , the estimated intrinsic luminosity of the source in the 2-10 keV energy range is ℒ2 − 10 keV = (1.59±0.03) × 1041 erg s−1, and the broadband X-ray luminosity of ℒ0.3 − 20 keV = (3.68±0.05) × 1041 erg s−1, where errors are here listed at 1 σ for one parameter of interest.
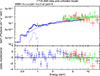 |
Fig. 2. XMM-Newton/pn and NuSTAR spectra of 1718–649 fitted with model III in the 0.35–19 keV energy range (see Table 4). XMM-Newton/pn data are shown in blue, while NuSTAR/FPMA and FPMB data are in red and green, respectively. To make spectra clearer, XMM-Newton data are also graphically rebinned. |
Although the fit returned a satisfactory reduced χ2 (∼1), from visual inspection of Fig. 2, some trends and significant residuals still seem to be present in the 0.35–2 keV energy range, and Beuchert et al. (2018) attempted to mitigate these by including an XSTAR (Bautista & Kallman 2001; Kallman & Bautista 2001) component in their total model. Instead, we tested models including emission lines at ∼0.6 keV and ∼1 keV, absorption ones at ∼1.1 keV and ∼1.5 keV, and a nonequilibrium ionization collisional plasma at ∼0.6 keV (NEI, in Xspec nomenclature) instead of the APEC component. However, none of these additions is statistically significant to at least 3 σ with a Fisher test. Therefore, as we are mainly interested in the X-ray continuum from the CSO, we did not inspect the nature of these possible features in further details.
4.2. 1146+596
Given the presence of extended X-ray emission in the source (Balasubramaniam et al. 2021), we first performed the spectral analysis of the Chandra data extracted for the central point-like source within 2.5″; we then analyzed the data extracted within a circular region of radius 10″, which includes the extended emission.
We proceeded to test models of increasing complexity. Models accounting only for absorption (models I and II) are found to be too simple to model the complex X-ray spectrum of the source from the 2.5″ region: the fits returned reduced χ2 of about 2.7 and 2.9, respectively, and left statistically significant positive residuals (at more than 2 σ) below 2 keV. This is not surprising given the results of the imaging analysis unveiling diffuse emission, and motivated us to add a thermal component to the model (model III). This model returns a temperature  for the thermal emission (in agreement with the value
  reported in Balasubramaniam et al. 2021). However, the photon index of the power-law is still unusually hard
  in comparison with typical values expected for CSOs (Siemiginowska et al. 2016), possibly indicating that the model does not yet correctly account for the intrinsic absorption. As a test, we fixed Γ = 1.70, a typical value of unabsorbed CSO (NH ≲ 1022 cm−2; Siemiginowska et al. 2016), obtaining a slight increase –within a factor of 2– of the intrinsic absorption column. The observed spectrum still displays an excess above the model in the 6–7 keV range. We therefore included a Gaussian line at ∼6.4 keV in the model (model IV). However, even if model IV better reproduces the spectrum in the 6-7 keV, the inclusion of the Gaussian component does not improve the fit significantly (1.2 σ according to the Fisher test). The iron line was first reported in Balasubramaniam et al. (2021), where the line parameters were constrained,
  with
with  , without fixing the value of the photon index (
 ). This is likely due to a different choice of count binning (5 counts per bin).
Next, we investigated the physical properties of the diffuse emission by modeling the spectrum extracted from the 10″ radius region. We started modeling data from an absorbed power-law model and a Gaussian line plus a thermal component (model IV), leaving all the parameters free to vary. However, the fit returned an unusually hard photon index, as in the case of a point-like study. Following the same arguments discussed above, we fixed it to 1.70. The best-fit parameters are listed in Table 5. The results obtained are consistent with those of the point-like emission. However, from the fit, we noticed a relevant scatter in the residuals up to 3 σ at energies below 2 keV (see Fig. 3a). We therefore tested a model with a multitemperature gas component (model V) and fit the data with the model PHABS×(ZPHABS×(POWERLAW+ZGAUSS)+APEC+APEC), which is the XSPEC nomenclature. The best-fit parameters are listed in Table 5. The temperature values of the two thermal components are  and
and  .
.
1146+596 best-fit parameters from X-ray analysis.
The thermal component needed to model the point-like spectrum has an intermediate value of kT ≃ 0.9 keV. This could be explained with a lower number of counts in the 2.5″ region compared with the larger region, which did not allow us to detect the two-temperature plasma.
The source is clearly detected in the 3–19 keV energy range with NuSTAR (see the right panel in Fig. 1). The white circle represents the 30″ extraction region of the source spectrum. We fit the spectra of the two NuSTAR modules both individually and simultaneously, and found no statistically significant discrepancies between the two detectors. The best-fit parameters are listed in Table 5. From the simultaneous fit, the spectrum is well fitted by a simple power-law model (model I) with a photon index of  , and no significant signatures of emission lines –including the iron Kα line– are present in the spectrum. However, the source net counts in the Chandra observation are twice the photon statistics of NuSTAR for each instrument.
Assuming model V, we performed a simultaneous fit of the Chandra
5 and NuSTAR observations. The best-fit parameters are listed in Table 5 and the data and the unfolded spectrum are shown in Fig. 3b. The simultaneous fit constrains the intrinsic power-law shape: the photon index is  with an intrinsic hydrogen column density of
  . We also confirm the need for a multitemperature thermal component, with
  and
and  . For comparison, in Fig. 3a we show the source spectrum fitted with a single thermal component (model IV), which displays the presence of significant residuals below 2 keV. From the fit, we estimated the intrinsic luminosity of the source in the 2–10 keV energy range, finding ℒ2 − 10 keV = (6.0±0.4) × 1040 erg s−1, and an unabsorbed broadband X-ray luminosity of ℒ0.3 − 20 keV = (1.45±0.14) × 1041 erg s−1, where errors are listed at the 1 σ confidence level for one parameter of interest.
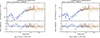 |
Fig. 3. Chandra and NuSTAR spectra of 1146+596 fitted with model IV (panel a) and model V (panel b) in the 0.3 − 19 keV energy range (see Table 5). Chandra, NuSTAR FPMA, and NuSTAR FPMB data are shown in blue, red, and green, respectively. |
5. Broadband SED modeling
From the X-ray analysis (Sect. 4), we obtain a good characterization of the X-ray continuum for both sources. The SED modeling of 1718–649 was presented in Sobolewska et al. (2022) and here we discuss it in relation to the broadband X-ray results, while we focus on the broadband SED modeling of 1146+596. We note that in the SED of each source, we took into account only the X-ray flux of the power-law component corrected for absorption, given that our goal is to investigate the origin of the high-energy emission of the radio source.
5.1. 1718–649 SED
The SED modeling presented in Sobolewska et al. (2022) leaves the question relating to the origin of the X-ray emission unanswered. In the favored model, the emission is the sum of IC and IR flux plus radiation from an additional component, likely a weak X-ray corona. The latter is needed to account for a fraction of the soft X-ray emission, while it should be subdominant at higher (> 10 keV) energies. The deep XMM-Newton observations, along with NuSTAR data, allowed us to refine the spectral parameters of the X-ray emission, with a photon index of Γ ≃ 1.7 and an intrinsic luminosity of ℒ2 − 10 keV ≃ 1.7 × 1041 erg s−1. In Fig. 4, we plot the observed and modeled SED of 1718–649 presented in Sobolewska et al. (2022), adding the results of the joint fit of XMM-Newton and NuSTAR data. We also include the upper limit in the 20–40 keV measured from the NuSTAR observation. The improved X-ray dataset confirms the main findings of the SED modeling: while the IC–IR is the dominant contribution, it underpredicts the < 1.5 keV flux by about a factor of 2. As proposed by Sobolewska et al. (2022), this excess could be accounted for by an additional emitting component (modeled with a cutoff power-law with Γ = 2.0, a high-energy cutoff set arbitrarily to 100 keV, and ℒ2 − 10 keV = 6.6 × 1040 erg s−1) associated, that is, with a weak X-ray corona or a radiatively inefficient nuclear emission (e.g., an ADAF; Ichimaru 1977; Narayan & Yi 1994, 1995a,b; Abramowicz et al. 1995). This model is consistent with the data at energies higher than 10 keV obtained from the NuSTAR observation, which unfortunately only provides loose constraints beyond 20 keV.
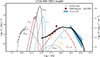 |
Fig. 4. Observed broadband SED of 1718–649 and theoretical model by Sobolewska et al. (2022). No formal fitting was performed. Gray circles are archival data from Sobolewska et al. (2022) and references therein. The butterfly light blue region is Fermi-LAT constraints from Principe et al. (2021). Dark orange data are XMM-Newton-NuSTAR luminosity constraints from the present work. Broadband model components are as follows: self-absorbed synchrotron radiation and SSC (the solid thin black line); dashed lines represent three blackbody components (IR in dark red, starlight in black, accretion disk photon fields in light blue), and their corresponding IC components originating from a single radio lobe with the same colors. The solid orange line illustrates the contribution of a low-luminosity X-ray nuclear emission (a weak X-ray corona or an ADAF-type emission). The black solid line is the sum of the different high-energy components. |
Finally, we also comment on the long-term X-ray variability of the source. Beuchert et al. (2018) found X-ray variability measuring a factor of about 2.5 on a timescale of years in the normalization of the power-law emission. In relation to the broadband model of Sobolewska et al. (2022), this variability might be interpreted in terms of variations of seed infrared photons available for IC scattering due to the presence of a clumpy circumnuclear medium around the radio source (Filippenko 1985; Maccagni et al. 2014, 2018).
5.2. 1146+596 SED
As mentioned in Sect. 1, the X-ray continuum could be of nonthermal origin, related to the jets, or produced by the AGN powering the radio source. Further insight may be gained by studying the observed broadband SED. In the following, we explore the implications of a nonthermal origin of the high-energy emission of 1146+596 by modeling its radio-to-γ-ray emission. The radio-to-optical data are collected from the literature and the Fermi-LAT data are taken from Principe et al. (2020). We added the X-ray data obtained from the broadband fit as part of this work. The observed SED is presented in Fig. 5. The multiwavelength data are not simultaneous; however, no variability has been observed over timescales of years. The near-infrared to optical band is mainly contributed by the stellar continuum of the host galaxy. While we still display these data for completeness, they do not enter the modeling of the high-energy emission of the CSO.
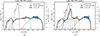 |
Fig. 5. Observed broadband SED of 1146+596 and theoretical model 1 (panel a) and model 2 (panel b). No formal fitting was performed. The model parameters are listed in Table 6. Gray circles are data from Balasubramaniam et al. (2021) and reference therein. Blue data are Fermi-LAT luminosity constraints from Principe et al. (2020). Dark orange data are Chandra–NuSTAR luminosity constraints from the present work. Broadband model components are as follows: synchrotron and SSC curves in red, green, and violet (from Massaro et al. 2006; Tramacere et al. 2009, 2011; Tramacere 2020), three black-body components representing the torus, the host galaxy, and the disk emission in red, black, and blue, respectively. The solid orange line in model 2 illustrates the contribution of a low-luminosity X-ray nuclear emission (a weak X-ray corona or an ADAF-type emission). The black solid line is the sum of the different components related to the central AGN. |
In the multi-epoch 8.4 GHz VLBA maps, the source displays a parsec-scale, two-sided structure with mildly relativistic, moderately inclined jets (Principe et al. 2020) embedded in a diffuse emission visible at lower frequencies (Taylor et al. 1998; Tremblay et al. 2016). We therefore tested a leptonic model for the emission of the jets. We considered the simplest yet informative scenario of a jet emitting via a synchrotron mechanism and IC scattering. Modeling of the SED was performed using the Jet SED modeler and fitting Tool (JetSeT, Massaro et al. 2006; Tramacere et al. 2009, 2011; Tramacere 2020). In this model, the emission is produced in a jet region of spherical shape and radius R. The spherical volume is uniformly filled by relativistic plasma (i.e., a filling factor of 1 was assumed) and magnetic field, B. The energy densities of relativistic leptons and magnetic field are 𝒰e and 𝒰B, respectively. The region is moving with a bulk Lorentz factor Γbulk, and θ is the angle between the jet axis and the observer LOS. Interacting with the jet magnetic field, the electrons in the blob radiate via synchrotron emission. The synchrotron radiation provides the seed photons for the IC mechanism (SSC). A broken power-law function is used to describe the energy distribution of the radiating electrons, where N(γ), γmin, γmax, and γbreak are the minimum, maximum, and break Lorentz factors of the particles, and p1 = 2α1 + 1 and p2 = 2α2 + 1 are the spectral indices below and above γbreak, respectively.
We estimated the magnetic field within the lobes under equipartition conditions as in Wójtowicz et al. (2020). Defining the effective radius of the lobes as ![Mathematical equation: $ R_{\mathrm{eff}}= \sqrt[3]{\frac{3}{4}ab^2} $](/articles/aa/full_html/2024/04/aa48208-23/aa48208-23-eq96.gif) , where a and b are the major and minor axis of the CSO, respectively6, and assuming b/a ≃ 0.25 (Kawakatu et al. 2008)7, the equipartition magnetic field is
, where a and b are the major and minor axis of the CSO, respectively6, and assuming b/a ≃ 0.25 (Kawakatu et al. 2008)7, the equipartition magnetic field is
![Mathematical equation: $$ \begin{aligned} B_{\mathrm{eq} } = \left[ 4.5 c_{12} \mathcal{L} _{\mathrm{rad} } \right]^{2/7} R_{\mathrm{eff} }^{-6/7} \, \mathrm{G} \simeq 10 \, \mathrm{mG} ,\end{aligned} $$](/articles/aa/full_html/2024/04/aa48208-23/aa48208-23-eq97.gif) (1)
(1)
where c12 ≃ 3 × 10⁷ (in cgs units), and ℒrad stands for the total observed radio power in the frequency range 0.01–100 GHz (see Beck & Krause 2005). Here, we assume that the intrinsic radio continua can well be approximated by a simple power-law with a mean spectral index of α = 0.73 above the peak frequency, as derived for young radio galaxies by de Vries et al. (1997). Under this assumption,
 (2)
(2)
where ℒ5 GHz = 1.62 × 10²³ W Hz−1 (Principe et al. 2020). The photon index of the γ-ray emission constrains the slope of the high-energy nonthermal emission, which means that of N(γ) beyond the energy break, p2 = 2Γ − 1. Indeed, these are initial estimates, and need to be adjusted for the model to match the observed SED.
As a first test, we tried to model the radio, X-ray, and γ-ray emission in the framework of a synchrotron and SSC one-zone scenario. However, this model has issues in properly reproducing the X-ray emission regardless of whether it is ascribed to synchrotron or SSC radiation. Therefore, we relaxed the hypothesis of a single emitting region and assumed that the dominant contribution at low or radio frequencies is from a larger region, either in the jets or forming lobes, while the high-energy emission is produced in a smaller, inner jet region. The latter has a synchrotron curve extending to the UV-X-ray band, while the SSC component is responsible for the γ-ray emission. This model (Model 1) is borrowed from high-energy-peaked BL Lacs and is also motivated by the fact that, in the γ-ray luminosity versus photon index plot (see Fig. 7 in Principe et al. 2020), 1146+596 is located close to the region of γ-ray BL Lacs. Therefore, in this scenario, 1146+596 could be considered as a misaligned, low-power BL Lac with a mildly relativistic jet.
1146+596 input SED models parameters and estimated jet powers.
Model 1 is presented in Fig. 5a and its parameters are reported in Table 6. We started fixing all parameters, except for R, B, and 𝒩. Furthermore, we set the lower limit for the magnetic field equal to the equipartition magnetic field Beq ≃ 10 mG. This choice is driven by the assumption that the magnetic field strength is expected to decrease along the jet axis (O’Sullivan & Gabuzda 2009; Pudritz et al. 2012; Gabuzda 2017; Massaglia et al. 2019). As no strong shocks are observed at the end of the jet, we consider this value as the lowest value for the magnetic field strength. Other limits in the parameter space are set by the size of emitting blob: on the one hand, we assumed a lower limit for the radius of the emitting region of the order of 1015cm, in agreement with the typical values found for blazars (e.g., Celotti & Ghisellini 2008); on the other hand, we set the size of the radio source as the upper limit (∼1 pc). With these constraints, we modeled the SED of 1146+596. We note that there is no unique set of parameter values that provides a satisfactory modeling. This type of degeneracy in nonthermal modeling of jetted AGN is well known and established (e.g. Böttcher 2007; Lucchini et al. 2019). For this reason, we investigated the parameter space in further detail. In particular, we found a linear relation between the magnetic field strength and the radiating particles density in bi-logarithmic scale: we argue that all models located on this relation shown in red in Fig. 6 provide a good description of the observed SED. Similarly to what is observed in BL Lacs, this scenario implies a strongly particle-dominated inner-jet emitting region, with 𝒰B/𝒰e ranging from 1e–3 up to 3e–2. Moreover, in order to produce the observed X-ray emission via a synchrotron mechanism, a log10γmax ≥ 7.5 is needed: this is an extreme value even for BL Lacs detected at TeV energies (Celotti & Ghisellini 2008). However, theoretical works and simulations (e.g., Böttcher & Dermer 2010; Mimica & Aloy 2012; Vaidya et al. 2018; Mukherjee et al. 2021) suggest that internal shocks can efficiently accelerate particles up to such high values of γmax, lending support to a synchrotron origin of the X-ray emission (e.g., Böttcher & Dermer 2010, and references therein). This means that, if our model 1 is correct, extremely efficient acceleration processes are in action in 1146+596. Energy equipartition between particles and B field is instead assumed for the region producing the bulk of the radio emission. At high energies, the contribution of this component is negligible, and, interestingly, it overestimates the observed radio fluxes in the range ∼0.3 − 3 GHz despite the fact that the synchrotron-self absorption is included in the model. One possibility is that an additional effect is shaping the synchrotron emission and this could be free-free absorption by clouds near to the center of the host galaxy, as in the case of 1718–649 (Tingay & de Kool 2003).
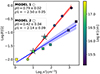 |
Fig. 6. Parameter space of SED models for 1146+596. Data points are shown with circles and squares for Model 1 and 2, respectively. The linear relations between the magnetic field strength and the particles density found for Models 1 and 2 are reported in red and blue, where p0 and p1 are the angular coefficient and the normalization. A star marker is used to highlight models for which parameters are listed in Table 6. |
Assuming Model 1, we can explain the observed X-ray emission very well, as we can the γ-ray emission, via synchrotron and SSC radiation, respectively. However, as discussed above, very high values of γmax –and consequently efficient acceleration processes– are required. We therefore investigated an alternative scenario and relaxed the hypothesis of the X-ray flux being produced via synchrotron emission. As discussed in Sect. 2.2, 1146+596 harbors a LINER-type AGN, as in 1718–649. Therefore, the AGN emission could contribute to the X-ray band. We assumed a phenomenological AGN model similar to the one adopted for 1718–649 in Sobolewska et al. (2022; see Sect. 5.1): a disk black-body peaking at UV frequencies and a cut-off power-law function with Γ = 1.9, Ecut − off = 100 keV. We adjusted the luminosities of these two components to match the observed SED: this resulted in a UV luminosity of ℒUV ≃ 8 × 1042 erg s−1, which is in agreement with the upper limit of ℒbol < 5 × 1043 erg s−1 reported in Balasubramaniam et al. (2021), and a 2 − 10 keV luminosity of ℒ2 − 10 keV ≃ 9 × 1040 erg s−1. Model 2 is shown in Fig. 5b and the model parameters are reported in Table 6. Adopting these parameters, which are typical for LINER-type AGN (see González-Martín et al. 2009), the X-ray emission could be entirely explained as emission from a weak corona or a radiatively inefficient accretion flow (Ichimaru 1977; Narayan & Yi 1994, 1995a,b; Abramowicz et al. 1995; Chen et al. 1995). The SSC emission of the inner-jet emerges in the γ-ray band, while its synchrotron radiation is hidden below the thermal emission of the host galaxy and of the AGN (for completeness, we also included the emission of the putative torus, modeled as a black-body peaking in the IR band). Following the same approach as that adopted for Model 1, we investigated the degeneracy in the parameter space. We find that all models lying on the relation in blue in Fig. 6 provide a good modeling of the observed SED. In these models, the X-ray emission is now ascribed to the AGN. The dominance of the particles over the magnetic field also holds true in this case, with 𝒰B/𝒰e ranging from 8 × 10⁻⁴ up to 5 × 10⁻³.
We note that Model 2 is less constrained than Model 1, as can be seen from Fig. 6: although the synchrotron component is well constrained by the observed X-ray emission in Model 1, in Model 2 we can only set upper limits on it, because the main contribution to the observed X-ray emission comes from the additional component.
Estimates of the total power carried by the jet can be inferred from the SED modeling. The jet power (ℒjet) is the sum of the kinetic power (ℒkin), which is the energy stored into relativistic emitting electrons (ℒe) and cold protons (ℒp), and the power carried as Poynting flux (ℒB). Here, we assumed one cold proton per radiating electron. A fraction of this power is radiatively dissipated, the radiative power (ℒrad). These quantities have been estimated with the formulae in Zdziarski et al. (2014) and the values for the two models are reported in Table 6. From the study of the space parameters in both models, we can put constraints on the energetic budget of the source. The total jet powers are in the range 0.07 − 4 × 1042 erg s−1 for Model 1 and 0.1 − 2 × 1042 erg s−1 for Model 2.
For both models, the Poynting flux is a minor contribution to the total power, as expected given that 𝒰e ≫ 𝒰B in both cases. The bulk of the jet power lies in the kinetic energy of the radiative electrons, while the hadronic component contributes with few percentages to the total kinetic energy of the jet (∼20% and ∼10% for Models 1 and 2, respectively). The jet radiates away a small percentage of its total power (≲10%), meaning that the bulk of ℒjet can be used to expand the radio structures.
6. Discussion
6.1. Ambient medium of CSO
X-rays have the potential to uncover the role of ambient medium in the source expansion: the host galaxy environment can be studied in the X-ray band via the detection of the hot component of the ISM and the total equivalent hydrogen column density along the LOS. S19 noted that obscured and unobscured CSO sources appeared to occupy different regions in the linear size (LS) versus radio power (ℒ5 GHz) plane, possibly indicating a role of the ambient medium in the source expansion. The two sources presented in this work have low-to-moderate levels of obscuration, with intrinsic equivalent hydrogen column densities in the range ∼1021 cm−2 to a few 1022 cm−2, in agreement with the majority of young radio sources reported by S19. In Fig. 7, we update the LS–ℒ5 GHz plot in S19 with the new NH estimates from Sobolewska et al. (2023) and the present work. In addition, we selected sources belonging to the sample of bona fide CSOs built by Kiehlmann et al. (2024) to avoid contamination. We excluded four sources from our analysis: NGC 7674, 4C+37.11, 4C +52.37, and J1247+6723. The first exhibits peculiar properties in terms of linear size, and is also considered an outlier in Kiehlmann et al. (2024), while we could not find estimates of the intrinsic obscuration in the literature for the other three sources.
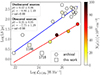 |
Fig. 7. Luminosity at 5 GHz versus radio source size proposed by Sobolewska et al. (2019a; S19). Literature data are selected as in Sect. 6.1. 1718–649 and 1146+596 are marked with squares. Color coding indicates the intrinsic equivalent hydrogen column density measured from the X-ray spectra. Red and blue solid lines mark the linear relations fitted on obscured (NH ≥ 1023 cm−2) and unobscured (NH < 1023 cm−2) sources, where p0 and p1 are the angular coefficient and the normalization, respectively. The r-val stands for the Pearson correlation coefficient. Figure adapted from S19. |
Orienti & Dallacasa (2014) pointed out a positive correlation between radio luminosity and radio linear size in CSOs. We therefore investigated this correlation by splitting sources in two classes: obscured, with NH ≥ 1023 cm−2, and unobscured, with NH < 1023 cm−2. For both samples, the Pearson coefficients (r-val) confirm a strong positive correlation for both samples of obscured (r-val = 0.98) and unobscured (r-val = 0.88) CSOs. Furthermore, in order to estimate the statistical significance of this separation in obscured and unobscured CSOs, we performed two 1D two-sample Kolmogorov-Smirnov (K–S) tests concerning the CSO radio luminosity and radio linear size. We find that, while the radio luminosities of the two samples likely come from the same distribution (p-value = 0.96), we cannot reject the hypothesis that the radio sizes of the two samples come from two distinct distributions (p-value = 0.02). Although the selected samples on which the test was performed differ slightly due to the different selection critieria, our results are still in a good agreement with those of Sobolewska et al. (2019a), who found p-value = 0.8 and p-value = 9.8 × 10⁻⁴ for radio luminosity and radio size, respectively. From Fig. 7, we note that 1146+596 lies, as expected, on the branch of unobscured and mildly obscured sources, while 1718–649 seems instead to share the same location as the obscured sources, contrary to what is expected from its moderate/low column density. The reason for the location of 1718–649 in the LS–ℒ5 GHz diagram remains obscure. One possibility is that, for unclear reasons, 1718–649 exhibits significantly higher luminosity at 5 GHz than its counterparts at the same linear size, or it has a more compact radio structure compared to others with similar radio luminosities. Alternatively, the separation in obscured and unobscured sources is strongly biased by the small available statistics, and we are looking at only a small fraction of CSOs that is not representative of the entire population. Clearly, this represents a limit for our statistical tests and prevents us from coming to any strong conclusions. Moreover, it should also be taken into account that the X-ray analysis cannot precisely constrain the location of the obscuring component because of the limited angular resolution of the X-ray instruments (∼0.5″ with Chandra). As a consequence, it is possible that the X-ray obscurer is also distributed at the same scales, thus obscuring the X-ray emission without affecting the expansion of the CSO. Further insight into the spatial distribution of the obscuring material can come from HI measurements. In general, measurements of HI absorption features in CSOs point out column densities 1–2 orders of magnitude lower than those estimated by NH in X-rays. Indeed, it is important to bear in mind that NH quantifies the column density across all gas phases, while NHI only traces the column density through the atomic hydrogen8. However, correlations between NH in X-rays and NHI in radio bands have been found for CSOs, albeit with large scatter (Ostorero et al. 2010, 2017). Ostorero et al. (2017) found that
 (3)
(3)
with an intrinsic spread of  (see Ostorero et al. 2017, for further details). This value of σint implies that the corresponding NHI is expected to be different from the mean relation at 1 σ by a factor of ,∼4. With our estimates of the intrinsic NH of 1146+596 (NH ≃ 3.5 × 1022 cm−2), we expect NHI to be within a factor of 4 of ∼5 × 1020 cm−2. This value is in perfect agreement with measurements by Peck & Taylor (1998), who found NHI = 2 − 12 × 1020 cm−2, suggesting that the NH measured in X-ray is likely located near to the CSO. Therefore, in the specific case of 1146+596, the presence of a dust lane along the major axis of the host galaxy observed with the optical Hubble Space Telescope (Perlman et al. 2001) does not significantly contribute to the estimated NH. Similar conclusions were reached for 1718–649 (Ostorero et al. 2017), suggesting that little gas (NH ≃ 9 × 1020 cm−2) is located near to the central CSO. By the simplest assumption of a uniform distribution of the absorbing column over a specific surface area, we can infer a rough estimate of the amount of gas necessary to produce the derived X-ray obscuration in our sources. The total amount of gas is given by
 (4)
(4)
where NH is the equivalent hydrogen column density derived from X-ray observations, r is the sphere radius over which the gas is distributed, and mp is the proton mass. Assuming r of the order of typical radii of the tori in AGN (r ≃ 10 − 100 pc, e.g., Ramos Almeida & Ricci 2017), we get ℳgas ≃ 103 − 105ℳ⊙ and ℳgas ≃ 105 − 107ℳ⊙ for 1718–649 and 1146+596, respectively.
In both 1718–649 and 1146+596, thermal emission is evident in the soft X-ray band (< 2 keV). The emission is extended on kiloparsec scales, thus beyond the size of the CSOs, raising the question of the origin of such emission and its relation with the presence of a young source. Our results on 1718–649 agree with the analysis performed by Beuchert et al. (2018). These latter authors associated this emission with supernova explosions in the host galaxy. The joint analysis of Chandra and NuSTAR data of 1146+596 suggested the presence of a multitemperature gas (kT ≃ 0.3 keV and kT ≃ 1.2 keV). The warmer temperature lies on the relation LX(gas)–kT(gas) for the hot ISM typically found in early-type galaxies (Fabbiano 2019) such as the host of 1146+596. The nature of the hotter component is instead more elusive. It could be emitted by gas either photo-ionized by the central AGN or heated by the shocks driven by the impact of the radio jet on the ISM clouds, or even a superposition of these two processes (e.g., Fabbiano 2019, and references therein). Although signatures of jet–ISM interactions have so far been typically observed in more evolved radio sources, such as CSS with linear sizes from 500 pc up to 20 kpc (e.g., O’Dea & Saikia 2021, and references therein), evidence in favor of such interactions has also been reported in CSOs (e.g., Orienti 2016, and references therein). In the case of 1146+596, Taylor et al. (1998) report a kiloparsec-scale radio halo (LS ∼ 1 kpc), which could be a relic of a previous radio cycle. Shock-heated gas could be then related to recurrent radio outbursts. This scenario is also supported by numerical simulations (Zovaro et al. 2019a,b), which show that outflows of CSOs can reach scales several times larger than the radio source size. As a consequence, a relation between the properties observed on host galaxy scales and the central source cannot be excluded a priori. Alternatively, as the Chandra inspection revealed the presence of only a small number of individual sources (approximately four), which we excluded from our analysis, contamination from a small population of individual sources, such as low-mass X-ray binaries or supernovae, near to the central AGN is an alternative possibility (e.g., Lehmer et al. 2016). In this scenario, the hotter gas has no direct connection with the central source.
6.2. Origin of high-energy emission
Sobolewska et al. (2022) adopted the dynamical and radiative model by Stawarz et al. (2008) to explain the broadband SED of 1718–649. In this model, both a weak corona and IC scattering of infrared photons by the lobes electrons contribute to the observed X-ray emission, while the GeV emission is produced via IC scattering of the UV photon field by the electrons of the lobes. This scenario is supported by the lobe-dominated radio structure of 1718–649, pointing to large viewing angles and possible de-boosting of the jet emission. The radio morphology of 1146+596 instead appears to be jet-dominated (see Fig. 4 in Principe et al. 2020). We therefore adopted a different model for 1146+596 in which the γ-ray emission is produced in a blob within the jet. In both versions (Models 1 and 2), the GeV emission is produced via IC scattering on synchrotron photons, while the origin of the X-ray emission differs. In the former, the X-rays are produced via synchrotron radiation, and the source appears similar to a high-energy-peaked BL Lacs; in the latter, the X-ray emission comes from a weak corona or an ADAF-type disk, and is therefore produced by the central AGN. We note that, while a nondominant corona contribution to the X-ray emission is also included in the SED modeling of 1718–649 (Sobolewska et al. 2022), a scenario of X-ray synchrotron emission, as in our Model 1, would not be easy to accommodate given the harder X-ray photon index of this source.
Interestingly, Mukherjee et al. (2017) argued that jets with powers of ≲1043 erg s−1 – such as those of 1718–649 – may be too weak to escape the ISM confinement, and too weakly pressurized to prevent an infall of gas back into the initially created central cavity. It is worth noting that our estimates suggest that 1146+596 is also characterized by a jet power of ≲1042 erg s−1. Moreover, it should be noted that our estimates of the jet power of 1146+596 have to be interpreted as an upper limit. Indeed, as opposed to our approach for 1718–649, we took no external Compton contributions into account in our modeling of the high-energy emission of 1146+596. We note that this addition would return a lower estimate of the jet power. For the accretion disk luminosity of ℒdisk ≃ 5 × 1043 erg s−1, estimated by Balasubramaniam et al. (2021) based on the 8 − 1000 μm fluxes in Kosmaczewski et al. (2020), the jet to disk luminosity ratio is in the range of ≲0.1. These values are in agreement with the results of Ostorero et al. (2010) for a sample of CSOs, where the authors found ℒjet/ℒdisk = 0.01 − 0.1, while there are indications of higher ratios of ∼1 − 10 in powerful blazars (Celotti & Ghisellini 2008).
7. Conclusions
In this work, we analyzed archival and new X-ray observations of two confirmed γ-ray-emitting CSOs: 1718–649 and 1146+596. In particular, for the first time, we report their detections with NuSTAR at energies of > 10 keV. Our main findings can be summarized as follows:
-
Joint XMM-Newton and NuSTAR observations of 1718–649, extending the X-ray energy range up to 19 keV, confirm the results of previous works (Siemiginowska et al. 2016; Beuchert et al. 2018): the primary X-ray emission is modeled with a mildly absorbed (
 ) power-law model (
 ) and a diffuse thermal X-ray emission (
 ).
). -
A joint fit of the Chandra and NuSTAR spectra of 1146+596 indicates a softer photon index (
 ) with respect to the values in literature, with a moderate intrinsic obscuration (
 ). From the fit, we estimate an intrinsic X-ray luminosity of ℒ2 − 10 keV = (6.0±0.4) × 1040 erg s−1.
 -
We identify a multitemperature thermal component (
 ,
,  ) in the X-ray spectrum of 1146+596. The thermal emission is extended beyond the radio size of the CSO. The cooler component is likely related to the emission of the hot ISM of the host galaxy, while the higher-temperature component could be the signature of jet–ISM interactions.
 -
We investigated the role of the ambient medium in confining the source expansion through the study of intrinsic obscuration in X-rays. Based on the location of our sources in the diagnostic LS versus ℒ5 GHz plot proposed in S19, we argue that heavily obscured and possibly frustrated sources show different radio sizes with respect to unobscured sources that are free to expand. This separation is supported by a 1D two-sample Kolmogorov-Smirnov test (p-value = 0.02).
-
We modeled the broadband SED of 1146+596 for the first time in the framework of a leptonic synchrotron-SSC model and propose two scenarios. In the former, the X-ray emission is due to synchrotron emission: 1146+596 can be seen as a low-power, moderately misaligned BL-Lac. In the latter, the X-ray emission is related to the AGN, either to a weak corona or an ADAF, similarly to the model proposed for 1718–649 by Sobolewska et al. (2022). For both models, the maximum estimated jet is ∼1042 erg s−1, and places 1146+596 among the low-power young radio sources, which might not expand beyond the host galaxy limits.
The detection in γ-rays of CSOs is clear confirmation of a nonthermal high-energy component. However, our findings support the idea of different sites for the origin of such emission (in the lobes or the jets) and of an additional contribution (a weak corona or an ADAF-like emission), which is present, and possibly dominant, in the X-ray band. We note that, depending on the site of production, the nonthermal high-energy emission will change differently as the source evolves: the isotropic lobe emission is expected to fade, while the jet-related emission should persist (unless there is a change in the jet parameters). Testing this scenario would require sensitive high-energy observations of samples of radio sources in the first stages of their evolution, which unfortunately are not yet available (see e.g., Principe et al. 2021). Given the source”s radio morphology and constraints on the dynamics, we modeled the high-energy emission of 1146+596 with a simple yet informative SSC model. However, as in the case of 1718–649, EC against, for example, photons coming from the disk and/or the dusty torus might contribute to the high-energy emission observed in 1146+596. In general, the EC contribution at high energies would lead to a lower estimate of the total jet power of the source.
A larger number of obscured (NH > 1023 cm−2) CSOs is also needed to investigate the role of the surrounding ambient medium in confining the source expansion. Combining this with detailed studies of the spatial distribution, composition (both in atomic and molecular phase), and kinematics of the gas close to the nuclear regions, thanks to the current radio and millimeter facilities, may provide essential insights into AGN feedback processes in CSOs.
The Chandra spectrum is the one extracted from a circular region of radius 10″ centered on the source.
Consequently, LS = 2a.
CSOs are expected to have more symmetric radio structures with respect to evolved FRII, for which b/a ≃ 0.1 are expected based on dynamical considerations.
We note that the NHI value is directly proportional to the spin temperature, and an underestimation of this parameter could potentially lead to a reduced NHI value.
Acknowledgments
Authors thank the anonymous referee for useful suggestions that improved the clarity of the manuscript. Authors also thank E. Torresi for the useful discussions on X-ray modeling of thermal and photoionized gasses. M.S. and A.S. were supported by NASA contract NAS8-03060 (Chandra X-ray Center). M.S. acknowledges NASA/Chandra contract GO2-23110X. Ł.S. was supported by the Polish NSC grant 2016/22/E/ST9/00061. G.P. acknowledges the support by ICSC – Centro Nazionale di Ricerca in High Performance Computing, Big Data and Quantum Computing, funded by European Union – NextGenerationEU.
References
- Abramowicz, M. A., Chen, X., Kato, S., Lasota, J.-P., & Regev, O. 1995, ApJ, 438, L37 [NASA ADS] [CrossRef] [Google Scholar]
- Ajello, M., Angioni, R., Axelsson, M., et al. 2020, ApJ, 892, 105 [NASA ADS] [CrossRef] [Google Scholar]
- Angioni, R., Ros, E., Kadler, M., et al. 2019, A&A, 627, A148 [NASA ADS] [CrossRef] [EDP Sciences] [Google Scholar]
- Arnaud, K. A. 1996, in Astronomical Data Analysis Software and Systems V, eds. G. H. Jacoby, & J. Barnes, ASP Conf. Ser., 101, 17 [NASA ADS] [Google Scholar]
- Avni, Y. 1976, ApJ, 210, 642 [NASA ADS] [CrossRef] [Google Scholar]
- Balasubramaniam, K., Stawarz, Ł., Cheung, C. C., et al. 2021, ApJ, 922, 84 [NASA ADS] [CrossRef] [Google Scholar]
- Bautista, M. A., & Kallman, T. R. 2001, ApJS, 134, 139 [Google Scholar]
- Beck, R., & Krause, M. 2005, Astron. Nachr., 326, 414 [Google Scholar]
- Bennett, C. L., Hill, R. S., Hinshaw, G., et al. 2003, VizieR Online Data Catalog: J/ApJS/148/97 [Google Scholar]
- Beuchert, T., Rodríguez-Ardila, A., Moss, V. A., et al. 2018, A&A, 612, L4 [NASA ADS] [CrossRef] [EDP Sciences] [Google Scholar]
- Bicknell, G. V., Mukherjee, D., Wagner, A. Y., Sutherland, R. S., & Nesvadba, N. P. H. 2018, MNRAS, 475, 3493 [NASA ADS] [CrossRef] [Google Scholar]
- Bolton, J. G., & Butler, P. W. 1975, Aust. J. Phys. Astrophys. Suppl., 34, 33 [NASA ADS] [Google Scholar]
- Böttcher, M. 2007, Ap&SS, 309, 95 [CrossRef] [Google Scholar]
- Böttcher, M., & Dermer, C. D. 2010, ApJ, 711, 445 [CrossRef] [Google Scholar]
- Celotti, A., & Ghisellini, G. 2008, MNRAS, 385, 283 [NASA ADS] [CrossRef] [Google Scholar]
- Chen, X., Abramowicz, M. A., Lasota, J.-P., Narayan, R., & Yi, I. 1995, ApJ, 443, L61 [Google Scholar]
- Condon, J. J., & Broderick, J. J. 1988, AJ, 96, 30 [NASA ADS] [CrossRef] [Google Scholar]
- Cutri, R. M., Skrutskie, M. F., van Dyk, S., et al. 2003, VizieR Online Data Catalog: II/246 [Google Scholar]
- Czerny, B., Siemiginowska, A., Janiuk, A., Nikiel-Wroczyński, B., & Stawarz, L. 2009, ApJ, 698, 840 [NASA ADS] [CrossRef] [Google Scholar]
- Dallacasa, D., Stanghellini, C., Centonza, M., & Fanti, R. 2000, A&A, 363, 887 [NASA ADS] [Google Scholar]
- de Vaucouleurs, G., de Vaucouleurs, A., Corwin, Jr., H. G., et al. 1991, S&T, 82, 621 [Google Scholar]
- de Vries, W. H., Barthel, P. D., & O’Dea, C. P. 1997, A&A, 321, 105 [NASA ADS] [Google Scholar]
- De Young, D. S. 1991, ApJ, 371, 69 [NASA ADS] [CrossRef] [Google Scholar]
- Dicken, D., Tadhunter, C., Axon, D., et al. 2012, ApJ, 745, 172 [NASA ADS] [CrossRef] [Google Scholar]
- Fabbiano, G. 2019, in The Chandra X-ray Observatory, eds. B. Wilkes, & W. Tucker (IOP Publishing), 7 [Google Scholar]
- Filippenko, A. V. 1985, ApJ, 289, 475 [NASA ADS] [CrossRef] [Google Scholar]
- Fisher, R. A. 1922, J. R. Stat. Soc., 85, 87 [CrossRef] [Google Scholar]
- Fruscione, A., McDowell, J. C., Allen, G. E., et al. 2006, SPIE Conf. Ser., 6270, 62701V [Google Scholar]
- Gabuzda, D. 2017, Galaxies, 5, 11 [Google Scholar]
- Giroletti, M., & Polatidis, A. 2009, Astron. Nachr., 330, 193 [Google Scholar]
- Gold, B., Odegard, N., Weiland, J. L., et al. 2011, ApJS, 192, 15 [Google Scholar]
- Gonçalves, A. C., & Serote Roos, M. 2004, A&A, 413, 97 [NASA ADS] [CrossRef] [EDP Sciences] [Google Scholar]
- González-Martín, O., Masegosa, J., Márquez, I., Guainazzi, M., & Jiménez-Bailón, E. 2009, A&A, 506, 1107 [NASA ADS] [CrossRef] [EDP Sciences] [Google Scholar]
- Gregory, P. C., Vavasour, J. D., Scott, W. K., & Condon, J. J. 1994, ApJS, 90, 173 [NASA ADS] [CrossRef] [Google Scholar]
- Harrison, F. A., Craig, W. W., Christensen, F. E., et al. 2013, ApJ, 770, 103 [Google Scholar]
- Healey, S. E., Romani, R. W., Taylor, G. B., et al. 2007, ApJS, 171, 61 [Google Scholar]
- Heckman, T. M. 1980, A&A, 87, 152 [Google Scholar]
- HI4PI Collaboration (Ben Bekhti, N., et al.) 2016, A&A, 594, A116 [NASA ADS] [CrossRef] [EDP Sciences] [Google Scholar]
- Hickox, R. C., & Alexander, D. M. 2018, ARA&A, 56, 625 [Google Scholar]
- Ichimaru, S. 1977, ApJ, 214, 840 [NASA ADS] [CrossRef] [Google Scholar]
- Ito, H., Kino, M., Kawakatu, N., & Yamada, S. 2011, ApJ, 730, 120 [NASA ADS] [CrossRef] [Google Scholar]
- Kallman, T., & Bautista, M. 2001, ApJS, 133, 221 [Google Scholar]
- Kawakatu, N., Nagai, H., & Kino, M. 2008, ApJ, 687, 141 [NASA ADS] [CrossRef] [Google Scholar]
- Kiehlmann, S., Lister, M. L., Readhead, A. C. S., et al. 2024, ApJ, 961, 240 [NASA ADS] [CrossRef] [Google Scholar]
- Kim, D.-W. 1989, ApJ, 346, 653 [Google Scholar]
- Kino, M., & Asano, K. 2011, MNRAS, 412, L20 [CrossRef] [Google Scholar]
- Kino, M., Ito, H., Kawakatu, N., & Orienti, M. 2013, ApJ, 764, 134 [NASA ADS] [CrossRef] [Google Scholar]
- Kosmaczewski, E., Stawarz, Ł., Siemiginowska, A., et al. 2020, ApJ, 897, 164 [NASA ADS] [CrossRef] [Google Scholar]
- Lehmer, B. D., Basu-Zych, A. R., Mineo, S., et al. 2016, ApJ, 825, 7 [Google Scholar]
- Lister, M. L., Homan, D. C., Kovalev, Y. Y., et al. 2020, ApJ, 899, 141 [NASA ADS] [CrossRef] [Google Scholar]
- Lucchini, M., Markoff, S., Crumley, P., Krauß, F., & Connors, R. M. T. 2019, MNRAS, 482, 4798 [CrossRef] [Google Scholar]
- Maccagni, F. M., Morganti, R., Oosterloo, T. A., & Mahony, E. K. 2014, A&A, 571, A67 [NASA ADS] [CrossRef] [EDP Sciences] [Google Scholar]
- Maccagni, F. M., Morganti, R., Oosterloo, T. A., Oonk, J. B. R., & Emonts, B. H. C. 2018, A&A, 614, A42 [NASA ADS] [CrossRef] [EDP Sciences] [Google Scholar]
- Massaglia, S., Bodo, G., Rossi, P., Capetti, S., & Mignone, A. 2019, A&A, 621, A132 [NASA ADS] [CrossRef] [EDP Sciences] [Google Scholar]
- Massardi, M., Ekers, R. D., Murphy, T., et al. 2008, MNRAS, 384, 775 [NASA ADS] [CrossRef] [Google Scholar]
- Massardi, M., López-Caniego, M., González-Nuevo, J., et al. 2009, MNRAS, 392, 733 [Google Scholar]
- Massaro, E., Tramacere, A., Perri, M., Giommi, P., & Tosti, G. 2006, A&A, 448, 861 [NASA ADS] [CrossRef] [EDP Sciences] [Google Scholar]
- Meyer, M. J., Zwaan, M. A., Webster, R. L., et al. 2004, MNRAS, 350, 1195 [Google Scholar]
- Migliori, G., Siemiginowska, A., Kelly, B. C., et al. 2014, ApJ, 780, 165 [Google Scholar]
- Migliori, G., Siemiginowska, A., Sobolewska, M., et al. 2016, ApJ, 821, L31 [NASA ADS] [CrossRef] [Google Scholar]
- Mimica, P., & Aloy, M. A. 2012, MNRAS, 421, 2635 [NASA ADS] [CrossRef] [Google Scholar]
- Mukherjee, D., Bicknell, G. V., Sutherland, R., & Wagner, A. 2017, MNRAS, 471, 2790 [NASA ADS] [CrossRef] [Google Scholar]
- Mukherjee, D., Bicknell, G. V., Wagner, A. Y., Sutherland, R. S., & Silk, J. 2018, MNRAS, 479, 5544 [NASA ADS] [CrossRef] [Google Scholar]
- Mukherjee, D., Bodo, G., Rossi, P., Mignone, A., & Vaidya, B. 2021, MNRAS, 505, 2267 [NASA ADS] [CrossRef] [Google Scholar]
- Murphy, T., Sadler, E. M., Ekers, R. D., et al. 2010, MNRAS, 402, 2403 [Google Scholar]
- Narayan, R., & Yi, I. 1994, ApJ, 428, L13 [Google Scholar]
- Narayan, R., & Yi, I. 1995a, ApJ, 444, 231 [Google Scholar]
- Narayan, R., & Yi, I. 1995b, ApJ, 452, 710 [NASA ADS] [CrossRef] [Google Scholar]
- O’Dea, C. P., & Baum, S. A. 1997, AJ, 113, 148 [CrossRef] [Google Scholar]
- O’Dea, C. P., & Saikia, D. J. 2021, A&ARv., 29, 3 [CrossRef] [Google Scholar]
- O’Dea, C. P., Baum, S. A., & Stanghellini, C. 1991, ApJ, 380, 66 [CrossRef] [Google Scholar]
- Orienti, M. 2016, Astron. Nachr., 337, 9 [Google Scholar]
- Orienti, M., & Dallacasa, D. 2014, MNRAS, 438, 463 [NASA ADS] [CrossRef] [Google Scholar]
- Ostorero, L., Moderski, R., Stawarz, Ł., et al. 2010, ApJ, 715, 1071 [NASA ADS] [CrossRef] [Google Scholar]
- Ostorero, L., Morganti, R., Diaferio, A., et al. 2017, ApJ, 849, 34 [CrossRef] [Google Scholar]
- O’Sullivan, S. P., & Gabuzda, D. C. 2009, MNRAS, 400, 26 [Google Scholar]
- Peck, A. B., & Taylor, G. B. 1998, ApJ, 502, L23 [NASA ADS] [CrossRef] [Google Scholar]
- Perlman, E. S., Stocke, J. T., Conway, J., & Reynolds, C. 2001, AJ, 122, 536 [NASA ADS] [CrossRef] [Google Scholar]
- Planck Collaboration VI. 2020, A&A, 641, A6 [NASA ADS] [CrossRef] [EDP Sciences] [Google Scholar]
- Principe, G., Migliori, G., Johnson, T. J., et al. 2020, A&A, 635, A185 [NASA ADS] [CrossRef] [EDP Sciences] [Google Scholar]
- Principe, G., Di Venere, L., Orienti, M., et al. 2021, MNRAS, 507, 4564 [NASA ADS] [CrossRef] [Google Scholar]
- Pudritz, R. E., Hardcastle, M. J., & Gabuzda, D. C. 2012, Space Sci. Rev., 169, 27 [CrossRef] [Google Scholar]
- Ramos Almeida, C., & Ricci, C. 2017, Nat. Astron., 1, 679 [Google Scholar]
- Readhead, A. C. S., Xu, W., Pearson, T. J., Wilkinson, P. N., & Polatidis, A. G. 1994, in Compact Extragalactic Radio Sources, eds. J. A. Zensus, & K. I. Kellermann, 17 [Google Scholar]
- Readhead, A. C. S., Taylor, G. B., Xu, W., et al. 1996a, ApJ, 460, 612 [NASA ADS] [CrossRef] [Google Scholar]
- Readhead, A. C. S., Taylor, G. B., Pearson, T. J., & Wilkinson, P. N. 1996b, ApJ, 460, 634 [NASA ADS] [CrossRef] [Google Scholar]
- Readhead, A. C. S., Kiehlmann, S., Lister, M. L., et al. 2021, Astron. Nachr., 342, 1185 [NASA ADS] [CrossRef] [Google Scholar]
- Ricci, R., Prandoni, I., Gruppioni, C., Sault, R. J., & de Zotti, G. 2006, A&A, 445, 465 [NASA ADS] [CrossRef] [EDP Sciences] [Google Scholar]
- Sadler, E. M., Ricci, R., Ekers, R. D., et al. 2006, MNRAS, 371, 898 [Google Scholar]
- Siemiginowska, A. 2009, Astron. Nachr., 330, 264 [NASA ADS] [CrossRef] [Google Scholar]
- Siemiginowska, A., Sobolewska, M., Migliori, G., et al. 2016, ApJ, 823, 57 [NASA ADS] [CrossRef] [Google Scholar]
- Sobolewska, M., Siemiginowska, A., Guainazzi, M., et al. 2019a, ApJ, 871, 71 [NASA ADS] [CrossRef] [Google Scholar]
- Sobolewska, M., Siemiginowska, A., Guainazzi, M., et al. 2019b, ApJ, 884, 166 [CrossRef] [Google Scholar]
- Sobolewska, M., Migliori, G., Ostorero, L., et al. 2022, ApJ, 941, 52 [NASA ADS] [CrossRef] [Google Scholar]
- Sobolewska, M., Siemiginowska, A., Migliori, G., et al. 2023, ApJ, 948, 81 [NASA ADS] [CrossRef] [Google Scholar]
- Stawarz, Ł., Ostorero, L., Begelman, M. C., et al. 2008, ApJ, 680, 911 [NASA ADS] [CrossRef] [Google Scholar]
- Sutherland, R. S., & Bicknell, G. V. 2007, Astrophys. Space Sci., 311, 293 [NASA ADS] [CrossRef] [Google Scholar]
- Taylor, G. B., Wrobel, J. M., & Vermeulen, R. C. 1998, ApJ, 498, 619 [NASA ADS] [CrossRef] [Google Scholar]
- Tengstrand, O., Guainazzi, M., Siemiginowska, A., et al. 2009, A&A, 501, 89 [NASA ADS] [CrossRef] [EDP Sciences] [Google Scholar]
- Tingay, S. J., & de Kool, M. 2003, AJ, 126, 723 [Google Scholar]
- Tingay, S. J., Jauncey, D. L., Reynolds, J. E., et al. 1997, AJ, 113, 2025 [NASA ADS] [CrossRef] [Google Scholar]
- Tingay, S. J., Reynolds, J. E., Tzioumis, A. K., et al. 2002, ApJS, 141, 311 [NASA ADS] [CrossRef] [Google Scholar]
- Tingay, S. J., Macquart, J.-P., Collier, J. D., et al. 2015, AJ, 149, 74 [NASA ADS] [CrossRef] [Google Scholar]
- Tramacere, A. 2020, Astrophysics Source Code Library [record ascl:2009.001] [Google Scholar]
- Tramacere, A., Giommi, P., Perri, M., Verrecchia, F., & Tosti, G. 2009, A&A, 501, 879 [NASA ADS] [CrossRef] [EDP Sciences] [Google Scholar]
- Tramacere, A., Massaro, E., & Taylor, A. M. 2011, ApJ, 739, 66 [Google Scholar]
- Tremblay, S. E., Taylor, G. B., Ortiz, A. A., et al. 2016, MNRAS, 459, 820 [NASA ADS] [CrossRef] [Google Scholar]
- Vaidya, B., Mignone, A., Bodo, G., Rossi, P., & Massaglia, S. 2018, ApJ, 865, 144 [Google Scholar]
- van Breugel, W., Miley, G., & Heckman, T. 1984, AJ, 89, 5 [Google Scholar]
- van den Bosch, R. C. E., Gebhardt, K., Gültekin, K., Yıldırım, A., & Walsh, J. L. 2015, ApJS, 218, 10 [Google Scholar]
- Veron-Cetty, M. P., Woltjer, L., Ekers, R. D., & Staveley-Smith, L. 1995, A&A, 297, L79 [NASA ADS] [Google Scholar]
- Wagner, A. Y., & Bicknell, G. V. 2011, ApJ, 728, 29 [NASA ADS] [CrossRef] [Google Scholar]
- Willett, K., Stocke, J., Darling, J., & Perlman, E. 2010, ApJ, 713, 1393 [NASA ADS] [CrossRef] [Google Scholar]
- Wright, A., & Otrupcek, R. 1990, PKS Catalog, 1990 [Google Scholar]
- Wright, E. 2006, PASP, 118, 1711 [NASA ADS] [CrossRef] [Google Scholar]
- Wright, E. L., Chen, X., Odegard, N., et al. 2009, ApJS, 180, 283 [NASA ADS] [CrossRef] [Google Scholar]
- Wójtowicz, A., Stawarz, Ł., Cheung, C. C., et al. 2020, ApJ, 892, 116 [CrossRef] [Google Scholar]
- Zdziarski, A. A., Pjanka, P., Sikora, M., & Stawarz, Ł. 2014, MNRAS, 442, 3243 [NASA ADS] [CrossRef] [Google Scholar]
- Zovaro, H. R. M., Sharp, R., Nesvadba, N. P. H., et al. 2019a, MNRAS, 484, 3393 [CrossRef] [Google Scholar]
- Zovaro, H. R. M., Nesvadba, N. P. H., Sharp, R., et al. 2019b, MNRAS, 489, 4944 [CrossRef] [Google Scholar]
All Tables
All Figures
|
Fig. 1. NuSTAR/FPMA images of 1718–649 (left panel) and 1146+596 (right panel) in the 3–19 keV energy range. The white circular regions of 30″ in radius were used to extract the spectra of the sources. A Gaussian smoothing filter (σ = 1 pixel, native pixel size) was applied for graphical reasons. The first NuSTAR detection of 1718–649 and 1146+596 are at more than 14 σ and 9 σ, respectively. |
| In the text | |
|
Fig. 2. XMM-Newton/pn and NuSTAR spectra of 1718–649 fitted with model III in the 0.35–19 keV energy range (see Table 4). XMM-Newton/pn data are shown in blue, while NuSTAR/FPMA and FPMB data are in red and green, respectively. To make spectra clearer, XMM-Newton data are also graphically rebinned. |
| In the text | |
|
Fig. 3. Chandra and NuSTAR spectra of 1146+596 fitted with model IV (panel a) and model V (panel b) in the 0.3 − 19 keV energy range (see Table 5). Chandra, NuSTAR FPMA, and NuSTAR FPMB data are shown in blue, red, and green, respectively. |
| In the text | |
|
Fig. 4. Observed broadband SED of 1718–649 and theoretical model by Sobolewska et al. (2022). No formal fitting was performed. Gray circles are archival data from Sobolewska et al. (2022) and references therein. The butterfly light blue region is Fermi-LAT constraints from Principe et al. (2021). Dark orange data are XMM-Newton-NuSTAR luminosity constraints from the present work. Broadband model components are as follows: self-absorbed synchrotron radiation and SSC (the solid thin black line); dashed lines represent three blackbody components (IR in dark red, starlight in black, accretion disk photon fields in light blue), and their corresponding IC components originating from a single radio lobe with the same colors. The solid orange line illustrates the contribution of a low-luminosity X-ray nuclear emission (a weak X-ray corona or an ADAF-type emission). The black solid line is the sum of the different high-energy components. |
| In the text | |
|
Fig. 5. Observed broadband SED of 1146+596 and theoretical model 1 (panel a) and model 2 (panel b). No formal fitting was performed. The model parameters are listed in Table 6. Gray circles are data from Balasubramaniam et al. (2021) and reference therein. Blue data are Fermi-LAT luminosity constraints from Principe et al. (2020). Dark orange data are Chandra–NuSTAR luminosity constraints from the present work. Broadband model components are as follows: synchrotron and SSC curves in red, green, and violet (from Massaro et al. 2006; Tramacere et al. 2009, 2011; Tramacere 2020), three black-body components representing the torus, the host galaxy, and the disk emission in red, black, and blue, respectively. The solid orange line in model 2 illustrates the contribution of a low-luminosity X-ray nuclear emission (a weak X-ray corona or an ADAF-type emission). The black solid line is the sum of the different components related to the central AGN. |
| In the text | |
|
Fig. 6. Parameter space of SED models for 1146+596. Data points are shown with circles and squares for Model 1 and 2, respectively. The linear relations between the magnetic field strength and the particles density found for Models 1 and 2 are reported in red and blue, where p0 and p1 are the angular coefficient and the normalization. A star marker is used to highlight models for which parameters are listed in Table 6. |
| In the text | |
|
Fig. 7. Luminosity at 5 GHz versus radio source size proposed by Sobolewska et al. (2019a; S19). Literature data are selected as in Sect. 6.1. 1718–649 and 1146+596 are marked with squares. Color coding indicates the intrinsic equivalent hydrogen column density measured from the X-ray spectra. Red and blue solid lines mark the linear relations fitted on obscured (NH ≥ 1023 cm−2) and unobscured (NH < 1023 cm−2) sources, where p0 and p1 are the angular coefficient and the normalization, respectively. The r-val stands for the Pearson correlation coefficient. Figure adapted from S19. |
| In the text | |
Current usage metrics show cumulative count of Article Views (full-text article views including HTML views, PDF and ePub downloads, according to the available data) and Abstracts Views on Vision4Press platform.
Data correspond to usage on the plateform after 2015. The current usage metrics is available 48-96 hours after online publication and is updated daily on week days.
Initial download of the metrics may take a while.