Open Access
Fig. 3.
Download original image
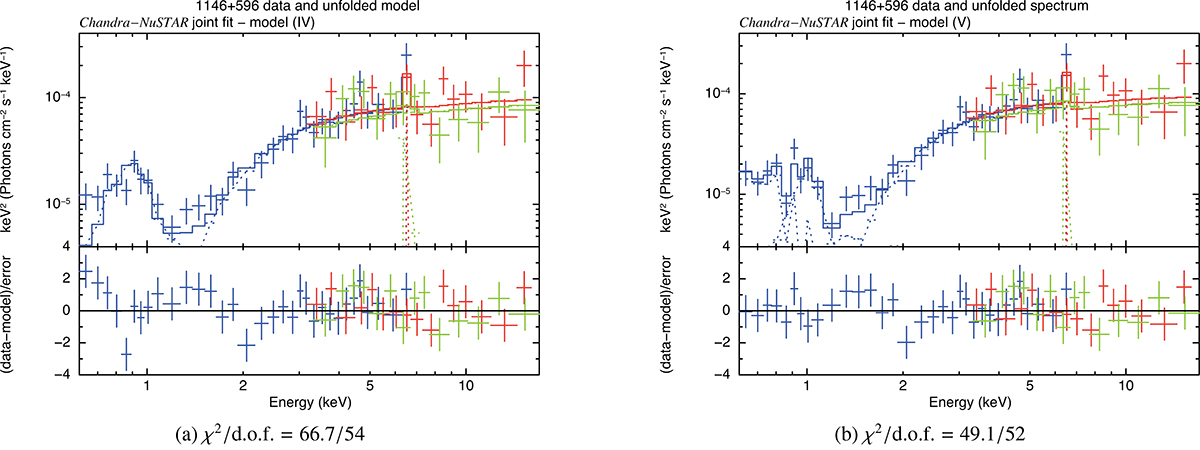
Chandra and NuSTAR spectra of 1146+596 fitted with model IV (panel a) and model V (panel b) in the 0.3 − 19 keV energy range (see Table 5). Chandra, NuSTAR FPMA, and NuSTAR FPMB data are shown in blue, red, and green, respectively.
Current usage metrics show cumulative count of Article Views (full-text article views including HTML views, PDF and ePub downloads, according to the available data) and Abstracts Views on Vision4Press platform.
Data correspond to usage on the plateform after 2015. The current usage metrics is available 48-96 hours after online publication and is updated daily on week days.
Initial download of the metrics may take a while.