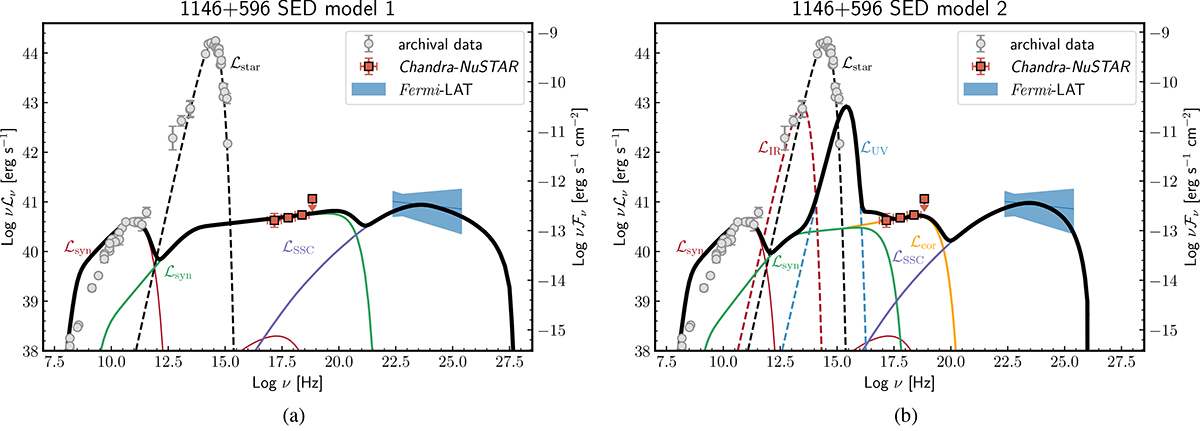
Fig. 5.
Download original image
Observed broadband SED of 1146+596 and theoretical model 1 (panel a) and model 2 (panel b). No formal fitting was performed. The model parameters are listed in Table 6. Gray circles are data from Balasubramaniam et al. (2021) and reference therein. Blue data are Fermi-LAT luminosity constraints from Principe et al. (2020). Dark orange data are Chandra–NuSTAR luminosity constraints from the present work. Broadband model components are as follows: synchrotron and SSC curves in red, green, and violet (from Massaro et al. 2006; Tramacere et al. 2009, 2011; Tramacere 2020), three black-body components representing the torus, the host galaxy, and the disk emission in red, black, and blue, respectively. The solid orange line in model 2 illustrates the contribution of a low-luminosity X-ray nuclear emission (a weak X-ray corona or an ADAF-type emission). The black solid line is the sum of the different components related to the central AGN.
Current usage metrics show cumulative count of Article Views (full-text article views including HTML views, PDF and ePub downloads, according to the available data) and Abstracts Views on Vision4Press platform.
Data correspond to usage on the plateform after 2015. The current usage metrics is available 48-96 hours after online publication and is updated daily on week days.
Initial download of the metrics may take a while.