Fig. 7.
Download original image
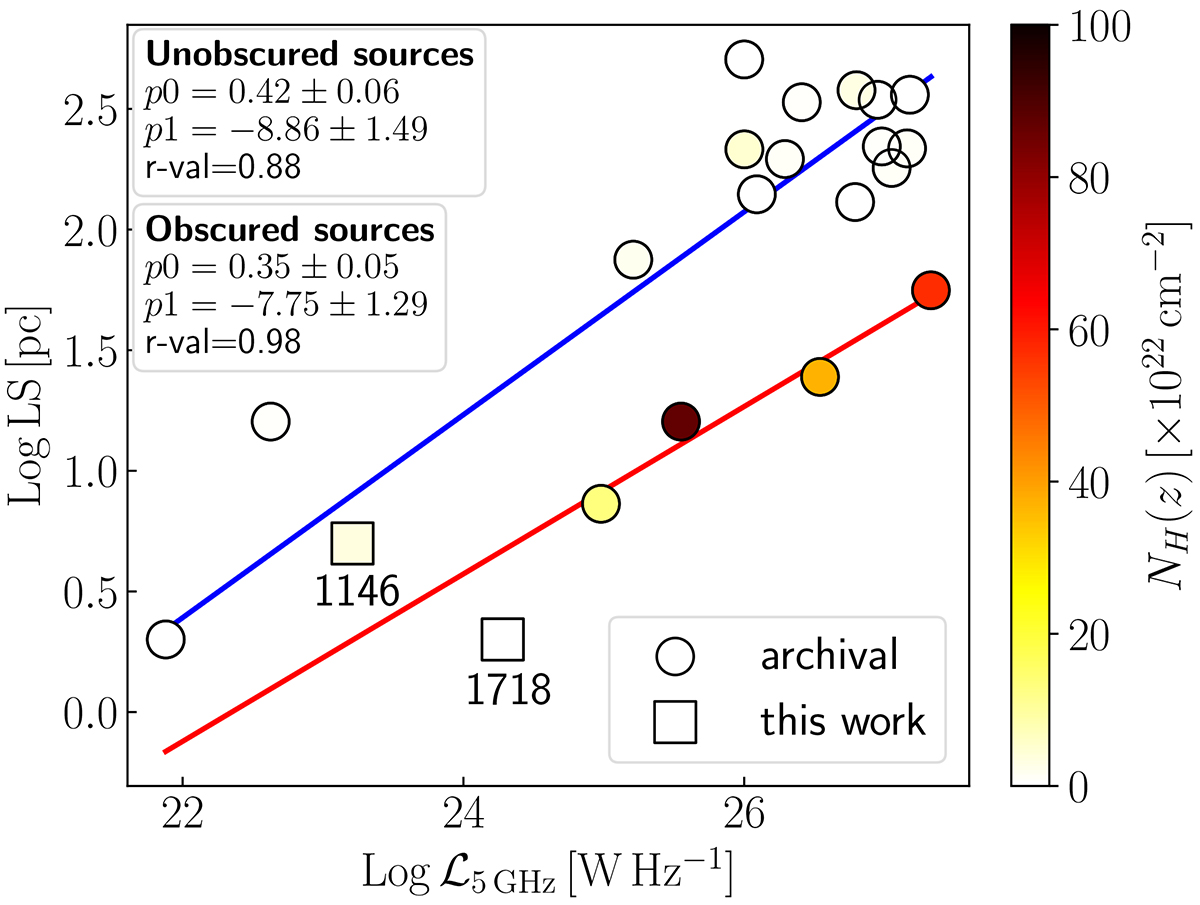
Luminosity at 5 GHz versus radio source size proposed by Sobolewska et al. (2019a; S19). Literature data are selected as in Sect. 6.1. 1718–649 and 1146+596 are marked with squares. Color coding indicates the intrinsic equivalent hydrogen column density measured from the X-ray spectra. Red and blue solid lines mark the linear relations fitted on obscured (NH ≥ 1023 cm−2) and unobscured (NH < 1023 cm−2) sources, where p0 and p1 are the angular coefficient and the normalization, respectively. The r-val stands for the Pearson correlation coefficient. Figure adapted from S19.
Current usage metrics show cumulative count of Article Views (full-text article views including HTML views, PDF and ePub downloads, according to the available data) and Abstracts Views on Vision4Press platform.
Data correspond to usage on the plateform after 2015. The current usage metrics is available 48-96 hours after online publication and is updated daily on week days.
Initial download of the metrics may take a while.