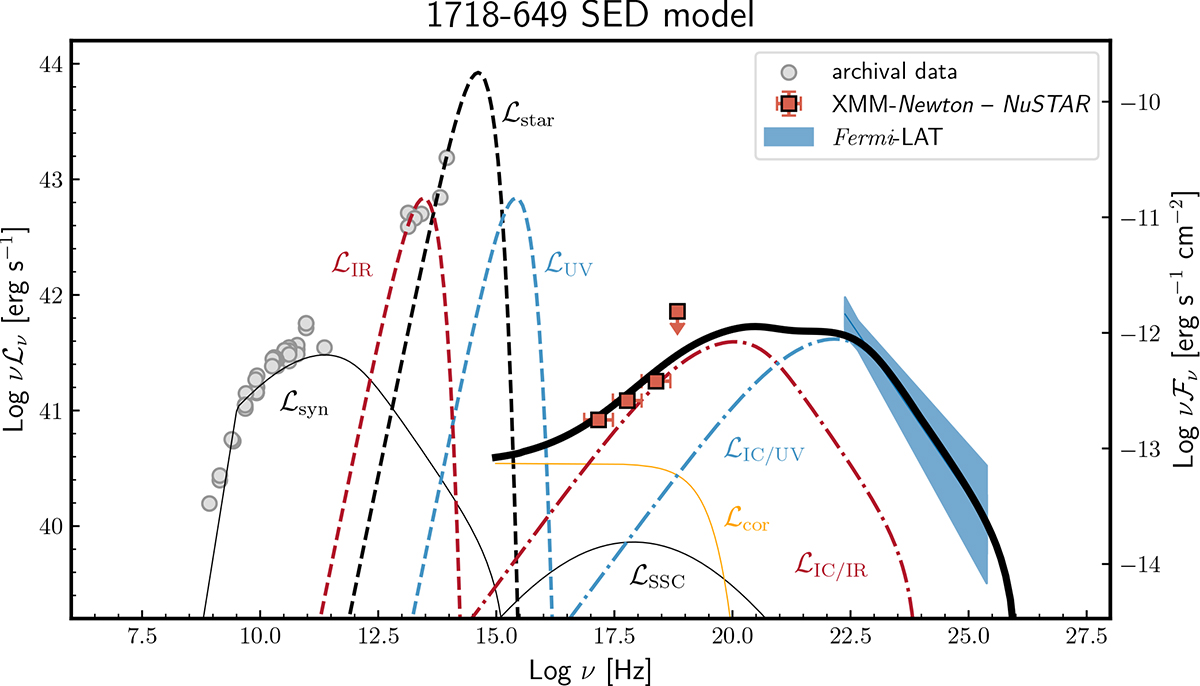
Fig. 4.
Download original image
Observed broadband SED of 1718–649 and theoretical model by Sobolewska et al. (2022). No formal fitting was performed. Gray circles are archival data from Sobolewska et al. (2022) and references therein. The butterfly light blue region is Fermi-LAT constraints from Principe et al. (2021). Dark orange data are XMM-Newton-NuSTAR luminosity constraints from the present work. Broadband model components are as follows: self-absorbed synchrotron radiation and SSC (the solid thin black line); dashed lines represent three blackbody components (IR in dark red, starlight in black, accretion disk photon fields in light blue), and their corresponding IC components originating from a single radio lobe with the same colors. The solid orange line illustrates the contribution of a low-luminosity X-ray nuclear emission (a weak X-ray corona or an ADAF-type emission). The black solid line is the sum of the different high-energy components.
Current usage metrics show cumulative count of Article Views (full-text article views including HTML views, PDF and ePub downloads, according to the available data) and Abstracts Views on Vision4Press platform.
Data correspond to usage on the plateform after 2015. The current usage metrics is available 48-96 hours after online publication and is updated daily on week days.
Initial download of the metrics may take a while.