| Issue |
A&A
Volume 684, April 2024
|
|
|---|---|---|
| Article Number | A209 | |
| Number of page(s) | 7 | |
| Section | Astrophysical processes | |
| DOI | https://doi.org/10.1051/0004-6361/202347331 | |
| Published online | 25 April 2024 | |
Rethinking the 67 Hz QPO in GRS 1915+105: Type C quasi-periodic oscillations at the innermost stable circular orbit
Istituto Nazionale di Astrofisica, Osservatorio Astronomico di Brera, via E. Bianchi 46, 23807 Merate, (LC), Italy
e-mail: This email address is being protected from spambots. You need JavaScript enabled to view it.
Received:
30
June
2023
Accepted:
1
February
2024
Abstract
Context. We study quasi-periodic oscillations (QPO) at low and high frequency in the variability of the high-energy emission from black hole binaries and their physical interpretation in terms of signatures of General Relativity in the strong-field regime.
Aims. We wish to understand the nature of the 67 Hz QPOs observed in the X-ray emission of the peculiar black hole binary GRS 1915+105 within the general classification of QPOs, and to determine the spin of the black hole in the system by applying the relativistic precession model (RPM).
Methods. Within the RPM, the only relativistic frequency that is stable in time over a wide range of accretion rates and can be as low as 67 Hz (for a dynamically measured black hole mass) is the nodal frequency at the innermost stable circular orbit (ISCO). In the application of the model, this corresponds to type C QPOs. Under this assumption, it is possible to measure the spin of the black hole by using the mass of the black hole previously obtained via dynamical measurements. We re-analysed a large number of Rossi-XTE observations to determine whether other timing features confirm this hypothesis.
Results. The identification of the 67 Hz QPO as the nodal frequency at ISCO yields a value of 0.706 ± 0.034 for the black hole spin. With this spin, the only two QPO detections at higher frequencies available in the literature are consistent with being orbital frequencies at a radius outside ISCO. The high-frequency bumps often observed at frequencies between 10 and 200 Hz follow the correlation expected for orbital and periastron-precession frequencies at even larger radii.
Key words: accretion / accretion disks / black hole physics / relativistic processes / stars: black holes / X-rays: binaries
Deceased.
© The Authors 2024
 Open Access article, published by EDP Sciences, under the terms of the Creative Commons Attribution License (https://creativecommons.org/licenses/by/4.0), which permits unrestricted use, distribution, and reproduction in any medium, provided the original work is properly cited.
This article is published in open access under the Subscribe to Open model. This email address is being protected from spambots. You need JavaScript enabled to view it. to support open access publication.
1. Introduction
Quasi-periodic oscillations (QPOs) are variability features that are frequently observed in the X-ray emissions of compact objects undergoing accretion. These oscillations are thought to originate from the innermost regions of the accretion flow. In a power density spectrum (PDS), QPOs manifest as relatively narrow peaks, and their centroid frequency can be linked to dynamic motion and/or accretion-related timescales. QPOs have been known for several decades, but their precise nature remains enigmatic. Numerous models have been proposed to explain their origin, leading to ongoing debates in the field (see Ingram & Motta 2019, for a recent review).
At low frequencies (< 30 Hz), three flavours of QPO have been observed in black hole (BH) X-ray binaries (e.g., Wijnands & van der Klis 1999; Remillard et al. 2002; Casella et al. 2004, 2005). The centroid frequency of the most common of these types of QPOs, called type C QPOs (Casella et al. 2005), can vary over a broad range (∼0.1–30 Hz). Although other models have been proposed (see, e.g, Belloni & Stella 2014, for a review), type-C QPOs have often been explained as a manifestation of the nodal precession (or its weak-field approximation, the Lense-Thirring precession) of plasma orbiting the BH (e.g., Stella & Vietri 1998; Ingram et al. 2009). They were also associated with QPOs observed in neutron star (NS) X-ray binaries, where they are called horizontal branch oscillations (HBO), suggesting that the same process is at work in both classes of systems (Psaltis et al. 1999; Casella et al. 2005; Motta et al. 2017). In addition, QPOs with centroid frequencies above some hundred Hertz (up to ∼500 Hz), were observed in a small number of BH systems, but very rarely (e.g., Belloni et al. 2012), either isolated or in pairs, but in an even smaller number of cases. These high-frequency oscillations are referred to as high-frequency QPOs (HFQPOs).
Within the theory of General Relativity (GR), a particle in a bound orbit around a massive object, together with the orbital frequency (νϕ), has two additional frequencies associated with it, the vertical and radial epicyclic frequencies (νθ and νr, respectively). From these frequencies, we can easily calculate two additional frequencies associated with the orbit: the nodal precession frequency (νnod = νϕ - νθ), and the periastron precession frequency (νper = νϕ - νr). The gas accreting onto a BH can be seen as made of orbiting particles, and therefore, it is possible that the observed characteristic timescales yielded by the QPOs are the products of relativistic effects that can be associated with the aforementioned frequencies. If this association is established, it represents a powerful diagnostic tool for GR in the strong-field regime and for the physics of accretion.
Along these lines, the relativistic precession model (RPM Stella & Vietri 1998; Stella et al. 1999; Stella & Vietri 1999) associates the nodal, periastron precession, and orbital frequency with the type-C QPO and the two HFQPOs (lower and upper, respectively) observed in the light curves of accreting BHs and NSs. For BHs, the number of detections of HFQPOs is very low, and they are even more rarely visible together with a type-C QPO. Despite the scarcity of data, Motta et al. (2014a,b, 2022) showed that the RPM can be associated with the QPOs and broad noise components observed in the BH binaries GRO J1655-40, XTE J1550-564 and XTE J1859+226. These works showed that the application of the RPM allows the self-consistent estimation of the spin and mass of a BH from timing features.
The bright BH binary GRS 1915+105 went into outburst in 1992 and is still active, although in a low-flux state (see, e.g., Motta et al. 2021). This system is known to be rather peculiar, displaying extreme structured variability on timescales longer than one second (see Fender & Belloni 2004, for a review). Despite these peculiarities, the PDS from GRS 1915+105 is not unlike that of other BH binaries, and strong type-C QPOs have been observed in its harder states (e.g., Markwardt et al. 1997; Ratti et al. 2012). At variance with other systems, GRS 1915+105 has shown a number of features at high frequencies that were classified as HFQPOs. In particular, a peak around 67 Hz was consistently detected with Rossi X-ray Timing Explorer (RXTE) for the 16 years of operation of the satellite and in the past few years also by Astrosat (see, e.g., Morgan et al. 1997; Belloni & Altamirano 2013b; Belloni et al. 2019). This QPO was never observed together with a type-C QPO and represents a very stable frequency in the system.
We show that the features that so far were classified as HFQPOs in GRS 1915+105 are instead consistent with being type-C QPOs produced near the innermost stable circular orbit (ISCO). Based on this assumption, we infer the spin of the BH hosted in GRS 1915+105, and we show that the inferred spin, coupled with the dynamical BH mass measurement, can be used to predict theoretical frequencies that match the data.
2. Rethinking the 67 Hz QPO
Belloni & Altamirano (2013b) reported a compilation of all the HFQPOs found in a systematic search performed on all the available RXTE data for GRS 1915+105. The centroid frequencies of 49 of the 51 peaks reported in this work are found between 58 and 72 Hz (a histogram of these frequencies is shown in Fig. A.1). The two remaining peaks, detected at ∼134 and 143 Hz, are discussed in Sect. 3.1.
The frequencies of these 49 QPOs are distributed in a narrow range centred around 67 Hz, and henceforth, we refer to these QPOs collectively as the 67 Hz QPOs, aware that in reality, they span a range of frequencies. This narrow range implies that they are determined by a parameter that along with mass and spin has to remain unchanged despite large swings in accretion rate. The most obvious candidate is the ISCO, which itself only depends on the mass and spin of the central black hole. The shape of the histogram in Fig. A.1 supports this, as it shows a clear drop at frequencies slightly above 67 Hz.
When we calculate the orbital frequency at ISCO (which at this radius equals the periastron precession frequency) for a dimensionless spin parameter1 (hereafter spin) a* = 0 and a mass of 14.4 (i.e. the upper limit on the mass based on the values reported by Reid et al. 2014,  M⊙), we obtain ∼152 Hz. We deliberately ignored solutions in which the spin counter-rotated, based on the assumption that the BH spin and the angular momentum of the matter in the accretion disk are unlikely to be anti-parallel (Motta et al. 2018, for a discussion). 152 Hz is the minimum possible orbital frequency in GRS 1915+105 at ISCO, as any higher BH spin value and any lower mass yield higher frequencies. Thus, the 67 Hz QPOs are not consistent with being the result of the orbital motion of matter at the ISCO.
An intriguing possibility is that the 67 Hz QPO is the result of nodal precession at the ISCO. This would imply that the oscillations observed around 67 Hz are not HFQPOs, as was thought for decades, but are instead type-C QPOs arising very close to the ISCO. In this scenario, 67 Hz is the maximum possible centroid frequency for a type-C QPO for a given BH mass and spin. Consequently, the 67 Hz QPOs in GRS 1915+105 represent the high-frequency end of a broad distribution that includes all type-C QPOs in this system, which are most commonly observed below 10 Hz. The fact that a 67 Hz QPO has never been concurrently observed with another type-C QPO supports this hypothesis. This perspective also coherently clarifies why GRS 1915+105, unlike other BH X-ray binaries, exhibits numerous PDS peaks that were identified as HFQPOs: the 67 Hz QPOs would be reclassified not as HFQPOs, which are relatively rare in BH X-ray binaries, but rather as type-C QPOs, which occur more frequently in these systems.
To the best of our knowledge, the current literature lacks efforts to interpret the ∼67 Hz QPOs in GRS 1915+105 as anything other than HFQPOs (Morgan et al. 1997). Alternative models were previously proposed (see, e.g., Fragile et al. 2016; Ingram & Motta 2019), which might offer different interpretations of these QPOs, and which could be tested using the data considered here (all available in the literature). However, conducting tests like this is beyond the scope of of this work.
2.1. Considerations
In the scenario we outlined, three facts are worth mentioning. Firstly, the 67 Hz QPOs do not exhibit characteristics typical of Type-C QPOs. Secondly, additional QPOs were identified in GRS 1915+105 with frequencies similar to but inconsistent with the 67 Hz QPOs (Belloni & Altamirano 2013a, and references therein). Finally, at least one other source has been observed to exhibit a QPO at approximately 67 Hz. We discuss each of these points in detail below.
At first glance, the 67 Hz QPOs do not show the typical characteristics of type-C QPOs. While type-C QPOs at lower frequencies are generally superimposed on broad-band variability, the 67 Hz QPOs distinctively emerge from the Poisson noise. Additionally, these QPOs exhibit a relatively low rms amplitude (lower than 1%). These properties should not surprise. Firstly, the broad-band variability typical of BH XRBs, which always shows a cut-off between a few tenths of Hz and at a few Hz). Consequently, as the frequency of a QPO increases, it becomes increasingly probable for it to arise from Poisson noise rather than from broad-band variability. A similar situation can be observed in GRO J1655-40, where type-C QPOs observed in the soft state are observed at around 30 Hz in a region of the PDS that is dominated by Poisson noise. Furthermore, the amplitude of type-C QPOs is anti-correlated with the centroid frequency, and thus, higher-frequency oscillations are expected to show lower amplitudes (see, e.g., Motta et al. 2015).
Several authors reported the discovery of various QPO peaks in the PDS from GRS 1915+105 at 27 (Belloni et al. 2001), 34 (Belloni & Altamirano 2013a), and 41 Hz (Strohmayer 2001). The 34 Hz QPO can readily be interpreted as harmonically related to the 68 Hz QPO observed in the same PDS. This harmonic relation is a common feature of type-C QPOs, which makes the above unsurprising. Even the occurrence of an isolated 34 Hz QPO (i.e. without a concurrent higher-frequency harmonic peak) would not be unexpected. This is due to the variable amplitude of harmonically related peaks observed in several X-ray binaries, particularly in NS systems, where the most prominent and sometimes the only significant QPO peak does not necessarily correspond to the fundamental frequency of the modulation underlying the signal (Motta et al. 2017). Consequently, the detection of an orphan 27 Hz peak might be interpreted in a similar way, presuming an undetected fundamental peak at approximately 54 Hz. It is more challenging to provide a straightforward explanation for the 41 Hz frequency reported in Strohmayer (2001), which was detected concurrently with the 67 Hz QPO and yet appears to be unrelated to it. We hypothesise that these two QPOs, despite being observed in the same dataset spanning over 15 ks, might not be occurring strictly simultaneously. Under this assumption, the 41 Hz peak could be a type-C QPO at a lower frequency, with its frequency increasing to 67 Hz at a different time. However, this hypothesis requires further analysis for validation or refutation. We reserve this task for future work.
The 67 Hz QPO is not exclusive to GRS 1915+105 because a similar QPO at 66 Hz was detected in the candidate BH X-ray binary IGR J17091-3624 during its first observed outburst Altamirano & Belloni (2012). Notably, this QPO was observed only once throughout all recorded outbursts of the source, although some excess in the PDS around 66 Hz and 164 Hz was detected in a number of observations of the same outburst (Altamirano et al. 2011). While we cannot exclude this possibility, current evidence does not support the conclusion that this QPO is of the same type as the 67 Hz QPO observed in GRS 1915+105. Nonetheless, it is intriguing that of the known BH X-ray transients, the one exhibiting a QPO near 67 Hz phenomenologically resembles those observed in GRS 1915+105 (Altamirano et al. 2011; Motta et al. 2021). This similarity warrants further investigation, particularly if any future data were to confirm that the 66 Hz modulation in IGR J17091-3624 shares properties with the 67 Hz QPOs in GRS 1915+105.
2.2. The spin
Under the intriguing hypothesis that the 67 Hz QPOs arise from nodal precession in the proximity of ISCO, it is possible to obtain an estimate of the BH spin as follows. First, we fit the histogram in Fig. A.1 with a Gaussian function, we take the Gaussian peak frequency as the frequency of the QPO arising at ISCO, and the Gaussian FWHM as the 1σ error on this frequency. This yield νnod@ISCO = 67.7 ± 2.1 (see Table 1).
Summary of the quantities measured and derived in this work.
Next, we use the RPM to obtain an estimate of the spin. As described in Franchini et al. (2017), by substituting the expression of the radius of ISCO into the equation of the nodal precession frequency, we can remove the radial dependence and obtain an equation that only depends on the mass and spin of the BH. Adopting a BH mass of 12.4 M⊙ we obtain a spin of a* = 0.706 ± 0.034. The corresponding graphical solution is shown in Fig. 1. For this spin, the radius of the innermost stable circular orbit radius is RISCO = (3.36 ± 0.15) Rg (see Table 1).
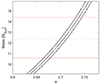 |
Fig. 1. Mass vs. spin solutions of the RPM obtained assuming that the nodal precession occurs at ISCO. The solutions corresponding to the frequency 67.712 +/− 1-sigma uncertainties are shown. The horizontal solid lines and the dotted line are the upper and lower limit to the dynamical mass and its central value, respectively ( |

As noted in Motta et al. (2022), we stress that if the RPM were an exact description of the behaviour of particles orbiting a BH, the uncertainties on the derived on the BH spin (and mass and emission radius) would only come from the uncertainties on the measured QPO frequencies, which are dominated by the accuracy of the detecting instrument. However, the exact geometry of the emitting region is unknown, and so is the exact emission mechanism behind QPOs. These two facts (and likely others) might be sources of systematics. For instance, in Motta et al. (2022), we gauged the uncertainties that could be related with the radial extent of the region in which the QPOs originate, and we found that these systematics would be about 15%. Since the effective impact of systematics on the spin estimate is hard to determine accurately, we caution that in the following (for simplicity and to avoid biasses), we report and use the uncertainties derived uniquely from the errors on the QPO centroid frequencies.
3. Completing the picture
The hypothesis that the 67 Hz QPOs is compatible with being the result of nodal precession near ISCO can be tested by considering the characteristic frequencies of additional components in the PDS, such as the high-frequency broad components often observed with type-C QPOs in BH binaries (Psaltis et al. 1999; Stella et al. 1999), or, when they are detected, the frequencies of actual HFQPOs.
We proceed by predicting the frequencies of the particles orbiting the BH at any radius larger than RISCO as was done, for example, by Motta et al. (2014a,b, 2022). In order to take into account the uncertainty associated with the mass and spin of the BH, we simulated the mass and spin normal bi-variate distribution of 106 elements with a central value and width equal to the values and uncertainties given in Table 1, and we predict the nodal, periastron precession, and orbital frequencies as a function of radius, as well as the value of RISCO, and the corresponding nodal frequency for mass-spin pairs drawn randomly form the distribution.
In Fig. 2 we plot the three set of frequencies as a function of the nodal frequency (grey lines), as well as the values of the nodal frequency at RISCO calculated in each step, following the procedure adopted in Motta et al. 2022 (vertical black lines). Every set of grey lines corresponds to a different mass-spin pair drawn from a bi-variate distribution (for clarity, we only plot values for the mass-spin pairs within 1-σ from the central mass-spin value). The 67Hz QPOs are marked by squares.
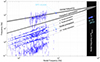 |
Fig. 2. Nodal precession frequencies (bottom grey line), periastron precession frequencies (middle lines), and orbital frequencies (top lines) plotted as a function of the nodal precession frequency, as predicted by the RPM using M = (12.4 ± 0.46) M⊙ and a* = 0.706 ± 0.034. The set of lines forming grey regions in the figure each corresponds to mass-spin pairs drawn from a bi-variate distribution (see main text). The lines corresponding to the nodal precession frequency overlap each other as the nodal precession frequency is the independent variable in this plot, hence the only difference between lines is in the maximum value they reach (i.e. the nodal precession frequency at ISCO). The dotted lines correspond to the sub-harmonic and to the second and third harmonic of the nodal precession frequency. The vertical black lines correspond to the predicted nodal frequency at RISCO for the same pairs. For clarity, we only plot the predicted frequencies for mass-spin pairs within 1-σ from the central mass-spin value. The QPO doublet formed by a HFQPO at 135 Hz and a type-C QPO at 8.7 Hz are indicated by clear blue diamonds. The 67 Hz QPOs are marked by clear blue squares. All the PDS broad components described in Sect. 3.2 are marked by small blue dots with vertical error bars. |
3.1. Bringing in the real HFQPOs
HFQPOs in BH X-ray binaries are classified solely based on their frequency, which in the majority of systems is about 100 Hz. Hence, we classified the QPOs at ∼134 and ∼143 Hz in GRS 1915+105 reported in Belloni & Altamirano (2013b) as HFQPOs. We refer to these oscillations as the real HFQPOs to distinguish them from the 67 Hz QPOs, which, as already noted, are found at frequencies significantly lower than the typical HFQPO in other BH systems.
The inspection of the two PDS showing peaks at ∼134 and ∼143 Hz in both cases reveals a clear LFQPO at ∼6.5 Hz. These oscillations can be classified as a type-B QPO based on their frequency and morphology (see, e.g., Casella et al. 2005; Motta et al. 2009). A close inspection of the PDS shows a weak peak at ∼8.54 Hz in one of the two cases, that is, observation 50703-01-10-02, which, according to Belloni & Altamirano (2013b), shows ρ-type variability). We classified the weak peak as a type-C QPO because it is not consistent with being the second harmonic to the modulation at 6.5 Hz, and because no type-B QPO has been observed above 7 Hz in GRS 1915+105 (see, e.g., Soleri et al. 2008). This PDS configuration, that is, a type-B next to a weak type-C QPO, is relatively rare in BH X-ray binaries (Motta et al. 2015), but is typical of neutron star Z-sources (see, e.g., Motta & Fender 2019), which like GRS 1915+105 are thought to accrete near the Eddington limit (see Motta et al. 2017, for the case of Sco X-1)2.
We fitted the PDS as described in several works in the literature, with a number of Lorentzian shapes (e.g. Belloni et al. 2002). The best fit yields a type-C QPO frequency νC = 8.71± 0.09 and a HFQPO at 135.25 ± 0.9. A plot of the fitted PDS is shown in Fig. A.2. Belloni & Altamirano (2013b) already showed that the HFQPO is formally significant after considering the number of trials. The type-C QPO is instead borderline significant, that is, approximately 3.1σ single trial based on the QPO amplitude and its uncertainty. Determining the formal significance of a QPO super-imposed on a complex continuum (i.e. not simple red noise) is nontrivial (see, e.g., Vaughan 2005), but for the sake of the argument, we assumed that the type-C QPO is correctly classified and statistically significant. We therefore treated the tentative type-C QPO plus the HFQPO at ∼143 Hz as a QPO doublet. When this QPO doublet is marked in the plot in Fig. 2, the HFQPO peak is consistent with being a upper HFQPO, and it can be associated with the orbital frequency according to the RPM. By extension and by virtue of their similar frequency, we also classified the other high-frequency peak at 143 Hz as an upper HFQPO.
Following the prescription in Ingram & Motta (2014) and by considering the BH mass for GRS 1915+105 from dynamical measurements, we inferred an additional independent value of the spin to be compared with the value obtained above for consistency. We derived a second spin value,  , which is consistent with the value we obtained above in Sect. 2.2.
3.2. Bringing in the broad PDS components
Finally, we considered the broad PDS components that have been associated with the HFQPOs in BH and NS X-ray binaries through the well-known correlation discovered by Psaltis et al. (1999), the so-called Psaltis-Belloni-Van der Klis (PBK) correlation. While these broad-band components frequently appear in the PDS of BH X-ray binaries in general and in GRS 1915+105 in particular, their presence is not ubiquitous in all observations. Thus, instead of inspecting all the 1816 RXTE archival observations of GRS 1915+105, we focussed on the sample considered by Zhang et al. (2022), which was constructed based on the broad-band signal at high frequencies (or a bump).
Each observation was reduced following the standard procedures described in several works by our group (one recent example is Motta et al. 2022), with one main difference: because GRS 1915+105 is known as a variable source and changes in QPO centroid frequencies can occur on timescales shorter than the average RXTE observation (a few thousand seconds spread across several satellite revolutions), we produced a PDS employing 64 s long data segments and generated an average PDS by accumulating a fixed number of segments (48) for a total of approximately 3000 s per average PDS, which is long enough to provide a good signal-to-noise-ratio in each spectrum, but not so long that the underlying power spectral density distribution varied significantly in the time interval we considered (thus violating the assumption of the Fourier analysis).
We generated a total of 480 average PDS using a custom software under IDL (GHATS3), which we normalised according to Leahy et al. (1983), and we fitted with a combination of Lorentzian components. For all the PDS, we calculated the characteristic frequency of all the Lorentzians components, defined as  , where ν and Δ are the frequency and width, respectively (see Belloni et al. 2002). For narrow features such as QPOs, the characteristic frequency is by construction very similar to the Lorentzian peak frequency.
While the PDS from GRS 1915+105 (and of BH binaries in general) can be complex, and it is often hard to classify components based on a given scheme (i.e. not all the components are present all the time in every PDS), the majority of the components can be classified as follows, and as is shown in Fig. 3. The PDS can include
-
A type-C QPO (LLF) and its harmonic content, that is, a sub-harmonic (L1/2), a second harmonic (LII), and sometimes a third or fourth harmonic;
-
A broad Lorentzian at low frequencies (Lb);
-
A second broad Lorentzian peaking at a frequency below the PDS break frequency (L?);
-
A third broad Lorentzian centred at a frequency close to the QPO centroid frequency (Lh);
-
One or two broad Lorentzians at high frequencies (Lu) and/or (Ll, not shown in the figure).
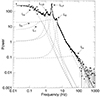 |
Fig. 3. Example of a PDS from GRS 1915+105 (RTXE observation 40703-01-01-00). The Lorentzian components fitted to the data are marked with dashed lines. The classifications of the peaks according to Belloni et al. (2002) are shown. |
In the attempt to interpret the PDS components from GRS 1915+105 in an unbiased way, we plotted all the characteristic frequencies we found in all the PDS we generated in Fig. 2, together with the frequencies predicted by the RPM given the dynamical mass from photometry and the spin we calculated in Sect. 2.2. All frequencies increase with the frequency of the type-C QPO (LLF). In particular, in the context of the RPM, the nodal precession frequency corresponds to LLF, and the sub-harmonic and second and third harmonic to this frequency correspond to L1/2, LII, and LIII. The periastron precession frequency and orbital frequency correspond to the broad components detected at high frequencies, Ll or Lu, or to HFQPOs (not shown in Fig. 3), as suggested by Psaltis et al. (1999).
In Fig. 3 several points do not clearly coincide with one of the frequencies of the RPM because the RPM aims to explain only three of the several components in the PDS. Several points are consistent with the frequencies predicted by the RPM for the mass and spins we derived from the 67 Hz QPOs under the assumption that they are the result of the nodal precession of particles at ISCO. The vast majority of the points that are inconsistent with the RPM frequencies can be associated with the Lb, Lh, or L? components (see Fig. 3).
3.3. Implications
The spin we obtained for the BH in GRS 1915+105 is the fourth spin obtained via X-ray timing. Previous estimates were obtained for the BH X-ray binaries GRO J1655-40, XTE J1550-564, and XTE J1859-226 presented in Motta et al. 2014a,b, 2022, and the spins were 0.29, 0.34, and 0.15, respectively. In these cases, the spin values we derived are relatively low compared to those typically obtained via other electromagnetic spin measurement methods (continuum fitting, reflection spectroscopy, and reverberation; see Reynolds 2021 for a recent review), which so far yielded spin distributions that peaked at values above 0.9 (especially true in the case of the reflection-based measurements; see e.g. Draghis et al. 2023). Instead, and given the many peculiarities of this system this is perhaps unsurprising, the spin for GRS 1915+105 is relatively high (0.76), but still inconsistent with the value from X-ray spectroscopy (Miller et al. 2013).
While the number of timing-based spin values from the RPM is still low, they appear to be consistent with the BH spin distribution obtained based on the entire gravitational waves sample GWTC-3 (The LIGO Scientific Collaboration 2023). This distribution peaks around spin ∼0.2 and shows a thin tail extending to higher values, thus indicating that the vast majority of the BHs in binary BH systems are relatively slow rotators. Unlike the case of other electromagnetic methods, the results of which indicate that the spin distributions from binary BHs and BH X-ray binaries may be different (Draghis et al. 2023), our results seem to suggest that the LIGO, Virgo, and KAGRA BHs and X-ray binary BHs may feature a similar spin distribution, and hence may be members of strictly related populations (see Belczynski et al. 2021; Fishbach & Kalogera 2022).
4. Conclusions
Building on the observation that the 67 Hz QPOs in GRS 1915+105 are confined to a narrow frequency range, we hypothesised that these QPOs might be a consequence of nodal precession at the ISCO around a spinning black hole.
Using the relativistic precession model and the black hole mass determined from dynamical measurements (M = 12.4+2.0−1.8 M⊙), we derived a moderately high black hole spin (a* = 0.706 ± 0.034). Our predictions of frequencies around a black hole with this spin and mass nicely matched the observational data, lending further support to the idea that certain PDS features in accreting BH X-ray binaries can be explained by matter motion near a compact object.
We conclude that the 67 Hz QPOs observed in GRS 1915+105, historically classified as HFQPOs, are more probably type-C QPOs originating from the vicinity of the ISCO of a moderately spinning black hole.
The dimensionless spin parameter is defined as a* = J/M2, where J is the BH angular momentum, and M is its mass.
We note that the type-B and type-C QPOs that we detected are found at centroid frequencies in a 4:3 ratio. The two peaks probably are in a 4:3 ratio by pure coincidence as any slightly different rebinning of the PDS results in slightly different centroid frequencies, which are not in a 4:3 ratio.
Acknowledgments
The authors acknowledge financial contribution from grant PRIN INAF 2019 n.15. This work benefited from discussions during Team Meetings of the International Space Science Institute (Bern), whose support we acknowledge. S.E.M. heartily thanks Tomaso Belloni, who sadly passed away before this paper could be completed. Among many other contributions to the field, his work was crucial for the understanding of GRS 1915+105. S.E.M. acknowledges the assistance of ChatGPT for proofreading and language enhancement in the preparation of this manuscript.
References
- Altamirano, D., & Belloni, T. 2012, ApJL, 747, L4 [NASA ADS] [CrossRef] [Google Scholar]
- Altamirano, D., Belloni, T., Linares, M., et al. 2011, ApJ, 742, L17 [NASA ADS] [CrossRef] [Google Scholar]
- Belczynski, K., Done, C., & Lasota, J. P. 2021, arXiv e-prints [arXiv:2111.09401] [Google Scholar]
- Belloni, T. M., & Altamirano, D. 2013a, MNRAS, 432, 19 [CrossRef] [Google Scholar]
- Belloni, T. M., & Altamirano, D. 2013b, MNRAS, 432, 10 [NASA ADS] [CrossRef] [Google Scholar]
- Belloni, T. M., & Stella, L. 2014, Space. Sci. Rev., 183, 43 [NASA ADS] [CrossRef] [Google Scholar]
- Belloni, T., Méndez, M., & Sánchez-Fernández, C. 2001, A&A, 372, 551 [NASA ADS] [CrossRef] [EDP Sciences] [Google Scholar]
- Belloni, T., Psaltis, D., & van der Klis, M. 2002, ApJ, 572, 392 [NASA ADS] [CrossRef] [Google Scholar]
- Belloni, T. M., Sanna, A., & Méndez, M. 2012, MNRAS, 426, 1701 [NASA ADS] [CrossRef] [Google Scholar]
- Belloni, T. M., Bhattacharya, D., Caccese, P., et al. 2019, MNRAS, 489, 1037 [NASA ADS] [CrossRef] [Google Scholar]
- Casella, P., Belloni, T., Homan, J., & Stella, L. 2004, A&A, 426, 587 [NASA ADS] [CrossRef] [EDP Sciences] [Google Scholar]
- Casella, P., Belloni, T., & Stella, L. 2005, ApJ, 629, 403 [Google Scholar]
- Draghis, P. A., Miller, J. M., Zoghbi, A., et al. 2023, ApJ, 946, 19 [NASA ADS] [CrossRef] [Google Scholar]
- Fender, R., & Belloni, T. 2004, ARA&A, 42, 317 [NASA ADS] [CrossRef] [Google Scholar]
- Fishbach, M., & Kalogera, V. 2022, ApJ, 929, L26 [NASA ADS] [CrossRef] [Google Scholar]
- Fragile, P. C., Straub, O., & Blaes, O. 2016, MNRAS, 461, 1356 [NASA ADS] [CrossRef] [Google Scholar]
- Franchini, A., Motta, S. E., & Lodato, G. 2017, MNRAS, 467, 145 [Google Scholar]
- Ingram, A., & Motta, S. 2014, MNRAS, 444, 2065 [NASA ADS] [CrossRef] [Google Scholar]
- Ingram, A. R., & Motta, S. E. 2019, New Astron. Rev., 85 [Google Scholar]
- Ingram, A., Done, C., & Fragile, P. C. 2009, MNRAS, 397, L101 [Google Scholar]
- Leahy, D. A., Elsner, R. F., & Weisskopf, M. C. 1983, ApJ, 272, 256 [Google Scholar]
- Markwardt, C., Swank, J., Chen, X., & Taam, R. 1997, Am. Astron. Soc. Meeting Abstr., 191, 111.03 [NASA ADS] [Google Scholar]
- Miller, J. M., Parker, M. L., Fuerst, F., et al. 2013, ApJ, 775, L45 [NASA ADS] [CrossRef] [Google Scholar]
- Morgan, E. H., Remillard, R. A., & Greiner, J. 1997, ApJ, 482, 993 [NASA ADS] [CrossRef] [Google Scholar]
- Motta, S. E., & Fender, R. P. 2019, MNRAS, 483, 3686 [Google Scholar]
- Motta, S., Belloni, T., & Homan, J. 2009, MNRAS, 400, 1603 [CrossRef] [Google Scholar]
- Motta, S. E., Belloni, T. M., Stella, L., Muñoz-Darias, T., & Fender, R. 2014a, MNRAS, 437, 2554 [NASA ADS] [CrossRef] [Google Scholar]
- Motta, S. E., Munoz-Darias, T., Sanna, A., et al. 2014b, MNRAS, 439, L65 [NASA ADS] [CrossRef] [Google Scholar]
- Motta, S. E., Casella, P., Henze, M., et al. 2015, MNRAS, 447, 2059 [NASA ADS] [CrossRef] [Google Scholar]
- Motta, S. E., Rouco Escorial, A., Kuulkers, E., Muñoz-Darias, T., & Sanna, A. 2017, MNRAS, 468, 2311 [NASA ADS] [CrossRef] [Google Scholar]
- Motta, S. E., Franchini, A., Lodato, G., & Mastroserio, G. 2018, MNRAS, 473, 431 [NASA ADS] [CrossRef] [Google Scholar]
- Motta, S. E., Kajava, J. J. E., Giustini, M., et al. 2021, MNRAS, 503, 152 [Google Scholar]
- Motta, S. E., Belloni, T., Stella, L., et al. 2022, MNRAS, 517, 1469 [NASA ADS] [CrossRef] [Google Scholar]
- Psaltis, D., Belloni, T., & van der Klis, M. 1999, ApJ, 520, 262 [NASA ADS] [CrossRef] [Google Scholar]
- Ratti, E. M., Jonker, P. G., Miller-Jones, J. C. A., et al. 2012, MNRAS, 423, 2656 [NASA ADS] [CrossRef] [Google Scholar]
- Reid, M. J., McClintock, J. E., Steiner, J. F., et al. 2014, ApJ, 796, 2 [Google Scholar]
- Remillard, R. A., Muno, M. P., McClintock, J. E., & Orosz, J. A. 2002, ApJ, 580, 1030 [NASA ADS] [CrossRef] [Google Scholar]
- Reynolds, C. S. 2021, ARA&A, 59, 117 [NASA ADS] [CrossRef] [Google Scholar]
- Soleri, P., Belloni, T., & Casella, P. 2008, MNRAS, 383, 1089 [Google Scholar]
- Stella, L., & Vietri, M. 1998, ApJ, 492, L59+ [NASA ADS] [CrossRef] [Google Scholar]
- Stella, L., & Vietri, M. 1999, Phys. Rev. Lett., 82, 17 [NASA ADS] [CrossRef] [Google Scholar]
- Stella, L., Vietri, M., & Morsink, S. M. 1999, ApJ, 524, L63 [CrossRef] [Google Scholar]
- Strohmayer, T. E. 2001, ApJ, 554, L169 [NASA ADS] [CrossRef] [Google Scholar]
- The LIGO Scientific Collaboration, the Virgo Collaboration, the KAGRA Collaboration 2023, Phys. Rev. X, 13, 041039 [Google Scholar]
- Vaughan, S. 2005, A&A, 431, 391 [NASA ADS] [CrossRef] [EDP Sciences] [Google Scholar]
- Wijnands, R., & van der Klis, M. 1999, ApJ, 514, 939 [NASA ADS] [CrossRef] [Google Scholar]
- Zhang, Y., Méndez, M., García, F., et al. 2022, MNRAS, 514, 2891 [NASA ADS] [CrossRef] [Google Scholar]
Appendix A: Additional figures
In this appendix, we show additional figures to complement the analysis presented in the main text. In Fig. A.1 we show a histogram including the centroid frequencies of the 67 Hz QPOs reported in Belloni & Altamirano (2013b), except for the two peaks detected above 100 Hz.
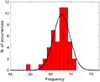 |
Fig. A.1. Histograms of the centroid frequencies of the QPOs found around 67 Hz in the data from GRS 1915+105, as reported in Belloni & Altamirano (2013b). The solid black line is the best Gaussian fit to the histogram, which yields a centroid frequency of 67.712 Hz and an FWHM of 2.056 Hz. |
Figure A.2 shows the PDS from observation 50703-01-10-02, including a type-B, a type-C, and a HFQPO. The broad peak at the high-frequency side of the LFQPOs is centred at ∼13.2 Hz and might be the hint of a second harmonic to the type-B QPO (but it is significantly broader than what would be expected in this case), or an Lh component (see Fig. 3).
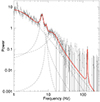 |
Fig. A.2. PDS from observation 50703-01-10-02, which includes a type-B QPO at 6.53±0.38 Hz, a type-C QPO at 8.71±0.09 Hz, and a high-frequency QPO at 135.250±0.70. |
Summary of the quantities measured and derived in this work. Uncertainties are given at a 1-sigma level. The parameters marked by a dagger were fixed to the reported values. We note that the HFQPO has been reported in Belloni & Altamirano (2013b) as a significant feature after taking into account the number of trials.
All Tables
Summary of the quantities measured and derived in this work. Uncertainties are given at a 1-sigma level. The parameters marked by a dagger were fixed to the reported values. We note that the HFQPO has been reported in Belloni & Altamirano (2013b) as a significant feature after taking into account the number of trials.
All Figures
|
Fig. 1. Mass vs. spin solutions of the RPM obtained assuming that the nodal precession occurs at ISCO. The solutions corresponding to the frequency 67.712 +/− 1-sigma uncertainties are shown. The horizontal solid lines and the dotted line are the upper and lower limit to the dynamical mass and its central value, respectively ( |
| In the text | |
|
Fig. 2. Nodal precession frequencies (bottom grey line), periastron precession frequencies (middle lines), and orbital frequencies (top lines) plotted as a function of the nodal precession frequency, as predicted by the RPM using M = (12.4 ± 0.46) M⊙ and a* = 0.706 ± 0.034. The set of lines forming grey regions in the figure each corresponds to mass-spin pairs drawn from a bi-variate distribution (see main text). The lines corresponding to the nodal precession frequency overlap each other as the nodal precession frequency is the independent variable in this plot, hence the only difference between lines is in the maximum value they reach (i.e. the nodal precession frequency at ISCO). The dotted lines correspond to the sub-harmonic and to the second and third harmonic of the nodal precession frequency. The vertical black lines correspond to the predicted nodal frequency at RISCO for the same pairs. For clarity, we only plot the predicted frequencies for mass-spin pairs within 1-σ from the central mass-spin value. The QPO doublet formed by a HFQPO at 135 Hz and a type-C QPO at 8.7 Hz are indicated by clear blue diamonds. The 67 Hz QPOs are marked by clear blue squares. All the PDS broad components described in Sect. 3.2 are marked by small blue dots with vertical error bars. |
| In the text | |
|
Fig. 3. Example of a PDS from GRS 1915+105 (RTXE observation 40703-01-01-00). The Lorentzian components fitted to the data are marked with dashed lines. The classifications of the peaks according to Belloni et al. (2002) are shown. |
| In the text | |
|
Fig. A.1. Histograms of the centroid frequencies of the QPOs found around 67 Hz in the data from GRS 1915+105, as reported in Belloni & Altamirano (2013b). The solid black line is the best Gaussian fit to the histogram, which yields a centroid frequency of 67.712 Hz and an FWHM of 2.056 Hz. |
| In the text | |
|
Fig. A.2. PDS from observation 50703-01-10-02, which includes a type-B QPO at 6.53±0.38 Hz, a type-C QPO at 8.71±0.09 Hz, and a high-frequency QPO at 135.250±0.70. |
| In the text | |
Current usage metrics show cumulative count of Article Views (full-text article views including HTML views, PDF and ePub downloads, according to the available data) and Abstracts Views on Vision4Press platform.
Data correspond to usage on the plateform after 2015. The current usage metrics is available 48-96 hours after online publication and is updated daily on week days.
Initial download of the metrics may take a while.