Fig. 2.
Download original image
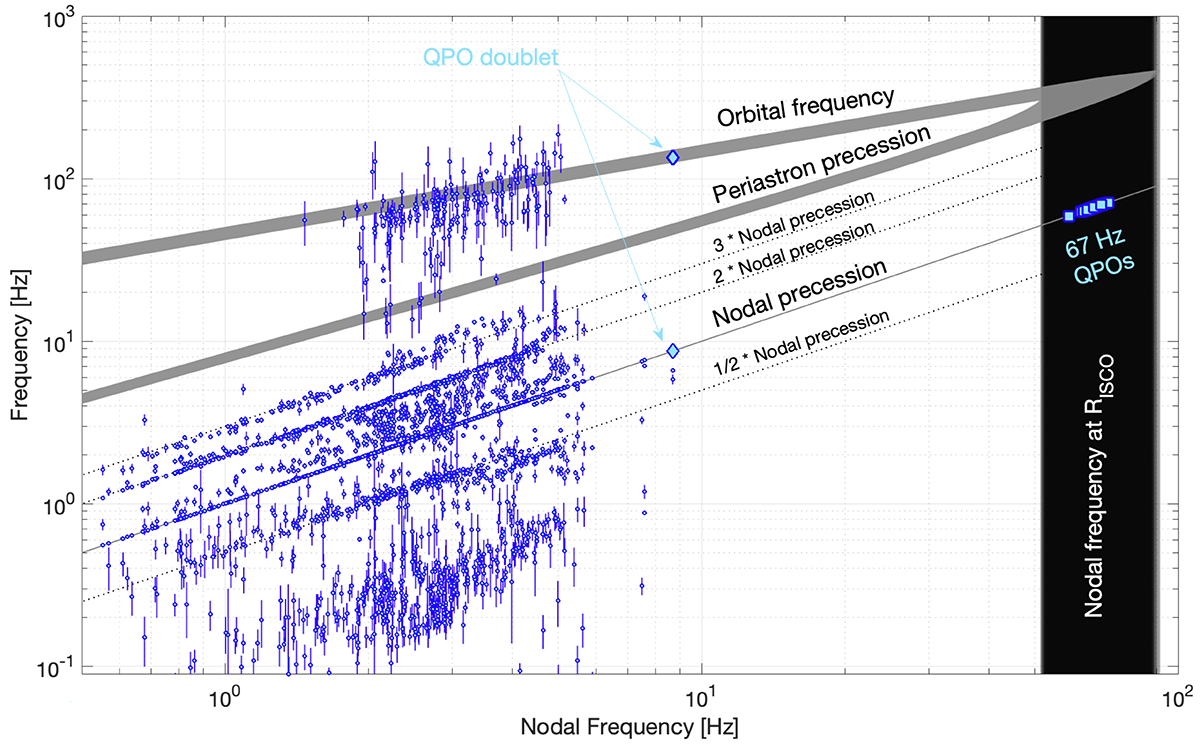
Nodal precession frequencies (bottom grey line), periastron precession frequencies (middle lines), and orbital frequencies (top lines) plotted as a function of the nodal precession frequency, as predicted by the RPM using M = (12.4 ± 0.46) M⊙ and a* = 0.706 ± 0.034. The set of lines forming grey regions in the figure each corresponds to mass-spin pairs drawn from a bi-variate distribution (see main text). The lines corresponding to the nodal precession frequency overlap each other as the nodal precession frequency is the independent variable in this plot, hence the only difference between lines is in the maximum value they reach (i.e. the nodal precession frequency at ISCO). The dotted lines correspond to the sub-harmonic and to the second and third harmonic of the nodal precession frequency. The vertical black lines correspond to the predicted nodal frequency at RISCO for the same pairs. For clarity, we only plot the predicted frequencies for mass-spin pairs within 1-σ from the central mass-spin value. The QPO doublet formed by a HFQPO at 135 Hz and a type-C QPO at 8.7 Hz are indicated by clear blue diamonds. The 67 Hz QPOs are marked by clear blue squares. All the PDS broad components described in Sect. 3.2 are marked by small blue dots with vertical error bars.
Current usage metrics show cumulative count of Article Views (full-text article views including HTML views, PDF and ePub downloads, according to the available data) and Abstracts Views on Vision4Press platform.
Data correspond to usage on the plateform after 2015. The current usage metrics is available 48-96 hours after online publication and is updated daily on week days.
Initial download of the metrics may take a while.