Open Access
Fig. A.1.
Download original image
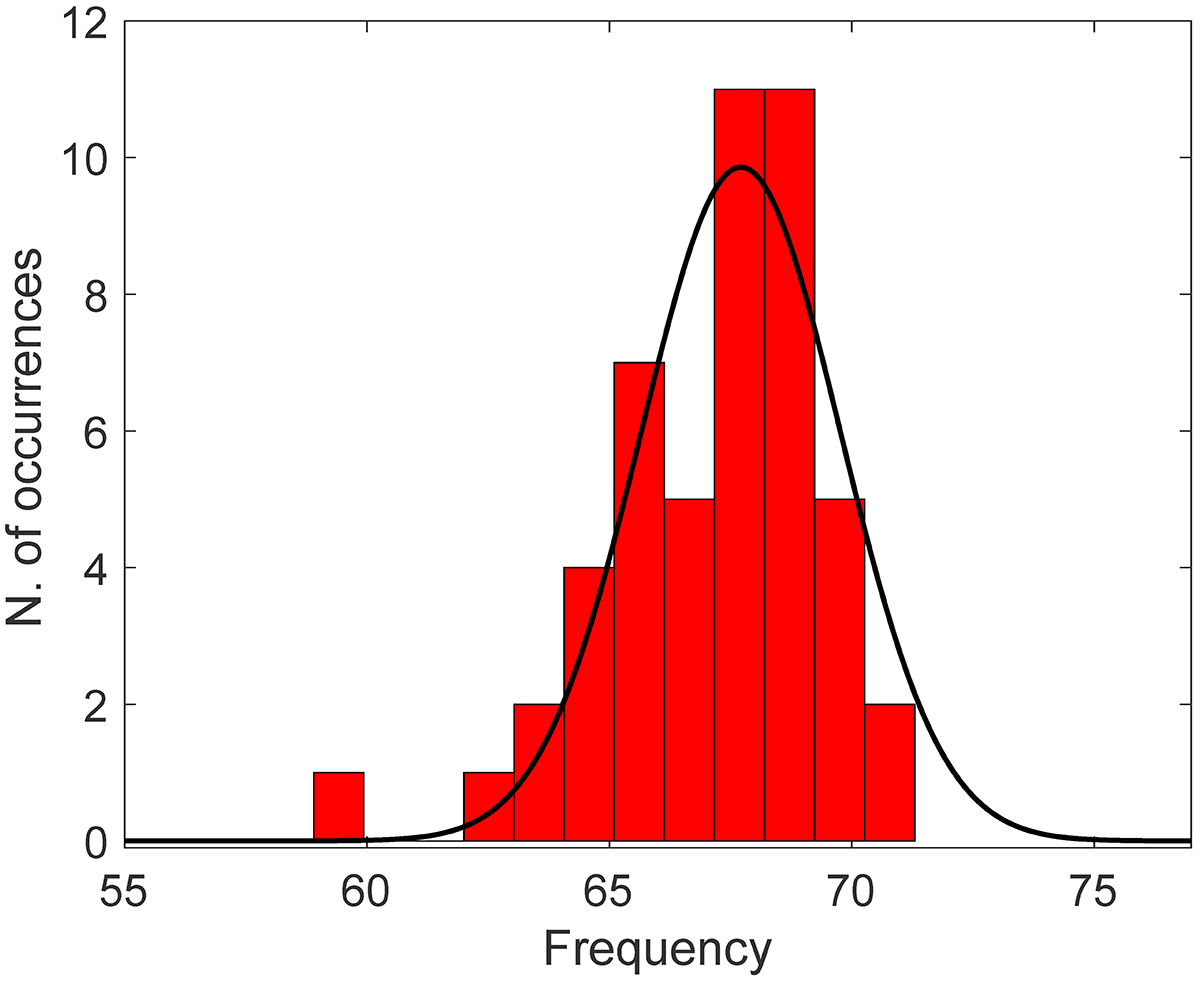
Histograms of the centroid frequencies of the QPOs found around 67 Hz in the data from GRS 1915+105, as reported in Belloni & Altamirano (2013b). The solid black line is the best Gaussian fit to the histogram, which yields a centroid frequency of 67.712 Hz and an FWHM of 2.056 Hz.
Current usage metrics show cumulative count of Article Views (full-text article views including HTML views, PDF and ePub downloads, according to the available data) and Abstracts Views on Vision4Press platform.
Data correspond to usage on the plateform after 2015. The current usage metrics is available 48-96 hours after online publication and is updated daily on week days.
Initial download of the metrics may take a while.