Open Access
Fig. 3.
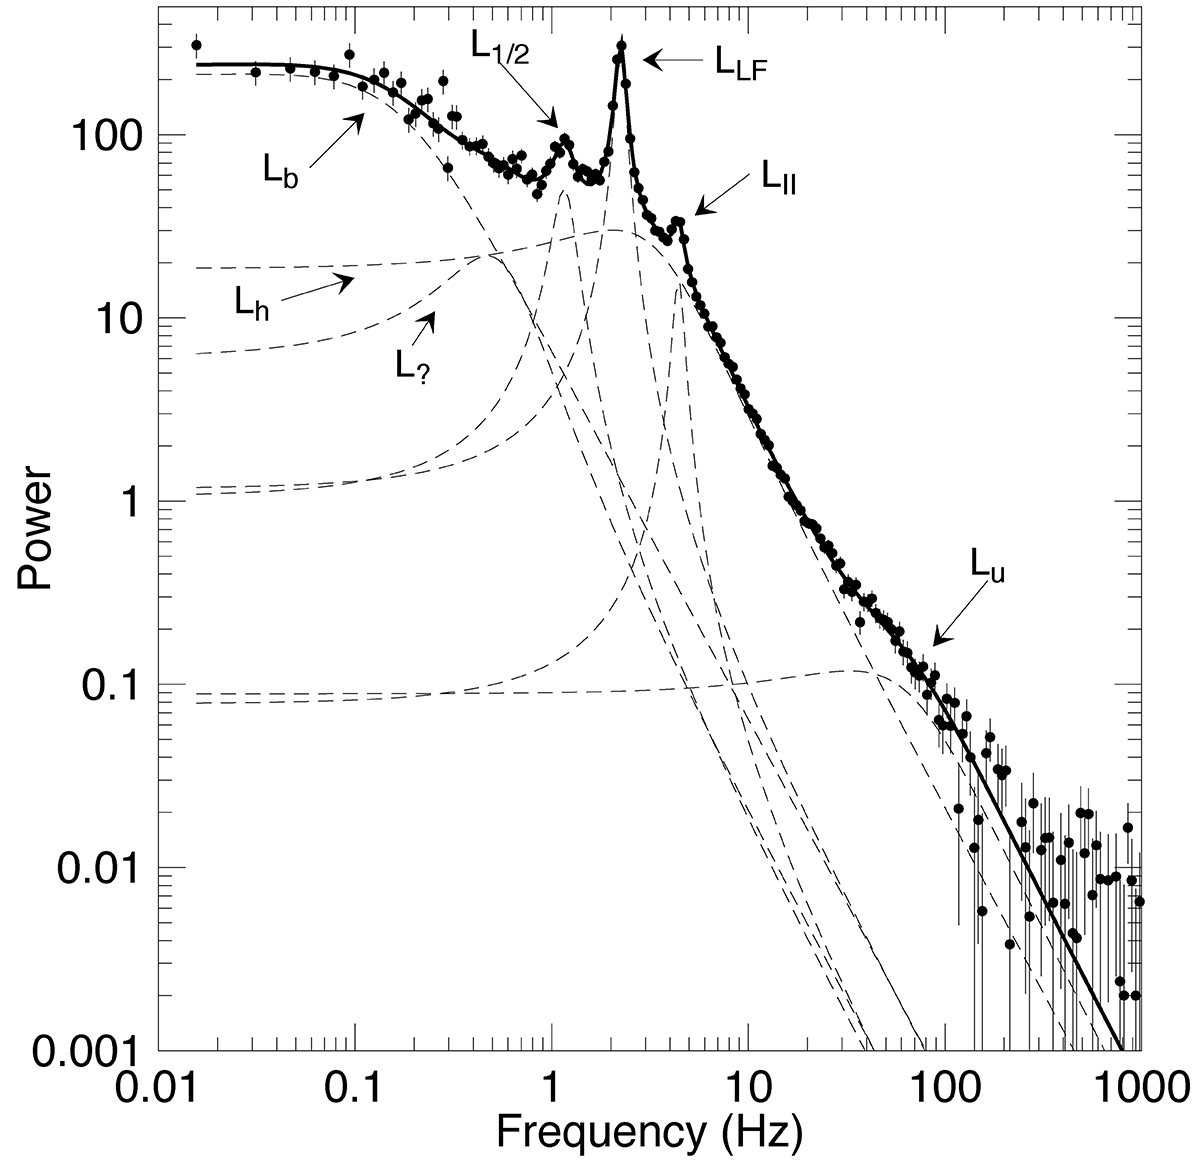
Download original image
Example of a PDS from GRS 1915+105 (RTXE observation 40703-01-01-00). The Lorentzian components fitted to the data are marked with dashed lines. The classifications of the peaks according to Belloni et al. (2002) are shown.
Current usage metrics show cumulative count of Article Views (full-text article views including HTML views, PDF and ePub downloads, according to the available data) and Abstracts Views on Vision4Press platform.
Data correspond to usage on the plateform after 2015. The current usage metrics is available 48-96 hours after online publication and is updated daily on week days.
Initial download of the metrics may take a while.