Open Access
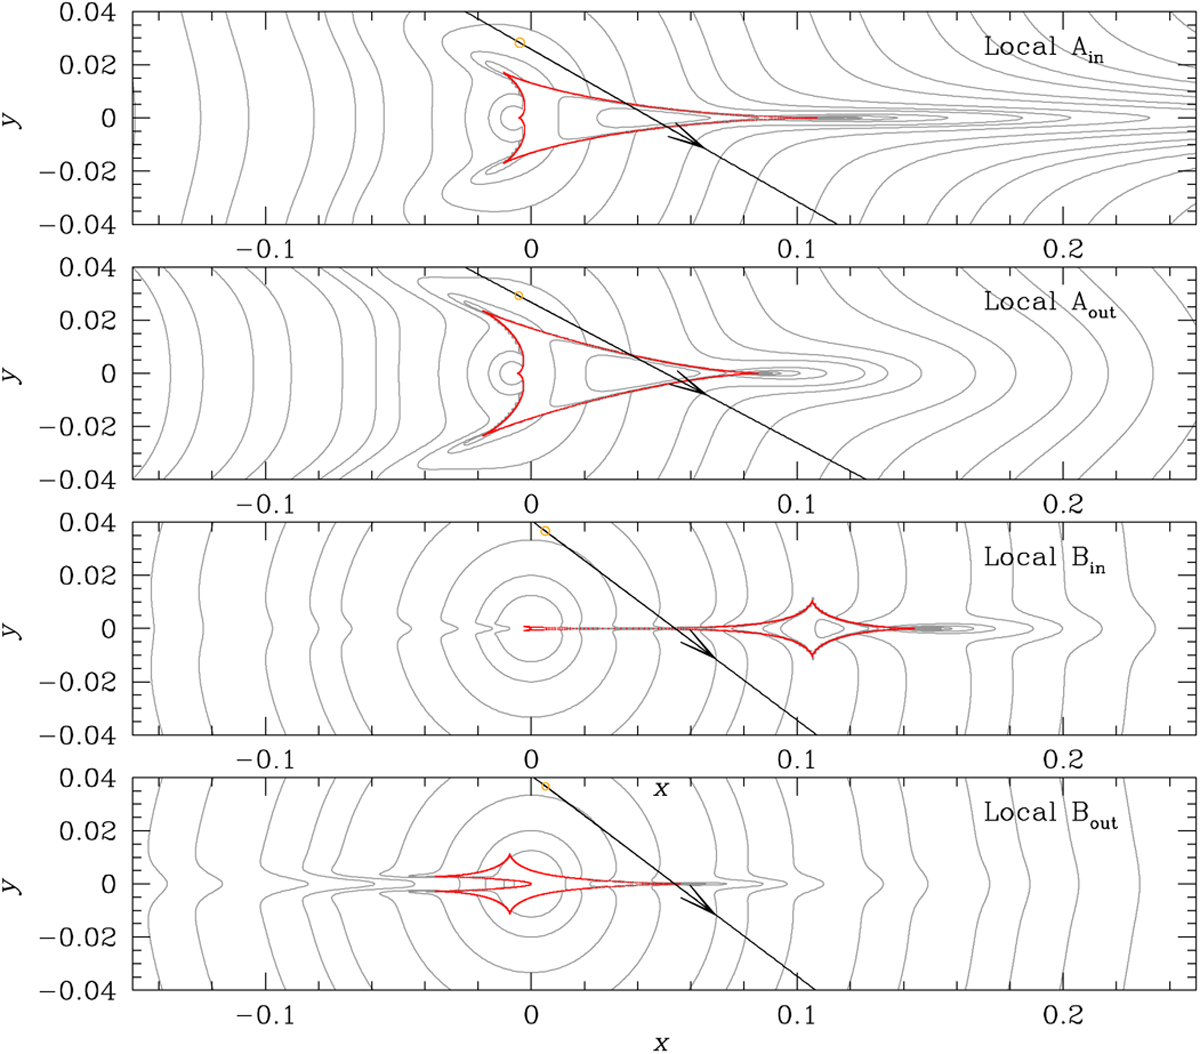
Fig. 5
Download original image
Lens-system configurations of the four local solutions of KMT-2023-BLG-0416. In each panel, the red cuspy figure represents the caustic, the arrowed line is the source trajectory, and the grey curves surrounding the caustic represent the equi-magnification contours.
Current usage metrics show cumulative count of Article Views (full-text article views including HTML views, PDF and ePub downloads, according to the available data) and Abstracts Views on Vision4Press platform.
Data correspond to usage on the plateform after 2015. The current usage metrics is available 48-96 hours after online publication and is updated daily on week days.
Initial download of the metrics may take a while.