| Issue |
A&A
Volume 694, February 2025
|
|
|---|---|---|
| Article Number | A90 | |
| Number of page(s) | 9 | |
| Section | Planets, planetary systems, and small bodies | |
| DOI | https://doi.org/10.1051/0004-6361/202452027 | |
| Published online | 04 February 2025 | |
MOA-2022-BLG-033Lb, KMT-2023-BLG-0119Lb, and KMT-2023-BLG-1896Lb: Three low mass-ratio microlensing planets detected through dip signals
1
Department of Physics, Chungbuk National University,
Cheongju
28644,
Republic of Korea
2
Institute of Natural and Mathematical Science, Massey University,
Auckland
0745,
New Zealand
3
Korea Astronomy and Space Science Institute,
Daejon
34055,
Republic of Korea
4
University of Canterbury, Department of Physics and Astronomy,
Private Bag 4800,
Christchurch
8020,
New Zealand
5
Department of Astronomy, Ohio State University,
140 West 18th Ave.,
Columbus,
OH
43210,
USA
6
Max-Planck-Institute for Astronomy,
Königstuhl 17,
69117
Heidelberg,
Germany
7
Department of Particle Physics and Astrophysics, Weizmann Institute of Science,
Rehovot
76100,
Israel
8
Center for Astrophysics | Harvard & Smithsonian
60 Garden St.,
Cambridge,
MA
02138,
USA
9
Department of Astronomy and Tsinghua Centre for Astrophysics, Tsinghua University,
Beijing
100084,
China
10
School of Space Research, Kyung Hee University,
Yongin, Kyeonggi
17104,
Republic of Korea
11
Institute for Space-Earth Environmental Research, Nagoya University,
Nagoya
464-8601,
Japan
12
Code 667, NASA Goddard Space Flight Center,
Greenbelt,
MD
20771,
USA
13
Department of Astronomy, University of Maryland,
College Park,
MD
20742,
USA
14
Department of Earth and Planetary Science, Graduate School of Science, The University of Tokyo,
7-3-1 Hongo,
Bunkyo-ku, Tokyo
113-0033,
Japan
15
Instituto de Astrofísica de Canarias,
Vía Láctea s/n,
38205
La Laguna, Tenerife,
Spain
16
Department of Earth and Space Science, Graduate School of Science, Osaka University,
Toyonaka, Osaka
560-0043,
Japan
17
Oak Ridge Associated Universities,
Oak Ridge,
TN
37830,
USA
18
Department of Astronomy, Graduate School of Science, The University of Tokyo,
7-3-1 Hongo,
Bunkyo-ku, Tokyo
113-0033,
Japan
19
Sorbonne Université, CNRS, UMR 7095, Institut d’Astrophysique de Paris,
98 bis bd Arago,
75014
Paris,
France
20
Department of Physics, University of Auckland,
Private Bag 92019
Auckland,
New Zealand
21
University of Canterbury Mt. John Observatory,
PO Box 56,
Lake Tekapo
8770,
New Zealand
★ Corresponding authors; This email address is being protected from spambots. You need JavaScript enabled to view it.
; This email address is being protected from spambots. You need JavaScript enabled to view it.
Received:
28
August
2024
Accepted:
3
January
2025
Abstract
Aims. We examined the anomalies in the light curves of the lensing events MOA-2022-BLG-033, KMT-2023-BLG-0119, and KMT- 2023-BLG-1896. These anomalies share similar traits: they occur near the peak of moderately to highly magnified events and display a distinct short-term dip feature.
Methods. We conducted detailed modeling of the light curves to uncover the nature of the anomalies. This modeling revealed that all signals originated from planetary companions to the primary lens. The planet-to-host mass ratios are very low: q ~ 7.5 × 10⁻⁵ for MOA-2022-BLG-033, q ~ 3.6 × 10⁻⁴ for KMT-2023-BLG-0119, and q ~ 6.9 × 10⁻⁵ for KMT-2023-BLG-1896. The anomalies occurred as the source passed through the negative deviation region behind the central caustic along the planet-host axis. The solutions are subject to a common inner-outer degeneracy, which results in varying estimations of the projected planet-host separation. For KMT-2023-BLG-1896, although the planetary scenario provides the best explanation for the anomaly, the binary companion scenario is possible.
Results. We estimated the physical parameters of the planetary systems through Bayesian analyses based on the lensing observables. While the event timescale was measured for all events, the angular Einstein radius was not measured for any. Additionally, the microlens parallax was measured for MOA-2022-BLG-033. The analysis identifies MOA-2022-BLG-033L as a planetary system with an ice giant with a mass of approximately 12 times that of Earth orbiting an early M dwarf star. The companion of KMT-2023-BLG-1896L is also an ice giant, with a mass of around 16 Earth masses, orbiting a mid-K-type main-sequence star. The companion of KMT-2023-BLG- 0119L, which has a mass around that of Saturn, orbits a mid-K-type dwarf star. The lens for MOA-2022-BLG-033 is highly likely to be located in the disk, whereas for the other events the probabilities of the lens being in the disk or the bulge are roughly equal.
Key words: planets and satellites: detection
© The Authors 2025
 Open Access article, published by EDP Sciences, under the terms of the Creative Commons Attribution License (https://creativecommons.org/licenses/by/4.0), which permits unrestricted use, distribution, and reproduction in any medium, provided the original work is properly cited.
This article is published in open access under the Subscribe to Open model. This email address is being protected from spambots. You need JavaScript enabled to view it. to support open access publication.
1 Introduction
Since 2015, the Korea Microlensing Telescope Network (KMTNet; Kim et al. 2016) group has been conducting high- cadence observations of stars in the Galactic bulge region in a bid to discover exoplanets using the microlensing method. This experiment has led to the discovery of over 3000 lensing events each year. The light curves of about 10% of these detected events deviate from the single-lens single-source (1L1S) model due to various causes. Of these anomalous events, around 10% of the distortions are attributed to planets, leading to an estimated annual planet detection rate of about 30 (Gould et al. 2022).
In gravitational lensing events, planetary signals manifest in diverse forms within the light curve. These signals arise as a planet produces a caustic on the source plane. The size and shape of the caustic created by the planet vary depending on the separation between the planet and its host star, as well as the mass ratio between them. Additionally, the planetary signal can take a wide range of forms depending on the source path relative to the caustic.
As the number of planets discovered by the KMTNet survey grows, those with similar signal characteristics are now being grouped and reported collectively. Han et al. (2024b) identified a distinctive pattern of planetary signals through their analysis of four lensing events: KMT-2020-BLG-0757, KMT-2022-BLG- 0732, KMT-2022-BLG-1787, and KMT-2022-BLG-1852. The anomalies in the light curves of these events exhibited a shared pattern: an extended trough followed by a bump. They determined that these anomalies were produced by planets located within the Einstein rings of their host stars. The bump in the light curve occurred when the source star crossed a planetary caustic, while the troughs resulted from the source moving through a region of minor image perturbations situated between a pair planetary caustics.
Planetary signals generated by the source approaching peripheral caustics created by planets outside the Einstein ring exhibit distinct characteristics. Due to the location of the caustic, these signals typically appear in the wings of the lensing light curve. Characteristic features of such planetary signals were demonstrated by Jung et al. (2021) for the events OGLE- 2018-BLG-0567 and OGLE-2018-BLG-0962, and by Han et al. (2024c) for KMT-2021-BLG-2609 and KMT-2022-BLG-0303.
Han et al. (2024a) identified another distinctive pattern in planetary signals through their analysis of events MOA-2022-BLG-563, KMT-2023-BLG-0469, and KMT-2023-BLG-0735. These anomalies share a characteristic feature: each occurs near the peak of a high-magnification event. The central part of the anomaly displays a dip that is flanked by subtle bumps on both sides. They find that interpreting these anomalies involves a common inner-outer degeneracy, leading to ambiguity in estimating the projected separation between the planet and its host.
Han et al. (2021a) illustrated planetary signals induced by giant planets near the Einstein ring in events KMT-2017-BLG-2509, OGLE-2017-BLG-1099, and OGLE-2019-BLG-0299. They note that, due to the large size of the caustic, the duration of these planetary signals constitutes a significant portion of the total event, making it challenging to readily identify their planetary nature.
Planetary signals can be produced when the source approaches the caustic without crossing it. Examples of such signals, which lack caustic-crossing features, were presented by Han et al. (2023b) for lensing events KMT-2022-BLG-0475 and KMT-2022-BLG-1480, and by Han et al. (2021b) for events KMT-2018-BLG-1976, KMT-2018-BLG-1996, and OGLE-2019-BLG-0954. Han et al. (2022) illustrated examples of well-covered planetary signals resulting from high-cadence observations and data integration across multiple surveys for events OGLE-2017-BLG-1691, KMT-2021-BLG-0320, KMT-2021-BLG-1303, and KMT-2021-BLG-1554. In contrast, examples of planets identified from partially covered signals were provided by Han et al. (2023a) for events KMT-2018-BLG-1976, KMT-2018-BLG-1996, and OGLE-2019-BLG-0954.
In this paper we present the discovery of three microlensing planets with similar signal characteristics identified through the analysis of the lensing events MOA-2022-BLG-033, KMT-2023-BLG-0119, and KMT-2023-BLG-1896. The planetary signals share a common trait: they appear near the peak of moderately to highly magnified events and exhibit a distinct short-term dip feature.
Coordinates, extinction, and baseline magnitude.
2 Observation and data
In Table 1 we list the equatorial and Galactic coordinates, I-band extinction (AI), and baseline magnitude (Ibase) for the lensing events MOA-2022-BLG-033, KMT-2023-BLG-0119, and KMT-2023-BLG-1896. The extinction is estimated as AI = 7AK, where the K-band extinction is adopted from Gonzalez et al. (2012). While the anomalies in their lensing light curves were initially detected by examining KMTNet data, we later found that both MOA-2022-BLG-033 and KMT-2023-BLG-0119 were also observed by the Microlensing Observations in Astrophysics (MOA; Bond et al. 2001; Sumi et al. 2003) group. In the table we include the ID references assigned by each group for these events. For events identified by both groups, we use the ID reference of the group that first discovered them.
The KMTNet survey is conducted using three identical telescopes, each with a 1.8-meter aperture and equipped with cameras that cover 4 square degrees of the sky. These telescopes are located at Siding Spring Observatory in Australia (KMTA), Cerro Tololo Interamerican Observatory in Chile (KMTC), and South African Astronomical Observatory in South Africa (KMTS). The MOA group uses a 1.8-meter telescope equipped with a camera that covers 2.2 square degrees, located at Mt. John University Observatory in New Zealand.
The KMTNet survey mainly observed in the I-band, whereas the MOA survey utilized a specially designed MOA-R band, spanning wavelengths from 609 to 1109 nm. Photometry for each microlensing event was carried out using software developed by each survey group. The KMTNet group utilized a photometry code developed by Albrow et al. (2009), while the MOA survey employed a code created by Bond et al. (2001). Both codes were developed based on the difference imaging method (Tomaney & Crotts 1996; Alard & Lupton 1998). For the KMTNet data, we conducted additional photometry using the code developed by Yang et al. (2024) to ensure optimal data quality. We adjusted the error bars to make them consistent with the data scatter and to set the value of χ2 per degree of freedom to unity for each dataset, following the procedure outlined in Yee et al. (2012).
3 Modeling procedure
A planetary signal in the light curve of a lensing event occurs when the source approaches the caustic generated by a planet companion to the lens (Mao & Paczyński 1991; Gould 1992). Caustics indicate the positions on the source plane where lensing causes the magnification of a point source to become infinite. The planet creates two sets of caustics. The first set forms around the host star (central caustic), while the second set forms at approximately the position of s − 1/s from the host star (planetary caustic). Here, s represents the position vector of the planet with respect to its host, with its length scaled to the angular Einstein radius (θE) of the lens (Chung et al. 2005; Han 2006).
The central caustic forms a closed, wedge-shaped curve made up of concave segments. Because the central caustic is located near the primary lens, planetary signals caused by it appear near the peak of a high magnification event (Griest & Safizadeh 1998). While the strongest planetary signal occurs when the source crosses the caustic, signals can also be generated without crossing it1. The source passing through the region in front of the protruding cusp of the central caustic shows positive deviations, whereas passing through the back region of the caustic results in negative deviations.
The light curves of the three analyzed lensing events show the following common characteristics. First, a very shortduration anomaly appears in the lensing light curve. Second, this anomaly occurs near the peak of the light curve with moderate to high magnification. Third, the anomaly exhibits a smooth light variation without abrupt changes. Fourth, the signal shows a negative deviation relative to the underlying 1L1S light curve of the event. These characteristics suggest that the anomaly is very likely of planetary origin and is produced by the source passing through the back region of the central caustic induced by the planet. A short-term anomaly can be caused by a faint companion to the source (Gaudi 1998). However, because a binary source induces only positive deviations, we rule out the binary source as the origin of the anomaly.
Given the likely planetary origin of the observed anomalies, we conducted a binary-lens single-source (2L1S) modeling of the light curves. To represent the light curve of a 2L1S event, seven basic parameters are required. The first three parameters (t0, u0, tE) describe the approach of the lens and source, where each parameter represents the time of closest approach, the projected separation at that time (scaled to θE), and the event timescale, respectively. The next two parameters (s, q) describe the binary lens, with each parameter representing the projected separation between the two lens components (M1 and M2) and their mass ratio. Here the separation s is scaled to θE. An additional parameter, ɑ, denotes the angle between the source’s motion vector and the binary lens axis. The final parameter, ρ, represents the ratio of the angular source radius to the angular Einstein radius (ρ = θ*|θE, normalized source radius) and is necessary to describe the deformation of the light curve due to the finite-source effect when the source crosses (or comes very close to) the caustic.
In addition to the basic parameters, additional parameters are needed for certain special cases of events. One such case is an event with a very long timescale. In this case, the relative lenssource motion experiences acceleration due to the parallactic motion induced by the Earth’s orbit around the Sun (Gould 1992, 2000, 2004). Consequently, additional parameters (πE,N, πE,E) should be included in the modeling. These parameters represent the north and east components of the microlens-parallax vector, defined as
 (1)
(1)
where  is the relative lens-source parallax, DL and DS denote the distances to the lens and source, respectively, and µ denotes the relative lens-source proper motion vector.
In the modeling, we searched for the lensing parameters that best describe the anomaly. To find the binary parameters (s, q), we used a grid approach because the lensing magnification varies discontinuously with changes in these parameters. For the other parameters, for which the magnification varies smoothly with parameter changes, we used a downhill approach with multiple starting values of ɑ. For the downhill approach, we employed the Markov chain Monte Carlo (MCMC) method. For each individual local solution identified in the χ2 map on the s–q parameter plane, we refined the solution by allowing all parameters to vary.
It is known that there is degeneracy in the interpretation of planetary signals in lensing light curves. The two most well-known types are the “inner-outer” degeneracy and the “close-wide” degeneracy. The former arises because the light curves resulting from a source passing through the inner and outer regions of the planetary caustic produce similar anomalies (Gaudi & Gould 1997). The latter occurs because the central caustics created by planets with s < 1 (close) and s > 1 (wide) generate similar anomalies (Griest & Safizadeh 1998). Building on the work of Herrera-Martin et al. (2020), Yee et al. (2021), Hwang et al. (2022), Zhang et al. (2022), and Gould et al. (2022), it is now established that the two types of degeneracy can be unified, with an analytic expression developed to describe the relationships between lensing parameters for solutions affected by both types of degeneracy. Hereafter, we use the unified term “inner-outer” to both types of degeneracy arising in the interpretation of planetary signals. The relationship between the planet separations of the inner (sin) and outer (sout) solutions under this degeneracy is expressed as
 (2)
(2)
where  denotes the time of the planet-induced anomaly. The signs “+” and “−” in the second term apply to anomalies with bump and dip features, respectively. Because all the anomalies in the analyzed events exhibit dip features, the sign is “−”. In our analysis of the events, we examined whether the observed anomalies are subject to this degeneracy.
4 Analysis
In this section we present the analyses conducted for each individual event and their corresponding results. For each event, we begin with a brief description of its discovery and the anomaly observed in the light curve. We then present the lensing solutions derived from the modeling, along with a discussion of any degeneracies that arise in the interpretation.
4.1 MOA-2022-BLG-033
The lensing event MOA-2022-BLG-033 was initially detected by the MOA group on February 20, 2022, which corresponds to the abridged Heliocentric Julian date HJD′ ≡ HJD − 2 450 000 = 9630. About a month later, the KMTNet group confirmed the event on March 23 (HJD′ = 9661). The event had a long duration, with the lensing magnification starting before the 2022 season began and continuing until the season ended. In our analysis, we included the MOA data from the 2021 and 2023 seasons to ensure accurate measurement of the baseline magnitude. The source of the event lies in the KMTNet BLG31 field, toward which observations were conducted with a 2.5-hour cadence.
Figure 1 shows the light curve of the event. It appears to be a typical 1L1S event with a moderately high magnification of Amax ~ 7.9 and a very long timescale of tE ~ 110 days. A close examination of the peak region revealed a very short-term anomaly. The zoomed-in view of the region around the anomaly is presented in the upper panel. The anomaly, covered by the MOA, KMTC, KMTS datasets, exhibited a negative deviation from the 1L1S model with a duration of about Δtanom ~ 2 days. The pattern and duration of the anomaly suggest it was caused by a planetary companion to the lens.
Detailed modeling confirmed the planetary nature of the anomaly. In Table 2 we list the lensing parameters of the solutions. We present the modeling solutions that account for microlens-parallax effects, with which the fit improves by Δχ2 ~ 290 compared to the model assuming rectilinear lenssource motion. We identified four sets of solutions due to two types of degeneracies. First, the event displayed an inner-outer degeneracy between solutions with planetary separations of approximately sin ~ 0.90 and sout ~ 0.97. The second type of degeneracy involved parallax solutions with u0 > 0 and u0 < 0, resulting from the mirror symmetry of the source trajectory relative to the planet-host axis (Smith et al. 2003; Skowron et al. 2011). Figure 2 shows the scatter plots of points in the MCMC chain on the (πE,E , πE,N) plane for the four sets of solutions. The degeneracy among the solutions are very severe with Δχ2 < 4. The model curve and residuals for the inner solution with u0 > 0 are shown in the figure. We note that the model curves of the other solutions are very similar to the one presented, and thus they are not displayed. To illustrate the parallax effect, we also present the model curve and residuals for the solution obtained under the assumption of rectilinear lens-source motion. As anticipated from the very small duration ratio of the anomaly to the event, the planet-to-host mass ratio, q ~ 0.71 × 10⁻⁴, is very low. The mass ratios estimated for the individual solutions are consistent across all cases. Although the exact value of the normalized source radius could not be determined because of the anomaly not crossing the caustic, an upper limit of ρmax ~ 6 × 10⁻³ can be established.
Figure 3 illustrates the lens-system configurations for the four degenerate solutions of MOA-2022-BLG-033. For the inner solution, the lens produces two distinct sets of central and planetary caustics, with the source passing through the region between them. In contrast, the outer solution features a single set of resonant caustics in which the central and planetary caustics merge, and the source traversed the outer region of the caustic. In both cases, the anomaly occurred as the source traversed the negative deviation region along the planet-host axis. From the lensing parameters (t0, u0, tE, tanom) ~ (9658.4,0.123,113,9662.2), we find s† = 0.938. This matches the geometric mean (sin × sout)1/2 = 0.940 very well, indicating that the pair of inner-outer solutions closely follow the formalism in Eq. (2). The parameters for the solutions with u0 > 0 and u0 < 0 are approximately related as  .
.
Lensing parameters of MOA-2022-BLG-033.
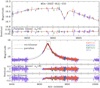 |
Fig. 1 Light curve of the lensing event MOA-2022-BLG-033 and the model curve. The lower three panels offers a comprehensive view of the event and residuals from two models, while the upper two panels provides a close-up view of the anomaly (the region enclosed by a box in the lower panels). The colors of the data points correspond to the telescopes listed in the legend. |
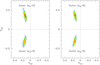 |
Fig. 2 Scatter plots of points in the MCMC chain on the (πE,E , πE,N) parameter plane. Points with ≤1σ are shown in red, ≤2σ in yellow, ≤3σ in green, ≤4σ in cyan, and ≤5σ in blue. |
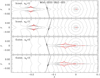 |
Fig. 3 Lens-system configurations for the four degenerate solutions of MOA-2022-BLG-033. In each panel, the red figure represents the caustic, and the arrowed curve indicates the source trajectory. The gray curves surrounding the caustic represent equi-magnification contours. The coordinates are centered on the position of the primary lens, and the lengths are scaled to the Einstein radius. |
 |
Fig. 4 Light curve of KMT-2023-BLG-0119. The second and third panels display the residuals for the inner and outer solutions, respectively. |
4.2 KMT-2023-BLG-0119
The KMTNet group initially detected the lensing event KMT-2023-BLG-0119 on March 20, 2023 (HJD′ = 10 023). The MOA group confirmed the event on April 4 (HJD′ = 10038) and designates it as MOA 2023-BLG-104. Similar to the previous event, the magnification of the source flux started before the 2023 season. The source of the event is located in the KMTNet BLG37 field, with observations made at a 2.5-hour cadence.
Figure 4 shows the light curve of the event, constructed from the combined KMTNet and MOA data. At first glance, it appears to be a typical 1L1S event with a moderately high magnification of Amax ~ 23.4. However, a careful examination of the peak region revealed a short-term anomaly lasting about Δtanom ~ 1.5 days. The upper panel provides an enlarged view of the region around the anomaly. Despite its short duration, the anomaly was captured by the combined data from all three KMTNet sets. This anomaly displays a negative deviation from the underlying 1L1S curve. The characteristics of this anomaly are very similar to those of MOA-2022-BLG-033, suggesting a planetary origin.
We confirmed the planetary origin of the anomaly from the detailed modeling of the light curve. We identified a pair of solutions resulting from the inner–outer degeneracy. In Table 3 we list the lensing parameters of the two solutions together with the χ2 values of the fits. The degeneracy between the solutions was found to be very severe, with the outer solution being favored by only Δχ2 = 0.38. The planetary parameters are (s, q)in ~ (0.86,3.5 × 10−4) for the inner solution and (s, q)out ~ (1.10,3.7 × 10−4) for the outer solution. The model curves of both solutions are presented in Fig. 4. The value s† = 0.976, derived from the estimated lensing parameters (t0 , u0 , tE , tanom) ~ (10 043.2,4.4 × 10−2, 58,10 044.2), is very close to the geometric mean of (sin × sout)1/2 = 0.974. This indicates that the degeneracy between the solutions arises from the inner–outer degeneracy. The weak finite-source effects set a loose upper limit on the normalized source radius at ρmax ~ 10−2. Determining the microlens parallax parameters proved challenging due to the relatively large photometric uncertainties in the data.
The lens system configurations corresponding to the inner and outer solutions are presented in Fig. 5. For the inner solution, the source passed through the region between the central and planetary caustics, while for the outer solution, it traversed the outer region of the caustic.
Lensing parameters of KMT-2023-BLG-0119.
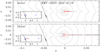 |
Fig. 5 Configurations of the lens system for the inner and outer solutions of KMT-2023-BLG-0119. The inset in each panel offers a zoomed-out view. In the insets, blue empty circles mark the positions of the lens components: a small circle for the planet and a large circle for the host. |
4.3 KMT-2023-BLG-1896
The event KMT-2023-BLG-1896 was detected on August 4, 2023 (HJD′ = 10 160) and was exclusively observed by the KMTNet group. The source is located in the KMTNet BLG03 field, which was monitored with a 0.5-hour cadence. Most of this field overlaps with the BLG43 field, but the source’s position falls within a narrow strip that does not overlap, resulting in no data from the BLG43 field. The maximum magnification at the peak was extremely high, reaching approximately Amax ~ 690.
Figure 6 presents the light curve for KMT-2023-BLG-1896. As with the earlier events, it features a brief central anomaly, lasting approximately Δtanom ~ 4.5 hours, and showing a negative deviation from the baseline 1L1S model. These features of the anomaly suggest a planetary origin. Despite its brief duration, the anomaly was well captured by the KMTA dataset due to the relatively high cadence of the observations in the field.
Interpreting the anomaly in KMT-2023-BLG-1896 was subject to two types of degeneracy. The first type is the inner–outer degeneracy, which has been observed in previous events. The second type is the planet–binary degeneracy, which was not seen in earlier events, although it is less severe. In Table 4 we list four sets of solutions, in which the first pair corresponds to the inner and outer planetary solutions, while the other pair corresponds to the close and wide binary solutions. In the planetary interpretation, the binary parameters are (s, q)in ~ (0.79,8.3 × 10−5) for the inner solution and (s, q)out ~ (1.27,6.9 × 10−5) for the outer solution. This suggests that the lens is a planetary system with the planet positioned near the Einstein ring of the host star. In the binary interpretation, the parameters are (s, q)close ~ (0.10,0.1) for the inner solution and (s, q)wide ~ (10.4,0.08) for the wide solution, indicating that the lens system consists of two stars with a projected separation significantly smaller or larger than the Einstein radius. The degeneracy between the solutions of each pair of solution is severe. The model curves of the outer- planetary and wide-binary solutions are presented in Fig. 6. It is found that the planetary solution provides a better fit than the binary solution, with Δχ2 ~ 10, as illustrated by the residuals in the second and third panels. Therefore, we proceeded with further analysis based on the planetary solution, though we cannot definitively rule out the binary interpretation. The upper limit for the normalized source radius is set at ρmax ~ 10−3. The microlens-parallax parameters could not be constrained because of the large uncertainty in the data resulting from the faintness of the source.
The configurations for the lens system in KMT-2023-BLG-1896 are shown in Fig. 7. Although the anomaly has been determined to have a planetary origin, we also present the configuration for the binary solution to understand the cause of the similarity in the shape of the anomaly. The configurations for the planetary solutions are very similar to those of the previous events: for the inner solution, the source passed through the inner region between the central and planetary caustics, while for the outer solution, the source traversed the outer region of the caustics. The anomaly occurred when the source passed through the negative deviation region located at the rear side of the central caustic along the planet-host axis. In the binary model, the lens forms a Chang-Refsdal caustic (Chang & Refsdal 1979, 1984) with four folds converging at four cusps. The source passed through the region of reduced magnification between two cusps of the caustic, resulting in the negative deviation.
Lensing parameters of KMT-2023-BLG-1896.
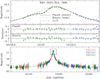 |
Fig. 6 Light curve of KMT-2023-BLG-1896. |
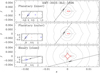 |
Fig. 7 Lens system configurations of KMT-2023-BLG-1896 for the inner and outer planetary solutions (upper two panels) and the wide binary solution (bottom panel). |
Source parameters.
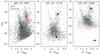 |
Fig. 8 Locations of source stars (filled blue dots) in the instrumental CMDs. The red dot in each panel indicates the centroid of the RGC. |
5 Source stars
In microlensing analysis, the main objective in characterizing the source is to determine the angular Einstein radius. This is essential because the angular Einstein radius is linked to the physical lens parameters through the relation
 (3)
(3)
thereby offering an important constraint on the physical lens parameters. The angular Einstein radius is determined from the normalized source radius through the relation
 (4)
(4)
where the angular radius of the source, θ*, can be inferred from the color and magnitude. In all analyzed events, finite-source effects were not detectable in the light curves, preventing the determination of ρ and consequently the calculation of θE . Nevertheless, we defined the source stars to ensure a comprehensive characterization of the events.
We characterized the source by measuring its color (V − I) and magnitude (I). First, we determined the instrumental magnitudes in the I and V bands by regressing the photometric data processed using the pyDIA code (Albrow 2017) against the model. Next, we placed the source in the instrumental colormagnitude diagram (CMD) for stars near the source. The color and magnitude were then calibrated using the centroid of the red giant clump (RGC), with their extinction and reddening- corrected values obtained from Bensby et al. (2013) for color and Nataf et al. (2013) for I-band magnitude.
Figure 8 shows the positions of the sources in the instrumental CMDs of the events, constructed from pyDIA photometry of stars in the KMTC image. For KMT-2023-BLG-1896, for which the observed light curve was heavily influenced by flux from nearby blended stars, we also mark the position of the blend. Table 5 lists the instrumental color and magnitude of the source, (V − I, I), and those of the RGC centroid, (V − I, I)RGC . It also provides the de-reddened values for the RGC centroid, (V − I, I)RGC,0 , and the sources (V − I, I)0 . From these estimated colors and magnitudes, it is determined that the source is a late F-type star for MOA-2022-BLG-033, an early K-type star for KMT-2023-BLG-0119, and a mid K-type star for KMT-2023-BLG-1896. Although not utilized for θE measurement, we also present the angular radii of the source stars. To estimate θ* , we first converted the V − I color to V − K using the Bessell & Brett (1988) relation. Subsequently, we derived θ* based on the Kervella et al. (2004) relation between (V − K, I) and θ*.
6 Mass and distance to the planetary systems
The physical parameters of a lens are determined through constraints provided by lensing observables. Observables that can be measured from a lensing light curve include the event timescale (tE), the angular Einstein radius (θE), and the microlens parallax (πE). The values of θE and πE are related to the physical lens parameters by Eqs. (3) and (1), respectively, and the event timescale is related by tE = θE/µ. The basic observable of the event timescale was measured for all events, but the angular Einstein radius was not measured for any of them. For MOA-2022-BLG-033, the microlens parallax was additionally measured.
We estimated the mass and distance to the planetary systems using a Bayesian analysis, incorporating the constraints provided by the measured observables of each event, along with the priors for the physical and dynamical distributions and the mass function of Galactic objects. In this analysis, we first generated a large number of artificial lensing events through a Monte Carlo simulation. For each artificial event, the physical parameters (M, DL, DS , )i were derived from the priors of a mass function and and a Galaxy model. We used the Jung et al. (2021) model for the mass function and the Jung et al. (2021) Galaxy model for the physical and dynamical distributions. Next, the observables (tE , θE, πE)i corresponding to the physical parameters were computed. The posteriors of the physical lens parameters were then constructed by assigning a weight (wi) to each event of
 (5)
(5)
Here  , and
, and ![Mathematical equation: $\chi _{{\pi _{{\rm{E}},i}}}^2 = \sum\nolimits_j {\sum\nolimits_k {{b_{j,k}}} } \left( {{\pi _{{\rm{E}},j,i}} - {\pi _{{\rm{E}},j}}} \right)\left( {{\pi _{{\rm{E}},k,i}} - {\pi _{{\rm{E}},k}}} \right),\quad \left[ {{t_{\rm{E}}},\sigma \left( {{t_{\rm{E}}}} \right)} \right]$](/articles/aa/full_html/2025/02/aa52027-24/aa52027-24-eq10.png) and [θE, σ(θE)] represent the measured values of tE and θE and their associated uncertainties. The term bj,k denotes the inverse covariance matrix of πE, (πE,1, πE,2)i = (πE,N, πE,E)i, and (πE,N , πE,E) indicates the measured microlens-parallax parameters. Even though the angular Einstein radius values are not precisely measured for any event, we included a constraint on its minimum value, θE,min, in our analysis.
and [θE, σ(θE)] represent the measured values of tE and θE and their associated uncertainties. The term bj,k denotes the inverse covariance matrix of πE, (πE,1, πE,2)i = (πE,N, πE,E)i, and (πE,N , πE,E) indicates the measured microlens-parallax parameters. Even though the angular Einstein radius values are not precisely measured for any event, we included a constraint on its minimum value, θE,min, in our analysis.
Figures 9 and 10 display the constructed posteriors for the mass and distance of the planetary systems. The distance posterior range for MOA-2022-BLG-033 is significantly narrower than those for KMT-2023-BLG-0119 and KMT-2023-BLG-1896, due to the additional constraint provided by the measured microlens parallax. Blue and red curves illustrate the contributions of disk and bulge lenses, respectively. The lens of MOA-2022-BLG-033 is highly likely to be located in the disk, whereas the contributions from the two lens populations are roughly equal for the other events. The measured parallax of MOA-2022-BLG-033 strongly constrains the lens distance, but its constraint on the lens mass is relatively weak, though it still contributes to refining the mass estimate. Additionally, we find that the lower limit on θE provides an insignificant constraint for any of the events.
Table 6 lists the estimated masses of the host (Mh) and planet (Mp), distance, and projected planet-host separation (a⊥) for the planetary systems. The lensing parameters for the pair of solutions resulting from the inner–outer degeneracy are similar to each other. Hence, we present the physical parameters estimated from the best-fit solution, except for the planet-host separation, which differs between the inner and outer solutions. MOA-2022-BLG-033L is identified as a planetary system with an ice giant, approximately 12 times the mass of Earth, orbiting an early M dwarf star. The companion of KMT-2023-BLG-1896L is also an ice giant, with a mass around 16 Earth masses, and orbits a mid-K-type main-sequence star. The companion of KMT-2023-BLG-0119L, which has a mass about six times that of Uranus, orbits a mid-K-type dwarf star. The table also includes the probabilities of the planetary system being located in the disk (pdisk) or the bulge (pbulge). The lens for MOA-2022-BLG-033 most likely situated in the disk. In contrast, for the other events, the chances of the lens being in the disk or the bulge are roughly equal.
Physical lens parameters.
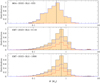 |
Fig. 9 Posteriors of the mass of the planetary system. In each panel, the blue and red curves represent the distributions contributed by the disk and bulge lens populations, respectively, while the black curve represents the combined distribution from the two lens populations. The solid vertical line denotes the mean of the distribution, and the dotted lines indicate the 1σ uncertainty range. |
7 Summary and conclusion
We analyzed the anomalies in the light curves of the lensing events MOA-2022-BLG-033, KMT-2023-BLG-0119, and KMT-2023-BLG-1896. These anomalies share common traits, appearing near the peak of events with moderate to high magnification and displaying a distinctive short-term dip.
We conducted detailed modeling of the light curves to uncover the origin of the anomalies. This analysis revealed that all signals stem from planetary companions to the primary lens. The planet-to-host mass ratios are very low: approximately q ~ 7.5 × 10⁻⁵ for MOA-2022-BLG-033, q ~ 3.6 × 10⁻⁴ for KMT-2023-BLG-0119, and q ~ 6.9 × 10⁻⁵ for KMT-2023-BLG-1896. The anomalies occurred as the source passed through the negative deviation region behind the central caustic along the planet-host axis. The solutions are subject to a common inner- outer degeneracy, resulting in slight variations in the estimated projected separation between the planet and its host.
We estimated the physical parameters of the planetary systems using Bayesian analyses based on the lensing observables. Although we measured the event timescale for all events, the angular Einstein radius was not determined for any. Additionally, the microlens parallax was only measured for MOA-2022-BLG-033. Our analysis reveals that MOA-2022-BLG-033L hosts an ice giant with a mass approximately 12 times that of Earth that orbits an early M dwarf star. KMT-2023-BLG-1896L also features an ice giant, with a mass around 16 times that of Earth, orbiting a mid-K-type main-sequence star. The companion of KMT-2023-BLG-0119L, which is about the mass of Saturn, orbits a mid-K-type dwarf star. The lens for MOA-2022-BLG- 033 is most likely located in the disk, whereas for the other events the likelihood of the lens being in the disk or the bulge is roughly equal.
Acknowledgements
This research has made use of the KMTNet system operated by the Korea Astronomy and Space Science Institute (KASI) at three host sites of CTIO in Chile, SAAO in South Africa, and SSO in Australia. Data transfer from the host site to KASI was supported by the Korea Research Environment Open NETwork (KREONET). This research was supported by KASI under the R&D program (project No. 2024-1-832-01) supervised by the Ministry of Science and ICT. The MOA project is supported by JSPS KAKENHI Grant Number JP24253004, JP26247023, JP23340064, JP15H00781, JP16H06287, JP17H02871 and JP22H00153. J.C.Y. and I.-G.S. acknowledge support from U.S. NSF Grant No. AST-2108414. J.C.Y. acknowledges support from a Scholarly Studies grant from the Smithsonian Institution. Y.S. acknowledges support from BSF Grant No. 2020740. C.R. was supported by the Research fellowship of the Alexander von Humboldt Foundation. W.Z. and H.Y. acknowledge support by the National Natural Science Foundation of China (Grant No. 12133005). W.Z. acknowledges the support from the Harvard-Smithsonian Center for Astrophysics through the CfA Fellowship. J.C.Y. and I.-G.S. acknowledge support from U.S. NSF Grant No. AST-2108414.
References
- Alard, C., & Lupton, R. H. 1998, ApJ, 503, 325 [Google Scholar]
- Albrow, M. 2017, MichaelDAlbrow/pyDIA: Initial Release on Github, Version v1.0.0, Zenodo, https://doi.org/10.5281/zenodo.268049 [Google Scholar]
- Albrow, M., Horne, K., Bramich, D. M., et al. 2009, MNRAS, 397, 2099 [Google Scholar]
- Bensby, T. Yee, J.C., Feltzing, S., et al. 2013, A&A, 549, A147 [NASA ADS] [CrossRef] [EDP Sciences] [Google Scholar]
- Bessell, M. S., & Brett, J. M. 1988, PASP, 100, 1134 [Google Scholar]
- Bond, I. A., Abe, F., Dodd, R. J., et al. 2001, MNRAS, 327, 868 [Google Scholar]
- Chang, K., & Refsdal, S. 1979, Nature, 282, 561 [Google Scholar]
- Chang, K., & Refsdal, S. 1984, A&A, 132, 168 [NASA ADS] [Google Scholar]
- Chung, S.-J., Han, C., Park, B.-G., et al. 2005, ApJ, 630, 535 [Google Scholar]
- Gaudi, B. S. 1998, ApJ, 506, 533 [Google Scholar]
- Gaudi, B. S., & Gould, A. 1997, ApJ, 486, 85 [Google Scholar]
- Gonzalez, O. A., Rejkuba, M., Localize, M., et al. 2012, A&A, 543, A13 [NASA ADS] [CrossRef] [EDP Sciences] [Google Scholar]
- Gould, A. 1992, ApJ, 392, 442 [Google Scholar]
- Gould, A. 2000, ApJ, 542, 785 [NASA ADS] [CrossRef] [Google Scholar]
- Gould, A. 2004, ApJ, 606, L319 [CrossRef] [Google Scholar]
- Gould, A. 2022, arXiv e-prints [arXiv:2209.12501] [Google Scholar]
- Gould, A., & Loeb, L. 1992, ApJ, 396, 104 [NASA ADS] [CrossRef] [Google Scholar]
- Gould, A., Han, C., Zang, W., et al. 2022, A&A, 664, A13 [NASA ADS] [CrossRef] [EDP Sciences] [Google Scholar]
- Griest, K., & Safizadeh, N. 1998, ApJ, 500, 37 [Google Scholar]
- Han, C. 2006, ApJ, 638, 1080 [Google Scholar]
- Han, C., Udalski, A., Kim, D., et al. 2021a, A&A, 650, A89 [NASA ADS] [CrossRef] [EDP Sciences] [Google Scholar]
- Han, C., Udalski, A., Kim, D., et al. 2021b, A&A, 655, A21 [NASA ADS] [CrossRef] [EDP Sciences] [Google Scholar]
- Han, C., Kim, D., Gould, A., et al. 2022, A&A, 664, A33 [NASA ADS] [CrossRef] [EDP Sciences] [Google Scholar]
- Han, C., Lee, C.-U., Zang, W., et al. 2023a, A&A, 674, A90 [NASA ADS] [CrossRef] [EDP Sciences] [Google Scholar]
- Han, C., Lee, C.-U., Bond, I. A., et al. 2023b, A&A, 676, A97 [NASA ADS] [CrossRef] [EDP Sciences] [Google Scholar]
- Han, C., Jung, Y. K., Bond, I. A., et al. 2024a, A&A, 683, A115 [NASA ADS] [CrossRef] [EDP Sciences] [Google Scholar]
- Han, C., Bond, I. A., Lee, C.-U., et al. 2024b, A&A, 687, A225 [NASA ADS] [CrossRef] [EDP Sciences] [Google Scholar]
- Han, C., Albrow, M. D., Lee, C.-U. 2024c, A&A, 689, A209 [NASA ADS] [CrossRef] [EDP Sciences] [Google Scholar]
- Herrera-Martin, A., Albrow, A., Udalski, A., et al. 2020, AJ, 159, 134 [CrossRef] [Google Scholar]
- Hwang, K.-H., Zang, W., Gould, A., et al. 2022, AJ, 163, 43 [NASA ADS] [CrossRef] [Google Scholar]
- Jung, Y. K., Udalski, A., Gould, A., et al. 2018, AJ, 155, 219 [Google Scholar]
- Jung, Y. K., Han, C., Udalski, A., et al. 2021, AJ, 161, 293 [NASA ADS] [CrossRef] [Google Scholar]
- Jung, Y. K., Zang, W., Wang, H., et al. 2023, AJ, 165, 226 [NASA ADS] [CrossRef] [Google Scholar]
- Kervella, P., Thévenin, F., Di Folco, E., & Ségransan, D. 2004, A&A, 426, 29 [Google Scholar]
- Kim, S.-L., Lee, C.-U., Park, B.-G., et al. 2016, JKAS, 49, 37 [Google Scholar]
- Mao, S., & Paczynski, B. 1991, ApJ, 374, 37 [Google Scholar]
- Nataf, D. M., Gould, A., Fouqué, P., et al. 2013, ApJ, 769, 88 [Google Scholar]
- Smith, M. C., Mao, S., & Paczynski, B. 2003, MNRAS, 339, 925 [NASA ADS] [CrossRef] [Google Scholar]
- Skowron, J., Udalski, A., Gould, A., et al. 2011, ApJ, 738, 87 [Google Scholar]
- Sumi, T., Abe, F., Bond, I. A., et al. 2003, ApJ, 591, 204 [NASA ADS] [CrossRef] [Google Scholar]
- Tomaney, A. B., & Crotts, A. P. S. 1996, AJ, 112, 2872 [Google Scholar]
- Yang, H., Yee, J. C., Hwang, K.-H., et al. 2024, MNRAS, 528, 11 [NASA ADS] [CrossRef] [Google Scholar]
- Yee, J. C., Shvartzvald, Y., Gal-Yam, A., et al. 2012, ApJ, 755, 102 [Google Scholar]
- Yee, J. C., Zang, W., Udalski, A., et al. 2021, AJ, 162, 180 [NASA ADS] [CrossRef] [Google Scholar]
- Zhang, K., Gaudi, B. S., Bloom, J. S. 2022, Nat. Astron., 6, 782 [NASA ADS] [CrossRef] [Google Scholar]
- Zhu, W., Penny, M., Mao, S., Gould, A., & Gendron, R. 2014, ApJ, 788, 73 [Google Scholar]
Zhu et al. (2014) predicted that half of all planets detected in a KMTNet-like survey would lack caustic crossings, and Jung et al. (2023) confirmed this prediction for a complete sample of 2018+2019 KMTNet planets in their Table 17. Gould (2022) showed that roughly one third of planetary events that lack caustic crossings nevertheless show sufficiently strong finite-source effects to yield estimates of the normalized source radius ρ = θ*|θE, and therefore of the Einstein radius, θE.
All Tables
All Figures
|
Fig. 1 Light curve of the lensing event MOA-2022-BLG-033 and the model curve. The lower three panels offers a comprehensive view of the event and residuals from two models, while the upper two panels provides a close-up view of the anomaly (the region enclosed by a box in the lower panels). The colors of the data points correspond to the telescopes listed in the legend. |
| In the text | |
|
Fig. 2 Scatter plots of points in the MCMC chain on the (πE,E , πE,N) parameter plane. Points with ≤1σ are shown in red, ≤2σ in yellow, ≤3σ in green, ≤4σ in cyan, and ≤5σ in blue. |
| In the text | |
|
Fig. 3 Lens-system configurations for the four degenerate solutions of MOA-2022-BLG-033. In each panel, the red figure represents the caustic, and the arrowed curve indicates the source trajectory. The gray curves surrounding the caustic represent equi-magnification contours. The coordinates are centered on the position of the primary lens, and the lengths are scaled to the Einstein radius. |
| In the text | |
|
Fig. 4 Light curve of KMT-2023-BLG-0119. The second and third panels display the residuals for the inner and outer solutions, respectively. |
| In the text | |
|
Fig. 5 Configurations of the lens system for the inner and outer solutions of KMT-2023-BLG-0119. The inset in each panel offers a zoomed-out view. In the insets, blue empty circles mark the positions of the lens components: a small circle for the planet and a large circle for the host. |
| In the text | |
|
Fig. 6 Light curve of KMT-2023-BLG-1896. |
| In the text | |
|
Fig. 7 Lens system configurations of KMT-2023-BLG-1896 for the inner and outer planetary solutions (upper two panels) and the wide binary solution (bottom panel). |
| In the text | |
|
Fig. 8 Locations of source stars (filled blue dots) in the instrumental CMDs. The red dot in each panel indicates the centroid of the RGC. |
| In the text | |
|
Fig. 9 Posteriors of the mass of the planetary system. In each panel, the blue and red curves represent the distributions contributed by the disk and bulge lens populations, respectively, while the black curve represents the combined distribution from the two lens populations. The solid vertical line denotes the mean of the distribution, and the dotted lines indicate the 1σ uncertainty range. |
| In the text | |
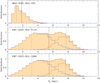 |
Fig. 10 Posteriors of the distance to the planetary system. Notations are same as those in Fig. 9. |
| In the text | |
Current usage metrics show cumulative count of Article Views (full-text article views including HTML views, PDF and ePub downloads, according to the available data) and Abstracts Views on Vision4Press platform.
Data correspond to usage on the plateform after 2015. The current usage metrics is available 48-96 hours after online publication and is updated daily on week days.
Initial download of the metrics may take a while.