Fig. 3
Download original image
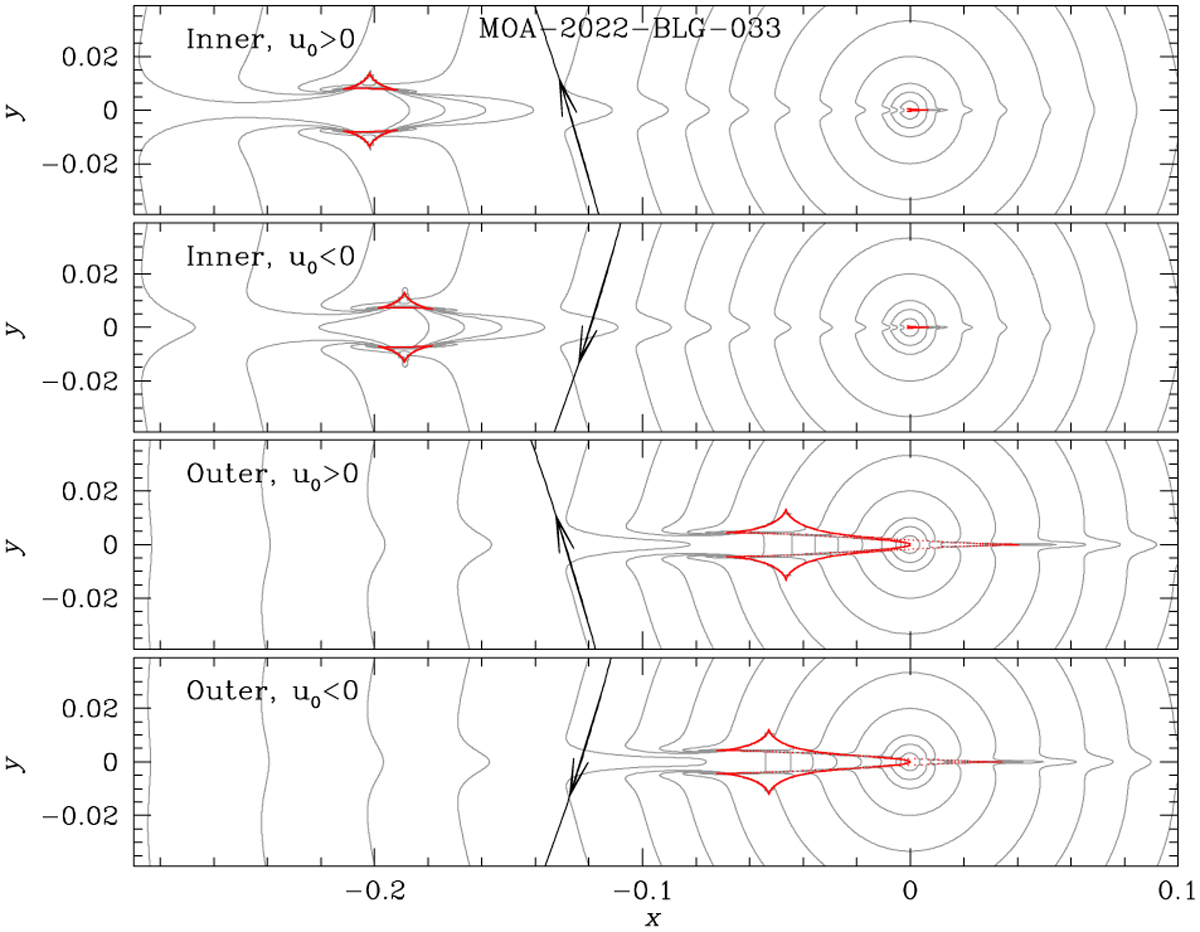
Lens-system configurations for the four degenerate solutions of MOA-2022-BLG-033. In each panel, the red figure represents the caustic, and the arrowed curve indicates the source trajectory. The gray curves surrounding the caustic represent equi-magnification contours. The coordinates are centered on the position of the primary lens, and the lengths are scaled to the Einstein radius.
Current usage metrics show cumulative count of Article Views (full-text article views including HTML views, PDF and ePub downloads, according to the available data) and Abstracts Views on Vision4Press platform.
Data correspond to usage on the plateform after 2015. The current usage metrics is available 48-96 hours after online publication and is updated daily on week days.
Initial download of the metrics may take a while.