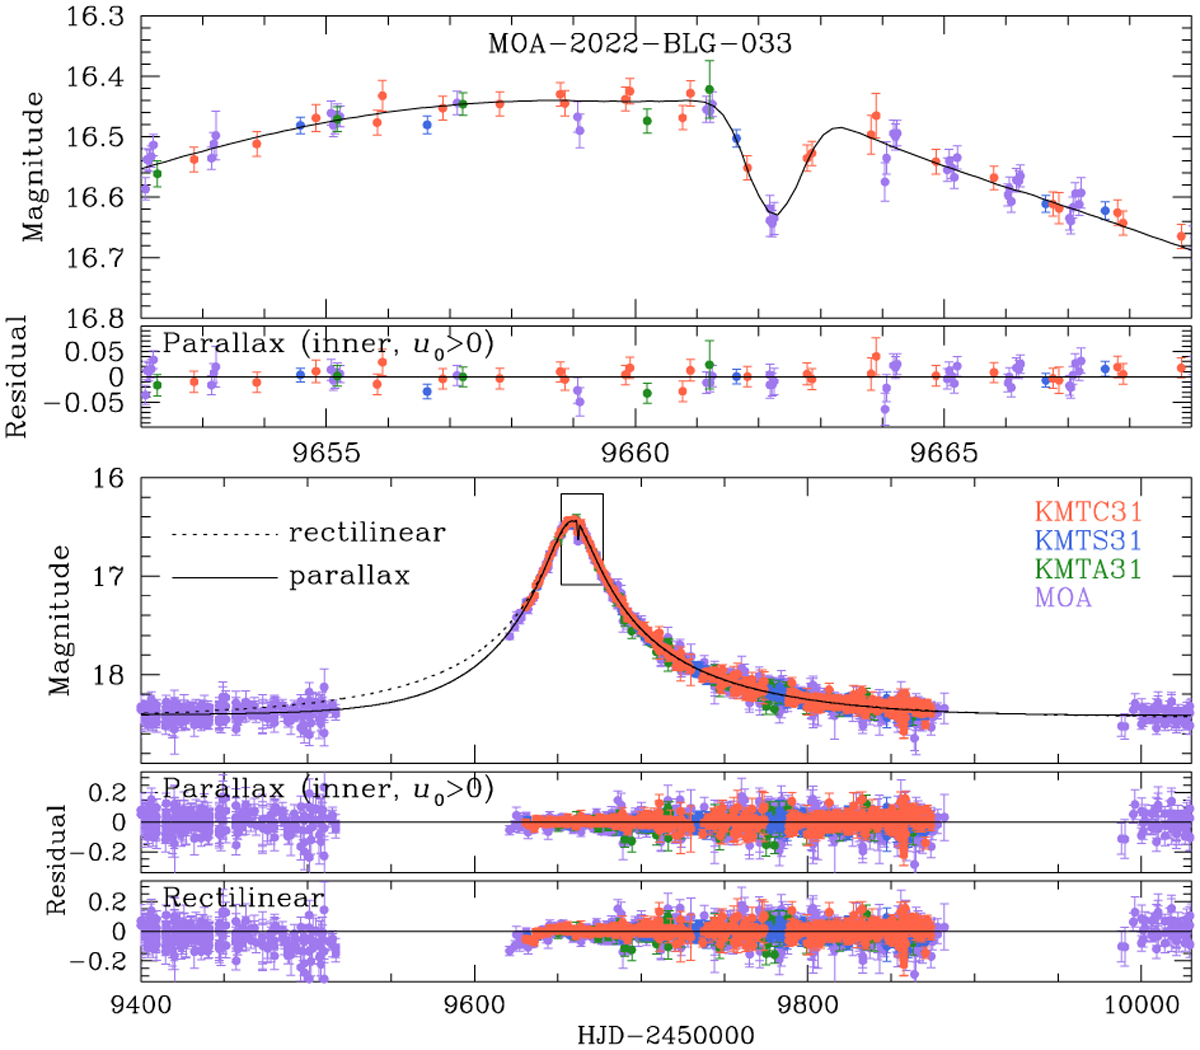
Fig. 1
Download original image
Light curve of the lensing event MOA-2022-BLG-033 and the model curve. The lower three panels offers a comprehensive view of the event and residuals from two models, while the upper two panels provides a close-up view of the anomaly (the region enclosed by a box in the lower panels). The colors of the data points correspond to the telescopes listed in the legend.
Current usage metrics show cumulative count of Article Views (full-text article views including HTML views, PDF and ePub downloads, according to the available data) and Abstracts Views on Vision4Press platform.
Data correspond to usage on the plateform after 2015. The current usage metrics is available 48-96 hours after online publication and is updated daily on week days.
Initial download of the metrics may take a while.