Fig. 2
Download original image
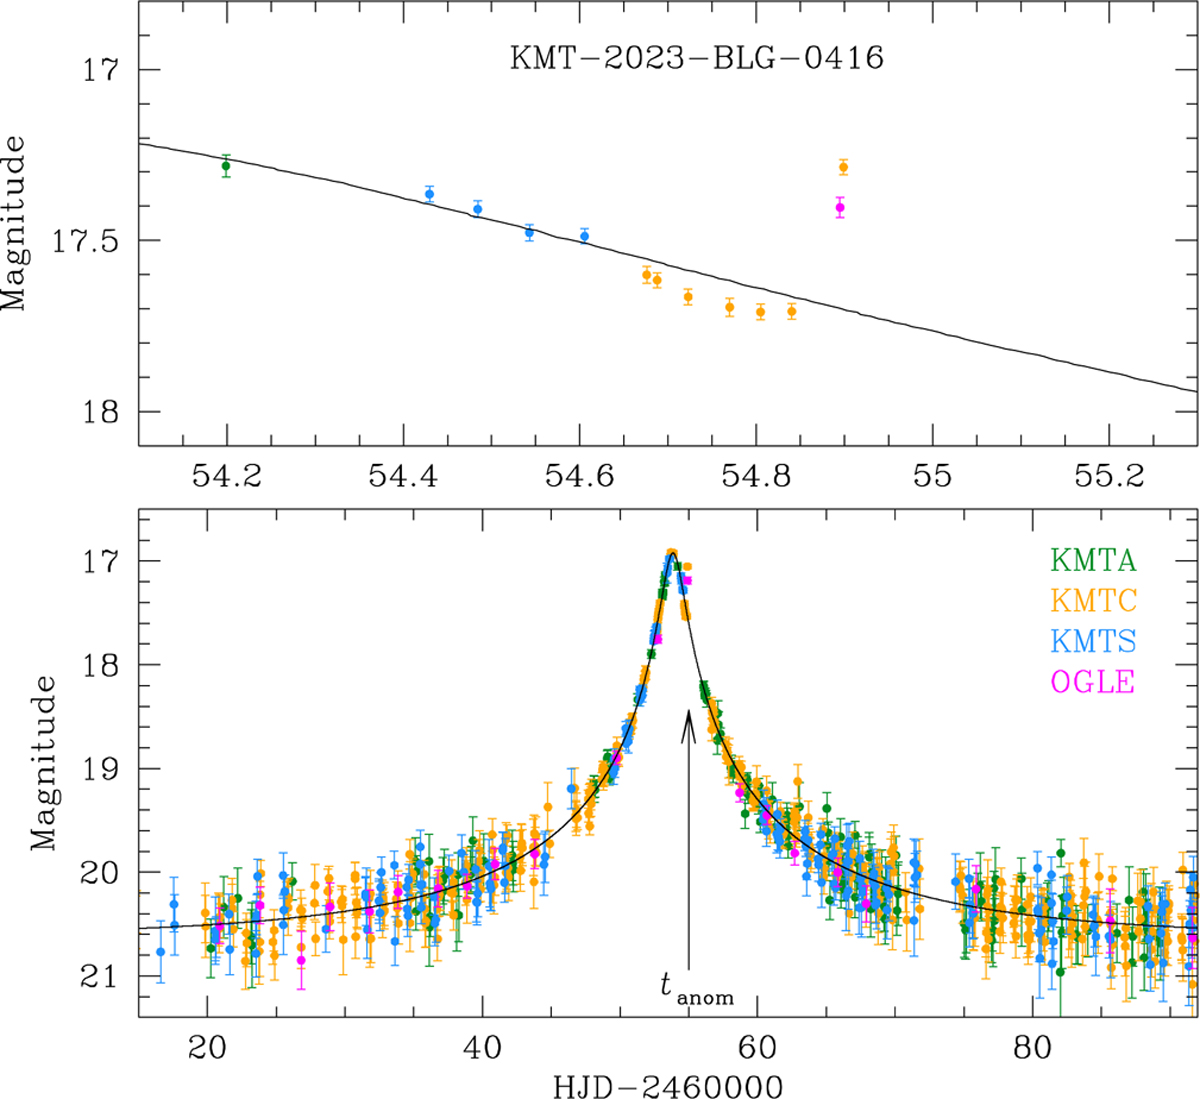
Lensing light curve of KMT-2023-BLG-0416. The lower panel presents the overall perspective, while the upper panel provides a close-up view of the anomaly region. The arrow in the lower panel indicates the time of the anomaly. The curve drawn over the data points is a 1L 1S model obtained by fitting the light curve with the exclusion of the data around the anomaly.
Current usage metrics show cumulative count of Article Views (full-text article views including HTML views, PDF and ePub downloads, according to the available data) and Abstracts Views on Vision4Press platform.
Data correspond to usage on the plateform after 2015. The current usage metrics is available 48-96 hours after online publication and is updated daily on week days.
Initial download of the metrics may take a while.