| Issue |
A&A
Volume 683, March 2024
|
|
|---|---|---|
| Article Number | A164 | |
| Number of page(s) | 10 | |
| Section | Stellar structure and evolution | |
| DOI | https://doi.org/10.1051/0004-6361/202347967 | |
| Published online | 15 March 2024 | |
Detection of pulsed X-ray emission from the isolated neutron star candidate eRASSU J131716.9–402647⋆
1
Leibniz-Institut für Astrophysik Potsdam (AIP), An der Sternwarte 16, 14482 Potsdam, Germany
e-mail: This email address is being protected from spambots. You need JavaScript enabled to view it.
2
Potsdam University, Institute for Physics and Astronomy, Karl-Liebknecht-Straße 24/25, 14476 Potsdam, Germany
3
Center for Lunar and Planetary Sciences, Institute of Geochemistry, Chinese Academy of Sciences, 99 West Lincheng Rd., 550051 Guiyang, PR China
4
Max-Planck-Institut für extraterrestrische Physik, Giessenbachstraße 1, 85748 Garching, Germany
Received:
14
September
2023
Accepted:
22
December
2023
Abstract
The X-ray source eRASSU J131716.9–402647 was recently identified from observations with Spectrum Roentgen Gamma (SRG)/eROSITA as a promising X-ray dim isolated neutron star (XDINS) candidate on the premise of a soft energy distribution, absence of catalogued counterparts, and a high X-ray-to-optical flux ratio. Here, we report the results of a multi-wavelength observational campaign with XMM-Newton, NICER and the FORS2 instrument at the ESO-VLT. We found in both the XMM-Newton and NICER data that the X-ray emission is strongly pulsed at a period of 12.757 s (pulsed fraction pf = (29.1 ± 2.6)% in the 0.2–2 keV band). The pulse profile is double-humped, and the pulsed fraction increases with energy. The XMM-Newton and NICER epochs allow us to derive a 3σ upper limit of Ṗ ≤ 8 × 10⁻¹¹ s s−1 on the spin-down rate of the neutron star. The source spectrum is well described by a purely thermal continuum, either a blackbody with kT ∼ 95 eV or a magnetised neutron star atmosphere model with kT ∼ 35 eV. Similarly to other thermally emitting isolated neutron stars, we found in either case strong deviations from the continuum, a broad absorption feature at energy ∼260 eV and a narrow one around 590 eV. The FORS2 instrument at ESO-VLT has not detected the optical counterpart (mR > 27.5 mag, 5σ detection limit), implying an X-ray-to-optical flux ratio of 104 at least. The properties of eRASSU J131716.9–402647 strongly resemble those of a highly magnetised isolated neutron star and favour an XDINS or high-B pulsar nature.
Key words: stars: neutron / pulsars: general / X-rays: individuals: eRASSU J131716.9–402647
Based on observations obtained with XMM-Newton, an ESA science mission with instruments and contributions directly funded by ESA Member States and NASA (observation 0921280101).
© The Authors 2024
 Open Access article, published by EDP Sciences, under the terms of the Creative Commons Attribution License (https://creativecommons.org/licenses/by/4.0), which permits unrestricted use, distribution, and reproduction in any medium, provided the original work is properly cited.
This article is published in open access under the Subscribe to Open model. This email address is being protected from spambots. You need JavaScript enabled to view it. to support open access publication.
1. Introduction
The seven known X-ray dim isolated neutron stars (XDINSs) are famous for their thermal spectra, which are seemingly devoid of accretion or magnetospheric activity, have long spin periods ranging from 3 s to 17 s, and have higher magnetic field strengths (1013–1014 G) than rotation-powered pulsars of similar ages (Turolla 2009). Interestingly, a more complex surface temperature distribution and high energy excess has been detected in their cumulative X-ray spectra only recently (Yoneyama et al. 2017, 2019; Dessert et al. 2020; De Grandis et al. 2022). Although the currently observed sample is small, these objects might constitute a substantial part of the Galactic population of isolated neutron stars (INS). This is implied from their estimated birthrate, which could be on par with that of the much more numerous class of rotation-powered pulsars (Keane & Kramer 2008).
The seven confirmed XDINSs have all been identified in Roentgen Satellit (ROSAT) observations (Haberl 2007). Additional searches with ROSAT and the Neil Gehrels Swift Observatory, the ever-growing dataset from the pointed X-ray Multi-Mirror Mission (XMM-Newton), and the new all-sky survey at X-ray energies conducted with the extended Roentgen Survey with an Imaging Telescope Array (eROSITA) instrument on board the Spectrum Roentgen Gamma (SRG) mission (Predehl et al. 2021), have led to the identification of new candidates (Rutledge et al. 2008; Pires et al. 2009, 2022; Rigoselli et al. 2022; Kurpas et al. 2023).
One of the recently identified candidates is the X-ray source eRASSU J131716.9–402647 (hereafter dubbed J1317; Kurpas et al. 2023). Detected in the eROSITA all-sky surveys, with a predominantly thermal X-ray spectrum that is best fit by a single absorbed blackbody model with an effective temperature of 110 eV and a high X-ray-to-optical flux ratio that implies a compact nature, it was found to fit well into the known XDINS population. However, the data available at that time did not allow ruling out the existence of non-thermal emission. Similarly, the low photon count and survey exposure gaps1 prevent a meaningful timing analysis. Therefore, an unambiguous classification of the source has not been possible yet, as is the case for other proposed XDINS candidates. To shed light on its nature, we carried out follow-up observations of J1317 with the Neutron star Interior Composition Explorer (NICER; Gendreau et al. 2016), XMM-Newton (Jansen et al. 2001), and the Focal Reducer/low dispersion Spectrograph 2 (FORS2) instrument at the ESO Very Large Telescope (ESO-VLT; Appenzeller et al. 1998).
In this paper, we report the results of this observational campaign and discuss the implications for the nature of the source. We start in Sect. 2 by describing the new data sets and reduction steps. The results of the X-ray spectral and timing analysis and optical imaging are presented in Sect. 3. Our conclusion and outlook are outlined in Sect. 4.
2. Data reduction
2.1. X-ray observations
The X-ray source J1317 was observed by NICER for 49 ks in March and April 2023 (Table 1). The raw data files were reduced with the NICERDAS software tools (Version: 2023-08-22_V011a) that are distributed with the HEASoft release 6.32.1. We extracted the event lists using the nicerl2 task and adopted a conservative event screening by setting the “saafilt” variable to “yes” and “saafilt_nicer” to “no”, the “underonly_range” was set from 0–50, the “overonly_range” from 0–5, “cor_range” to “1.5–⋆” and “elv” to a value of 30. Verifying that no periods of high background remained in the single observation files, we merged all observations with niobsmerge. We extracted the spectrum with the nicerl3-spect pipeline and used the SCORPEON2 model for the background estimation. Similarly, the nicerl3-lc pipeline was used to extract light curves. We applied the barycentric correction to the 55 375 cleaned and filtered events (0.3–2 keV band) with the barycorr task (ephemeris: JPLEPH.405, using the improved XMM-Newton based sky position).
All X-ray and optical observations.
The XMM-Newton observation of J1317 was performed in July 2023 for 36 ks (Table 1). The European Photon Imaging Camera’s (EPIC) pn and MOS detectors, equipped with the THIN filter, were operated in full frame and small window mode (73.4 ms and 300 ms time resolution3, respectively). We extracted data products using the Science Analysis System (SAS; Version: 21.0.0) and found the observation to be free from periods of enhanced background activity. To determine the source position, we performed source detection with the task edetect_stack in the standard XMM-Newton energy bands 0.5–1 keV, 1–2 keV and 2–4.5 keV, using the exposures from both the EPIC-MOS and pn detectors. We then applied the task eposcorr to refine the astrometry. We compared the position of all detected X-ray sources with a detection likelihood value “EP_DET_ML” above 150 with those of objects in the Guide Star Catalog (Version, 2.4.2; Lasker et al. 2008), whose positional errors are below 1.5″. The number of considered matches, the applied offset in RA and Dec from the initial XMM-Newton source detection localisation, and the updated source position are shown in Table 2. The results of the source detection were used to define a background region on the same CCD chip as the target devoid of other X-ray sources. The optimal centring and extraction region for the target was determined with the task eregionanalyse in the 0.2–2.0 keV band. We decided to truncate the optimal size of 40″ to a value of 16″ to minimise contamination by a neighbouring hard X-ray source located 26″ north of the target (Fig. 1). The event lists were further cleaned by applying the recommended filters “FLAG = 0”, “PATTERN ≤ 4” for EPIC-pn and “PATTERN ≤ 12” for EPIC-MOS. Likewise, we followed the XMM-Newton data analysis threads4 to extract the spectra. For the timing analysis, the 10 374 source events from EPIC-pn (0.2–2.0 keV) were barycentric corrected with the barycen task (ephemeris: DE-405) using the updated source position.
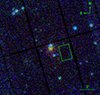 |
Fig. 1. RGB XMM-Newton EPIC image. Red indicates counts in the 0.2–1 keV band, green in the 1–2 keV band, and blue in the 2–12 keV band. The source and background regions used in the EPIC-pn analysis are marked by the green circle and box. The X-ray sources we used to correct the X-ray sky position of J1317 are marked by cyan circles. |
Positional and photometric parameters.
2.2. Optical observations
Follow-up ESO-VLT observations of the field of J1317 were carried out on May 12 and 18, 2023 (Table 1). We used the FORS2 instrument equipped with the R_SPECIAL filter to obtain deep imaging under generally photometric conditions. Three exposures affected by worsening seeing conditions (> 1.3″) on May 12 were not included in the analysis. We applied the standard FORS2 reduction pipeline within the ESO Reflex environment (Freudling et al. 2013) to correct the images for bias and flat field. The individual science exposures were astrometrically corrected with astrometry.net (Lang et al. 2010). To stack the images, they were aligned with the task wcsalign (Astropy Collaboration 2013, 2018, 2022).
3. Results
3.1. Timing analysis
In comparison to the science modes of XMM-Newton we used, the time resolution of NICER allows us to search a broader frequency range for periodic modulations. We binned the barycentre-corrected NICER photon event list into a 1 ms light curve and applied the astropy LombScargle tool (Astropy Collaboration 2013, 2018, 2022) to compute the Lomb-Scargle periodogram (Lomb 1976; Scargle 1982) for spin periods between 0.01 s–60 s (Fig. 2). The key parameters of the search we conducted are summarised in Table 3. The periodogram shows a significant periodic signal and its first harmonic at a period of 12.76 s and 6.37 s, respectively. The existence of this modulation is confirmed by the XMM-Newton data because the Lomb-Scargle periodogram computed in the range of 0.3–60 s, using photons from EPIC-pn binned into a 150 ms light curve, also detects the modulation with high significance. XMM-Newton allows us to verify that the nearby but fainter X-ray emitting source north of the target position (see image in Fig. 1) is not the origin of the pulsed emission. A corresponding search over the XMM-Newton light curve of the source did not reveal any significant periodic signal because the highest peak possesses a false-alarm probability very close to 1.
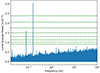 |
Fig. 2. NICER Lomb-Scargle periodogram. The green lines indicate the Lomb-Scargle power, which equals a significance of 1–8σ (from bottom to top). |
Timing parameters from the NICER and XMM-Newton observation.
To improve the period estimation and derive its significance, we applied the Bayesian-based folding method of Gregory & Loredo (1996). The method calculates a prescription of frequency-dependent odds ratio Om that the data favour a periodic model with m phase bins over the null (unpulsed) model. Following Zavlin et al. (2000), we adopted a characteristic number of mmax = 12 and a frequency interval of 20 μHz centred on the fundamental frequency ν0 = 0.078388 Hz. The resulting odds ratio values of  and 5 × 1048, obtained for NICER and XMM-Newton, respectively, give a probability of virtually 100% that a periodic signal is present in the tested frequency range (see Table 3 for details). The corresponding 68% confidence intervals are PNICER = 12.757129(16) s and PXMM = 12.75707(7) s. The accuracy on the period is not high enough to phase-connect the two data sets because the more accurate NICER timing solution predicts 683 991.2 ± 0.9 spin cycles between the time of phase zero of both observations. Nonetheless, the current estimates rule out spin-down values in excess of Ṗ ≤ 8 × 10⁻¹¹ s s−1, at the 3σ confidence level.
With the corresponding best period estimates, we folded both light curves in phase and chose the minimum of the pulse profile as the time of phase zero (see Table 3 and Fig. 3). Consistent with the results of the Lomb-Scargle the pulse profile is clearly double-humped. Interestingly, the minima between the pulses are of different depth and the pulses are of different height, the second being weaker than the first. We derived pulsed fractions of (10.7 ± 1.2)% (0.3–2.0 keV) for NICER and (29.1 ± 2.6)% (0.2–2.0 keV) for XMM-Newton, respectively. The background was not subtracted for either value. Thus, the discrepancy may be explained by a stronger background event contamination for NICER. In Fig. 4, we show the energy and phase dependence of the pulse for EPIC-pn. The pulse at phase 0.7 seems to be strongest at intermediate to high energies, whereas the pulse around phase 0.25 seems to be strongest at soft energies. Similarly, the pulsed fraction increases with energy from 15(7)% (0.2–0.3 keV) to 65(14)% (1–1.5 keV).
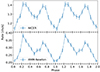 |
Fig. 3. Phase-folded light curves showing the pulse profile of J1317 in the 0.3–2 keV (NICER) and 0.2–2 keV (XMM-Newton) energy band. Two cycles are shown for visual purposes. |
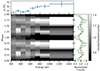 |
Fig. 4. Dependence of the pulse profile as a function of energy and phase. The number of detected photons in EPIC-pn, normalised by the median value derived from the sum of all photons that were detected in a certain energy bin column, is colour-coded. At the top, we indicate the pulsed fraction, determined from events in a certain energy bin, whereas to the right, we plot the normalised light curves in the energy bands 0.2–0.4 keV (blue), 0.4–0.8 keV (orange), and 0.8–2 keV (green). They were computed by summing up all events in a certain phase bin and energy range and normalising again by the median number of counts in the given energy range and all phase bins. |
3.2. X-ray spectral analysis
We used XSPEC (version 12.13.0, Arnaud 1996) to fit spectral models to the XMM-Newton and NICER data sets. The spectra were binned with at least 25 counts per spectral bin to allow for the use of the χ2 statistic. We accounted for the interstellar absorption by applying the tbabs model with elemental abundances described in Wilms et al. (2000). When spectra from several instruments (EPIC-pn, EPIC-MOS1, EPIC-MOS2, and NICER) were fitted simultaneously, we added a constant factor to account for calibration uncertainties. When fitting the NICER spectrum, the background was simultaneously fitted adopting the SCORPEON model. We found that all spectra are affected by the hard source located north of the target. To account for the level of contamination and estimate its dependence with energy, we extracted the spectrum of the hard source from the EPIC-pn exposure. We used a small aperture of 6″ to prevent bias from the brighter point spread function (PSF) of the target. Due to the low count number (357 events extracted in the 0.2–12 keV energy range), we adopted the Bayesian X-ray Analysis (BXA; Buchner et al. 2014) package to fit the unbinned data. The spectrum of the contaminant is well described by an absorbed power-law model with a photon index of  , NH = (10 ± 4)×1020 cm−2 and fX = 8.4(5)×10−14 erg s−1 cm−2 (0.2–10 keV), typical of that of an active galactic nucleus (AGN). The column density is consistent with the Galactic value of 6.7 × 1020 cm−2 in the direction of the source (HI4PI Collaboration 2016). We added this power-law model as an additional background component to fits of the NICER spectrum. For XMM-Newton the contamination can be mitigated if the energy range is constrained to 0.2–2.0 keV. We found XMM-Newton and NICER to give consistent results when NICER is limited to the energy range of 0.4–10 keV. We list the fit results of all models we used in Table 4.
X-ray spectrum fitting results.
We began the spectral analysis by fitting a single blackbody (BB), neutron star atmosphere (NSA; Pavlov et al. 1995; Zavlin et al. 1996) or power-law (PL) model to the EPIC-pn spectrum. This approach is motivated by the fact that the spectral analysis of the eROSITA data could not exclude any of these models (Kurpas et al. 2023). For all three models, we found high systematic residuals, a poor fit quality, and column densities in excess of the Galactic value (see Table 4 and Fig. 5, for the BB case). The addition of a PL component on the thermal models (BB, NSA), as usually observed as a hard tail in the spectrum of middle-aged spin-powered pulsars (e.g. Schwope et al. 2022), does not improve the fit. Combining multiple BB components, which is indicative of a more complex surface temperature distribution, did not improve the fit either. Interestingly, we found that the addition of a multiplicative broad Gaussian absorption line (GABS model) at the low-energy end of the spectrum (200 − 400 eV) significantly improved the fit quality. For a PL continuum (combined with a single GABS component), the resulting fit shows a good agreement between data and model and no significant residuals that might imply the necessity for additional model components. The fit of the thermal models (both BB and NSA) with one GABS component, although an improvement with respect to the single-component case, still shows high  values and systematic residuals consistently around energies of 550 − 600 eV (see Fig. 5, again for the BB case). The addition of a second GABS component improves the results in both cases, but it introduces degeneracy between NH and the parameters of the lines. Fixing the widths of the two Gaussian components to their best-fit values, σ1 = 150 eV and σ2 = 15 eV, leads to slightly more accurate line energies and smaller errors on the NH (shown for the BB case in Table 4), but does not allow us to constrain the exact value of the column density. Thus, the NH values we obtained can only be regarded as an upper limit, but they strongly favour a Galactic source.
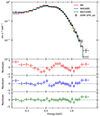 |
Fig. 5. EPIC-pn spectrum in the energy range 0.2–2 keV. We indicate the best model and residuals for a single absorbed BB model (red), an absorbed BB with a single absorption component (blue), and an absorbed BB with two absorption components (green). |
For a BB continuum, we studied the significance of the detected lines by computing the false-negative rates (an existing feature is not identified) and false-positive rates (the fit statistics are improved only by chance when absorption components are added). We used the best-fit BB2GABS model and the XSPEC fakeit command to simulate 1000 spectra and fitted them with a single BB, BBGABS, and BB2GABS model. We found that a BB model was never preferred over the BBGABS fit and that a BBGABS only gave better fits than a BB2GABS model in 2% of the cases. Since the line parameters were generally well recovered, the simulations imply very low false-negative rates close to 0% for the broad feature at ∼260 eV and 2% for the narrow line at ∼590 eV. For the false-positive case, we simulated 1000 BB and BBGABS spectra each and then conducted fits with the simulated model and with one model that contained an additional absorption component. In both cases, we found that similarly large improvements in the fit statistic ( for the broad feature and
  for the narrow one) by the addition of a line were never observed in the simulations. This implies false-positive rates close to 0% for both features. We conclude that both features seem to be detected with very high significance.
We next tried fits with other absorption feature components available in XSPEC (GAUSS and edge), combining them with a BB continuum. Fits with the GAUSS component reproduce the results from the GABS models. On the other hand, three edge components are necessary to properly fit the spectrum ( ), suggesting a possible third line at
  eV. However, we note that the resulting
  cm−2 significantly exceeds the Galactic value and that the fit statistics is worse than in the GABS and GAUSS cases.
The NSA model fits have shown that in comparison to non-magnetised models, better  values are obtained when the magnetic field is taken into account. They allow us to obtain distance estimates. We do not list them in Table 4, but found the largest distances for magnetised NSA models with two absorption lines, converging to
  pc (1012 G) and
  pc (1013 G), respectively. These may be comparable (within 2–3σ) to those inferred for the known population of XDINSs (see e.g. Motch et al. 2009, and references therein), but could be too small considering the much lower flux of J1317.
Alternatively, composite models consisting of two blackbody components or of a blackbody plus power-law, in both cases modified by a Gaussian absorption feature (2BBGABS and BBPLGABS, respectively), also fit the data well ( and
and  ). However, for both models, the column density is a factor of 1.5–5 in excess of the Galactic value (considering the 1σ confidence interval). For the 2BBGABS case, the BB radius at 1 kpc distance is too large for an INS nature. Assuming a canonical radius of 12 km, this would imply distances between 40 and 400 pc that are in stark contrast to the high NH values. In the case of the BBPLGABS model, the photon index of the power-law component is unreasonably steep (
 ), while the thermal component only dominates the high-energy end of the spectrum. This is at odds with what is observed in, X-ray binaries and rotation-powered pulsars, for instance, making these composite models overall less compelling than those with multiple lines.
The investigation of a hard excess in the spectrum of J1317 is made difficult at the current signal-to-noise ratio by contamination from the neighbouring X-ray source. In order to constrain it, we extracted the EPIC-pn spectrum using a large extraction region radius of ≈40″, which encompasses PSF counts from both sources. We then fitted the spectrum in the energy range of 0.2–8 keV. We defined a model consisting of an absorbed BB component with two absorption lines and an independently absorbed PL component, with both the column density and photon index parameters fixed to the best-fit values obtained for the contaminant. The fit is virtually identical to the BB2GABS fit in Table 4, with no indications of a systematic excess emission at harder energies. The BB and PL components converge to flux values of 4.62(5)×10−13 erg s−1 cm−2 and 8.8(6)×10−14 erg s−1 cm−2 (both 0.2–10 keV), respectively. These values agree well with those obtained from the single fits to J1317 and the contaminant spectrum.
Using the period estimate from XMM-Newton (Table 3), we performed phase-resolved spectroscopy with the EPIC-pn dataset by splitting the photons into four phase bins (0.875–0.125, 0.125–0.375, 0.375–0.625, and 0.625–0.875) including 2000–3000 photons each. The four spectra were then simultaneously fitted with a BB, BBGABS, and BB2GABS model. To lift the degeneracies and aid the fits, the NH was fixed to the phase-averaged upper limit of 5 × 1020 cm−2, the line widths of the broad and narrow feature were fixed to 150 eV and 15 eV, respectively, and the effective temperature was tied to the same value for all phases. We found that a single BB model does not give a convincing fit ( ), but the fit can be improved when broad lines at ∼300 eV are included at all phases (
 ). This fit shows strong residuals at ∼590 eV that are most prevalent at phase 0.125–0.375. Including a second narrow line in this phase bin yields a near perfect fit (
 ; see Table 5). Fitting this narrow feature in other phase bins gives similar line energies around 590 eV, but only marginally improves the fit statistic (
 ). We found that leaving the line widths or effective temperatures free to vary during the fits only slightly improves the fit statistic, but results in decreased precision in the parameter estimation, such that no significant changes in temperature or line width can be observed. We studied the detection significance of the features by simulating for each phase and feature 1000 spectra with and without the best-fit line. We then repeated the spectral analysis with the real and simulated data, including in each fit only one simulated spectrum at a time, to study the false-positive and false-negative rates. The line parameters of the broad features and the narrow feature at phase 0.125–0.375 were generally well recovered, and all fits implied low false-positive and false-negative rates virtually identical with zero. However, the current data do not allow us to significantly detect or exclude the existence of the narrow feature at the other phase bins because the simulations resulted in false-positive rates of 5–70% and false-negative rates of 8–47%. We conclude that the broad feature appears to be observable in all phases. The narrow feature could be phase dependent because it was only significantly detected in one phase bin. However, additional observations are necessary to fully characterise its phase-dependence.
Phase-resolved spectrum fit result.
We tried simultaneous phase-averaged fits of all the available instruments (EPIC-pn, EPIC-MOS1, EPIC-MOS2, and NICER) next. The results are generally consistent with the single EPIC-pn fits. The only difference is that thermal models, including only a single absorption line, already fit well (as shown for the BB case in Table 4). Systematic residuals, indicating the necessity for a second line around 600 eV, are not apparent. We attribute this to the fact that the noise added by including NICER and EPIC-MOS dominates in comparison to the residuals caused by the absorption feature. Consequently, adding a second GABS component to the spectral fit improves the fit statistic only slightly and is less well constrained than EPIC-pn. We thus accept as our final model a pure blackbody continuum of  eV modified by a broad line at
  eV, a narrow line at
  eV, and cold interstellar matter with a column density below 5 × 1020 cm−2 (see line 3 in Table 4).
3.3. VLT observation
With respect to previous imaging with the Southern African Large Telescope (SALT; Kurpas et al. 2023), the deeper ESO-VLT observations allow us to further improve the limit on the X-ray-to-optical flux ratio for this source and to search for faint optical counterparts. We applied the SExtractor software (Bertin & Arnouts 1996) to detect all sources near J1317 and mark them in Fig. 6. The updated XMM-Newton EPIC position of the target, although consistent within 2σ, is 1.3″ offset from that derived from the eROSITA data. This brings J1317 closer to two field sources that are now separated by only 1.7″ and 2.5″ (see sources to the east in Fig. 6). The magnitudes of these sources were measured at 26 mag and 24.5 mag, respectively. They were not detected in the SALT image presented in Kurpas et al. (2023), since their magnitudes are close to the detection limit. Nonetheless, the association of the target with any of these possible optical counterparts is unlikely, with angular separations at 7σ and 11σ (Table 2).
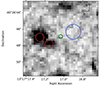 |
Fig. 6. FORS2 R_SPECIAL-band image of the field of J1317. The circles indicate the 1σ positional uncertainty estimated from XMM-Newton (green) and eROSITA (blue). We searched for possible counterparts using the SExtractor software. The identified field objects are marked in brown (circles have arbitrary radii of 1″). |
We used the nightly determined calibration zero points and extinction values provided by ESO5 for the magnitude calibration of the FORS imaging. Assuming a 5σ detection limit, the equation for the magnitude limit of a point source in an optimal Gaussian aperture was used to estimate the image depth. Based on the parameters shown in Table 2, we obtained a limiting magnitude of 27.5 mag at the position of the target, resulting in an X-ray-to-optical flux ratio of 104 at least. Such an extreme value can only be observed among INSs (Fig. 7).
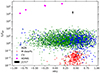 |
Fig. 7. X-ray-to-optical flux ratios of several classes of X-ray emitters as a function of hardness ratio (see Kurpas et al. 2023, for details). The updated position of the target is denoted by the lower limit in black and is compared to those of the five XDINSs on the German eROSITA footprint (western hemisphere from the Galactic centre; magenta data points). |
4. Discussion and outlook
In this work, we report the results of dedicated NICER, XMM-Newton, and ESO-VLT follow-up observations of the INS candidate J1317. This campaign unveiled a highly significant periodic signal at a period of 12.757 s, very likely associated with the spin of the neutron star. The pulse profile is clearly double-humped, and we found the pulsed fraction to increase with energy. The results are well in line with expectations for a highly magnetised INS.
In Fig. 8 we plot the spin versus spin-down diagram of neutron stars from the ATNF Pulsar Catalogue6 (Version 1.70; Manchester et al. 2005). The detected periodicity places J1317 where we would expect to find an XDINS, magnetar or high-B pulsar (see e.g. Enoto et al. 2019, and references therein, for an overview of the Galactic INS population). The XMM-Newton and NICER epochs only allow us to derive an upper limit on the spin-down of the source, Ṗ ≤ 8 × 10⁻¹¹ s s−1 (3σ). Under the usual assumption of magnetic dipole braking in vacuum (Ostriker & Gunn 1969), the dipolar magnetic field in the equator and characteristic age of J1317 are constrained to  G ≤1015 G and τch ≥ 2600 yr. A better constraint on the evolutionary state of the neutron star relies on the eventual measurement of the spin-down rate and possible detection of radio and γ-ray counterparts.
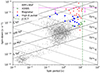 |
Fig. 8. Spin vs. spin-down diagram presenting the spin properties of the known isolated neutron star population. In the background, we plot all the objects collected in the ATNF pulsar database (Version 1.70; Manchester et al. 2005). The period of J1317 is marked by the vertical green line. The horizontal magenta line indicates the upper 3σ spin-down limit derived from the XMM-Newton and NICER observations. |
The deep ESO-VLT FORS2 observations of the field of the XDINS candidate in the R_SPECIAL band revealed two faint sources in the vicinity of J1317. The association of these two sources with the neutron star candidate is unlikely however, because the updated XMM-Newton EPIC position implies a significant separation of 7–11σ from these objects. The absence of counterparts to such an extreme X-ray-to-optical flux ratio, ≥104, further supports an INS nature (Fig. 7).
The spectrum of J1317 cannot be described by a single-component model. Good spectral fits can be obtained if the continuum (a blackbody, power-law, or a fully ionised neutron star model atmosphere) is modified by one or two Gaussian absorption features. All these models have in common that one line is located at soft energies between 200 eV and 400 eV with a width of σ ∼ 150 eV. The second line, strictly necessary for thermal continuum fits (BB and NSA) to the EPIC-pn spectrum, is located around 590 eV with a smaller Gaussian width of σ = 10 − 30 eV. The lines seem to be detected with very high significance. Testing other absorption components, we found that only an edge model affects the spectral results significantly because a third feature at ∼860 eV is necessary to achieve an acceptable fit. However, we note that compared to the models using a GABS component, the fit statistic is generally worse and the NH significantly exceeds the Galactic value, making them less convincing. The temperature of the continuum spectrum is kT ∼ 95 eV in the BB case and kT ∼ 35 eV for the NSA model. We note that the low NSA model temperature may predict an optical flux that is too high, as is known from the XDINSs (Pavlov et al. 1996). Similarly, the NSA model assumes uniform temperature emission from the full neutron star surface, which might explain the low distance values from this model. Other spectral models may give statistically valid fits, but are less compelling on the basis of their parameter values (e.g. a 2BBGABS model that implies a small distance of only 40–400 pc for a typical neutron star radius of 12 km, but, despite the absorption feature, converges to column densities well in excess of the Galactic value).
The eROSITA spectra discussed in Kurpas et al. (2023) did not allow us to statistically exclude a PL nature of the source. Here, a good fit can be obtained when a PL is combined with an absorption feature, but the resulting photon index of Γ = 9.5(4) is even larger than observed for eROSITA. This value is too high because neutron star non-thermal emission components are usually observed to have Γ < 3 (Becker 2009). The column density exceeding the Galactic value may imply an extragalactic nature. The only extragalactic objects that reach very large photon indices are Seyfert I galaxies (Grünwald et al. 2023). However, the very high X-ray-to-optical flux limits and the strong detected pulsation at 12.757 s make an Seyfert I galaxy nature very unlikely. Thus, it seems that the PL can be rejected as a valid spectral model.
The obtained flux values from the EPIC-pn spectral fits and from fits using all spectra (Table 4) agree with those derived from eROSITA (Kurpas et al. 2023) and thus by extension also with ROSAT. Nevertheless, if the long-term variability of J1317 is to be probed, the influence of the contaminant needs to be considered, which was not separately detected in ROSAT, in any of the eROSITA surveys, or in the independent analysis of Kurpas et al. (2023). The best-fit contaminant power-law model indicates a flux of ∼3 × 10⁻¹⁴ erg s−1 cm−2 in the 0.2–2 keV band, where the emission is most prevalent in the short eROSITA observation. This is of the same size as the 1σ eROSITA flux error. Since the eROSITA confidence interval agrees well with results from XMM-Newton and NICER, we conclude that the contaminant did not significantly affect the eROSITA flux measurement. Since the estimated eROSITA count rate is comparable with the ROSAT measurement (with a similarly short exposure), the emission of J1317 seems to have been stable over the past 30 years.
The BB fits give upper limits on the absorbing hydrogen column density and can therefore be used to compute limits on the distance to the source. We used the relations given in Güver & Özel (2009) and Cardelli et al. (1989) to compute the total extinction A(5500 Å) < 0.226 for NH < 5 × 1020 cm−2. We compared this limit to the total extinction in the direction of J1317 as it can be inferred from the Gaia-2MASS 3D maps of Galactic interstellar dust (Lallement et al. 2022) and found them to be almost exactly in accordance with a distance of 1 kpc. This implies a radius of  km and a luminosity of
  erg s−1. More constraining values can be derived from the spectral fit with fixed Gaussian line widths. Here, the limit of NH < 2 × 1020 cm−2 implies A(5500 Å) < 0.09 and indicates a distance of only 185 pc. We then computed a BB radius of
  km and a luminosity of
  erg s−1. We note that similarly to the NSA distance estimate, the distance of 185 pc may be too small. While the value would agree with the distance to the closest XDINS RX J1856.5–3754 (van Kerkwijk & Kaplan 2007), we note that the flux of J1317 is a factor 4–20 lower than those observed for the other XDINSs (∼2 × 10⁻¹² − 1 × 10⁻¹¹ erg s−1 cm−2). Only the flux of the XDINS RX J0420.0–5022 may be comparable with J1317 (Haberl et al. 2004), but the spectrum of this source is much softer, and its distance was estimated to ∼345 pc (Posselt et al. 2007).
The fact that the thermal continuum needs to be modified by multiple absorption features to properly fit the spectrum makes J1317 very similar to XDINSs and other thermally emitting INSs. In particular, a very similar broad absorption line at 200(40) eV with a Gaussian width of  eV and equivalent width (EW) of
  eV has been reported in the EPIC-pn spectrum of RBS 1223 (Borghese et al. 2017). Interestingly, RBS 1223 also exhibits a double-humped pulse profile at a similar long spin period of 10.31 s, and it is the source with the highest pulsed fraction of the seven XDINSs (19%, 0.2–1.2 keV). As observed for J1317, the pulsed fraction seems to increase with energy (Schwope et al. 2005). The other XDINSs possess features with lower EW values that agree better with the more narrow line at ∼590 eV (e.g. Turolla 2009).
Absorption features in the spectra of XDINSs are expected to arise due to proton cyclotron resonances (Staubert et al. 2019), atomic bound-bound or bound-free transitions in the neutron star atmosphere (e.g. van Kerkwijk & Kaplan 2007), the presence of highly ionised oxygen in the ISM, atmosphere, or vicinity of the neutron star (Hambaryan et al. 2009; Hohle et al. 2012), or they might be of spurious nature because multi-temperature thermal components on the surface of the neutron star might mimic such features (Viganò et al. 2014). The general consensus is that the spectra combine features with different physical origins, and thus, the two detected features in the spectrum of J1317 might generally be of different nature. When we interpret them to be caused by proton cyclotron absorption, the magnetic field of J1317 could be estimated via ![Mathematical equation: $ E_{\mathrm{cyc}} = 0.063 \frac{B}{10^{13}\,\mathrm{G}} \times(1+z) \left[\mathrm{keV}\right] $](/articles/aa/full_html/2024/03/aa47967-23/aa47967-23-eq142.gif) , with z being the gravitational redshift. For a canonical neutron star with M = 1.4 M⊙ and R = 12 km, z = 0.35. Based on the line energy of
, with z being the gravitational redshift. For a canonical neutron star with M = 1.4 M⊙ and R = 12 km, z = 0.35. Based on the line energy of  eV, a proton cyclotron feature would imply a magnetic field of
  G. This would indicate that J1317 is a highly magnetised neutron star, and it agrees well with the dipolar magnetic field strengths inferred for XDINSs. The line energy of the second feature would imply a magnetic field strength of
  G, indicating that it could emerge from a more magnetised structure near the neutron star surface. This configuration was proposed for narrow absorption features in other thermally emitting INSs (e.g. Tiengo et al. 2013; Borghese et al. 2017). However, these features are usually too weak to be detectable in the phase-averaged spectrum and were observed to be highly phase dependent. Given the results of the phase-resolved spectroscopy, establishing or excluding a phase-dependent nature of the narrow feature of J1317 is difficult, however. Alternatively, the features of J1317 might be interpreted as being produced by atomic transitions in a hydrogen atmosphere, but in this case, the feature at ∼590 eV would also need magnetic field strengths in excess of 1014 G (see Fig. 7 in van Kerkwijk & Kaplan 2007), which is higher than the dipolar fields observed in the other XDINSs. Thus, the presence of a He or higher-Z atmosphere would be more compelling because they allow for lines at the observed energy and typical XDINS magnetic field strengths (see e.g. Pavlov & Bezchastnov 2005; Mori & Ho 2007). Absorption by the presence of highly ionised oxygen would cause features between 500 − 600 eV. These lines are generally narrower than the line that is observed for J1317, which might imply that it is intrinsic to the source (comparable to the interpretation of the line at ∼530 eV in the RGS spectrum of RBS 1223; Hohle et al. 2012). In the last case, the features could be artefacts caused by a non-optimal spectral modelling that does not sufficiently account for the effects of a more complicated surface temperature distribution. However, Viganò et al. (2014) reported that the spectrum of RBS 1223 is difficult to model with inhomogeneous temperature distributions. Because the spectra of J1317 and RBS 1223 are very similar, this might also hold true here. Based on the available data alone, an exact characterisation of the observed features is difficult because at the moment, multiple production mechanisms are possible for each of them. Additional observations are required to attain more stringent constraints on their parameters (e.g. phase dependence, energy, width, and strength).
The soft and seemingly purely thermal spectrum and lack of significant flux and spectral variability speak against a magnetar nature. These sources, usually discovered when undergoing bright bursts of X-ray and soft γ-ray emission, possess much harder spectra, show higher persistent X-ray fluxes and strong and complex variability. Similarly, the absence of a detectable supernova remnant at X-ray energies seems to exclude a young pulsar nature. The XDINS population is oftentimes compared to the population of high-B pulsars (see Enoto et al. 2019, and references therein). Located at the intersection of conventional rotation-powered pulsars and magnetars (we indicated high-B pulsars mentioned in Ng & Kaspi 2011; Olausen et al. 2013; and Potekhin et al. 2020 in Fig. 8), these objects possess magnetic fields of Bdip = 1013 − 1014 G. However, their emission is thought to be governed by magnetic braking and not by remnant heat and the decay of the magnetic field, as is proposed for the XDINSs. In comparison with the latter, high-B pulsars seem less efficient in converting spin-down power into X-ray luminosity, as is the case for conventional pulsars (e.g. Possenti et al. 2002). Based on the spin-down rate limit derived for J1317 (Sect. 3.1), we can constrain its spin-down luminosity as Ė ∼ 6.3 × 1046(ṖP−3) g cm2 ≤ 2.4 × 1033 erg s−1 at the 3σ level. For comparison, in Fig. 9 we show the X-ray luminosity of several isolated pulsars as a function of the luminosity available from spin down. The parameter space covered by our current limits on J1317 is marked by a shaded grey area, assuming that the source is at a distance of 0.1–1 kpc. Based on the current limits, both a high-B pulsar and an XDINS are possible for J1317. This makes the neutron star an interesting target for a search for its radio counterpart. On the one hand, the detection of coherent radio emission may provide an independent distance estimate from the dispersion measure and a possible constraint on the pulsar braking index via a precise timing solution. On the other, it can shed light on whether XDINSs are truly radio quiet or are nearby long-period radio pulsars for which the narrow emission beam simply does not sweep over the Earth (Kondratiev et al. 2009). In comparison to the known high-B pulsars (0.15 s ≤P ≤ 7.74 s), the spin period of J1317 is longer. At the time of writing, J1317 is only the 13th neutron star detected with a spin period in excess of 10 s. Only the XDINS RX J0720.4–3125 (Hambaryan et al. 2017) and the radio detected neutron stars GLEAM-X J162759.5–523504.3 (Hurley-Walker et al. 2022), PSR J0901–4046 (Caleb et al. 2022), PSR J0250+5854 (Tan et al. 2018), and PSR J1903+0433g (Han et al. 2021) possess longer spin periods. Combined with its bright thermal luminosity, which is already conservatively comparable to that available from spin-down, this suggests that the evolutionary path is considerably affected by the super strong magnetic field of the neutron star.
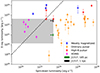 |
Fig. 9. X-ray luminosity as a function of spin-down luminosity for the collection of thermally emitting isolated neutron stars from Potekhin et al. (2020). The luminosity limits inferred for J1317 are shown in green (for a distance of 185 pc) and black (for a distance of 1 kpc). The grey box indicates the parameter space constrained by the current data, assuming distances within 0.1–1 kpc and the spin-down limit from the timing analysis Ṗ ≤ 8 × 10⁻¹¹ s s−1(3σ). The dashed black line indicates where both luminosities are equal in value. |
To summarise, the recent observations of J1317 have clearly confirmed the INS nature of the source. The detected pulsations at 12.757 s and evidence of spectral absorption features are remarkable among X-ray pulsars and may indicate the signature of a strong magnetic field. Its overall properties are in line with an XDINS nature within the scenario that they have evolved from magnetars, but they are also similar to those of high-B pulsars for which the effects of field decay have not been as significant. The XMM-Newton and NICER observations give only a weak limit on the spin-down rate of the neutron star. A dedicated coherent timing solution is necessary to further characterise the evolutionary state of the source, that is, to determine its position in the spin versus spin-down diagram of INSs and obtain more stringent estimates on the neutron star magnetic field, characteristic age, and spin-down luminosity. Similarly, observations at radio energies might be interesting because the apparent lack of radio emission in XDINSs is one of their main defining characteristics.
eROSITA covered the source position five times between January 2020 and January 2022; see Kurpas et al. (2023) for details.
The magnitude zero points and extinction values can be accessed at: http://archive.eso.org/qc1/qc1_cgi?action=qc1_browse_tabletable=fors2_photometry
Acknowledgments
We thank the anonymous referee and the editor for very helpful comments and suggestions that improved this article. This work was funded by the Deutsche Forschungsgemeinschaft (DFG, German Research Foundation) – 414059771. This work was supported by the project XMM2ATHENA, which has received funding from the European Union’s Horizon 2020 research and innovation programme under grant agreement no:101004168. Based on observations made with ESO Telescopes at the La Silla Paranal Observatory under programme ID 111.259R.001. This research has made use of data and/or software provided by the High Energy Astrophysics Science Archive Research Center (HEASARC), which is a service of the Astrophysics Science Division at NASA/GSFC. This work is based on data from eROSITA, the soft X-ray instrument aboard SRG, a joint Russian-German science mission supported by the Russian Space Agency (Roskosmos), in the interests of the Russian Academy of Sciences represented by its Space Research Institute (IKI), and the Deutsches Zentrum für Luft- und Raumfahrt (DLR). The SRG spacecraft was built by Lavochkin Association (NPOL) and its subcontractors, and is operated by NPOL with support from the Max Planck Institute for Extraterrestrial Physics (MPE). The development and construction of the eROSITA X-ray instrument was led by MPE, with contributions from the Dr. Karl Remeis Observatory Bamberg & ECAP (FAU Erlangen-Nuernberg), the University of Hamburg Observatory, the Leibniz Institute for Astrophysics Potsdam (AIP), and the Institute for Astronomy and Astrophysics of the University of Tübingen, with the support of DLR and the Max Planck Society. The Argelander Institute for Astronomy of the University of Bonn and the Ludwig Maximilians Universität Munich also participated in the science preparation for eROSITA. The eROSITA data shown here were processed using the eSASS/NRTA software system developed by the German eROSITA consortium. For analysing X-ray spectra, we use the analysis software BXA (Buchner et al. 2014), which connects the nested sampling algorithm UltraNest (Buchner 2021) with the fitting environment XSPEC (Arnaud 1996). This research has made use of the VizieR catalogue access tool, CDS, Strasbourg, France (DOI: 10.26093/cds/vizier). The original description of the VizieR service was published in Ochsenbein et al. (2000). This research has used data, tools or materials developed as part of the EXPLORE project that has received funding from the European Union’s Horizon 2020 research and innovation programme under grant agreement No 101004214. This work made use of Astropy (http://www.astropy.org): a community-developed core Python package and an ecosystem of tools and resources for astronomy (Astropy Collaboration 2013, 2018, 2022).
References
- Appenzeller, I., Fricke, K., Fürtig, W., et al. 1998, The Messenger, 94, 1 [NASA ADS] [Google Scholar]
- Arnaud, K. A. 1996, ASP Conf. Ser., 101, 17 [Google Scholar]
- Astropy Collaboration (Robitaille, T. P., et al.) 2013, A&A, 558, A33 [NASA ADS] [CrossRef] [EDP Sciences] [Google Scholar]
- Astropy Collaboration (Price-Whelan, A. M., et al.) 2018, AJ, 156, 123 [Google Scholar]
- Astropy Collaboration (Price-Whelan, A. M., et al.) 2022, ApJ, 935, 167 [NASA ADS] [CrossRef] [Google Scholar]
- Baluev, R. V. 2008, MNRAS, 385, 1279 [Google Scholar]
- Becker, W. 2009, Astrophys. Space Sci. Libr., 357, 91 [NASA ADS] [CrossRef] [Google Scholar]
- Bertin, E., & Arnouts, S. 1996, A&AS, 117, 393 [NASA ADS] [CrossRef] [EDP Sciences] [Google Scholar]
- Borghese, A., Rea, N., Coti Zelati, F., et al. 2017, MNRAS, 468, 2975 [NASA ADS] [CrossRef] [Google Scholar]
- Buchner, J. 2021, J. Open Source Softw., 6, 3001 [CrossRef] [Google Scholar]
- Buchner, J., Georgakakis, A., Nandra, K., et al. 2014, A&A, 564, A125 [NASA ADS] [CrossRef] [EDP Sciences] [Google Scholar]
- Caleb, M., Heywood, I., Rajwade, K., et al. 2022, Nat. Astron., 6, 828 [NASA ADS] [CrossRef] [Google Scholar]
- Cardelli, J. A., Clayton, G. C., & Mathis, J. S. 1989, ApJ, 345, 245 [Google Scholar]
- De Grandis, D., Rigoselli, M., Mereghetti, S., et al. 2022, MNRAS, 516, 4932 [NASA ADS] [CrossRef] [Google Scholar]
- Dessert, C., Foster, J. W., & Safdi, B. R. 2020, ApJ, 904, 42 [Google Scholar]
- Enoto, T., Kisaka, S., & Shibata, S. 2019, Rep. Prog. Phys., 82, 106901 [NASA ADS] [CrossRef] [Google Scholar]
- Freudling, W., Romaniello, M., Bramich, D. M., et al. 2013, A&A, 559, A96 [NASA ADS] [CrossRef] [EDP Sciences] [Google Scholar]
- Gendreau, K. C., Arzoumanian, Z., Adkins, P. W., et al. 2016, SPIE Conf. Ser., 9905, 99051H [NASA ADS] [Google Scholar]
- Gregory, P. C., & Loredo, T. J. 1996, ApJ, 473, 1059 [NASA ADS] [CrossRef] [Google Scholar]
- Grünwald, G., Boller, T., Rakshit, S., et al. 2023, A&A, 669, A37 [NASA ADS] [CrossRef] [EDP Sciences] [Google Scholar]
- Güver, T., & Özel, F. 2009, MNRAS, 400, 2050 [Google Scholar]
- Haberl, F. 2007, Ap&SS, 308, 181 [NASA ADS] [CrossRef] [Google Scholar]
- Haberl, F., Motch, C., Zavlin, V. E., et al. 2004, A&A, 424, 635 [NASA ADS] [CrossRef] [EDP Sciences] [Google Scholar]
- Hambaryan, V., Neuhäuser, R., Haberl, F., Hohle, M. M., & Schwope, A. D. 2009, A&A, 497, L9 [NASA ADS] [CrossRef] [EDP Sciences] [Google Scholar]
- Hambaryan, V., Suleimanov, V., Haberl, F., et al. 2017, A&A, 601, A108 [NASA ADS] [CrossRef] [EDP Sciences] [Google Scholar]
- Han, J. L., Wang, C., Wang, P. F., et al. 2021, Res. Astron. Astrophys., 21, 107 [CrossRef] [Google Scholar]
- HI4PI Collaboration (Ben Bekhti, N., et al.) 2016, A&A, 594, A116 [NASA ADS] [CrossRef] [EDP Sciences] [Google Scholar]
- Hohle, M. M., Haberl, F., Vink, J., de Vries, C. P., & Neuhäuser, R. 2012, MNRAS, 419, 1525 [CrossRef] [Google Scholar]
- Hurley-Walker, N., Zhang, X., Bahramian, A., et al. 2022, Nature, 601, 526 [NASA ADS] [CrossRef] [Google Scholar]
- Jansen, F., Lumb, D., Altieri, B., et al. 2001, A&A, 365, L1 [NASA ADS] [CrossRef] [EDP Sciences] [Google Scholar]
- Keane, E. F., & Kramer, M. 2008, MNRAS, 391, 2009 [Google Scholar]
- Kondratiev, V. I., McLaughlin, M. A., Lorimer, D. R., et al. 2009, ApJ, 702, 692 [NASA ADS] [CrossRef] [Google Scholar]
- Kurpas, J., Schwope, A. D., Pires, A. M., Haberl, F., & Buckley, D. A. H. 2023, A&A, 674, A155 [NASA ADS] [CrossRef] [EDP Sciences] [Google Scholar]
- Lallement, R., Vergely, J. L., Babusiaux, C., & Cox, N. L. J. 2022, A&A, 661, A147 [NASA ADS] [CrossRef] [EDP Sciences] [Google Scholar]
- Lang, D., Hogg, D. W., Mierle, K., Blanton, M., & Roweis, S. 2010, AJ, 139, 1782 [Google Scholar]
- Lasker, B. M., Lattanzi, M. G., McLean, B. J., et al. 2008, AJ, 136, 735 [Google Scholar]
- Lomb, N. R. 1976, Ap&SS, 39, 447 [Google Scholar]
- Manchester, R. N., Hobbs, G. B., Teoh, A., & Hobbs, M. 2005, AJ, 129, 1993 [Google Scholar]
- Mori, K., & Ho, W. C. G. 2007, MNRAS, 377, 905 [NASA ADS] [CrossRef] [Google Scholar]
- Motch, C., Pires, A. M., Haberl, F., Schwope, A., & Zavlin, V. E. 2009, A&A, 497, 423 [NASA ADS] [CrossRef] [EDP Sciences] [Google Scholar]
- Ng, C. Y., & Kaspi, V. M. 2011, AIP Conf. Ser., 1379, 60 [Google Scholar]
- Ochsenbein, F., Bauer, P., & Marcout, J., 2000, A&AS, 143, 23 [NASA ADS] [CrossRef] [EDP Sciences] [Google Scholar]
- Olausen, S. A., Zhu, W. W., Vogel, J. K., et al. 2013, ApJ, 764, 1 [Google Scholar]
- Ostriker, J. P., & Gunn, J. E. 1969, ApJ, 157, 1395 [Google Scholar]
- Pavlov, G. G., & Bezchastnov, V. G. 2005, ApJ, 635, L61 [NASA ADS] [CrossRef] [Google Scholar]
- Pavlov, G. G., Shibanov, Y. A., Zavlin, V. E., & Meyer, R. D. 1995, NATO Adv. Study Inst. (ASI) Ser. C, 450, 71 [NASA ADS] [Google Scholar]
- Pavlov, G. G., Zavlin, V. E., Truemper, J., & Neuhaeuser, R. 1996, ApJ, 472, L33 [NASA ADS] [CrossRef] [Google Scholar]
- Pires, A. M., Motch, C., & Janot-Pacheco, E. 2009, A&A, 504, 185 [NASA ADS] [CrossRef] [EDP Sciences] [Google Scholar]
- Pires, A. M., Motch, C., Kurpas, J., et al. 2022, A&A, 666, A148 [NASA ADS] [CrossRef] [EDP Sciences] [Google Scholar]
- Posselt, B., Popov, S. B., Haberl, F., et al. 2007, Ap&SS, 308, 171 [NASA ADS] [CrossRef] [Google Scholar]
- Possenti, A., Cerutti, R., Colpi, M., & Mereghetti, S. 2002, A&A, 387, 993 [NASA ADS] [CrossRef] [EDP Sciences] [Google Scholar]
- Potekhin, A. Y., Zyuzin, D. A., Yakovlev, D. G., Beznogov, M. V., & Shibanov, Y. A. 2020, MNRAS, 496, 5052 [NASA ADS] [CrossRef] [Google Scholar]
- Predehl, P., Andritschke, R., Arefiev, V., et al. 2021, A&A, 647, A1 [EDP Sciences] [Google Scholar]
- Rigoselli, M., Mereghetti, S., & Tresoldi, C. 2022, MNRAS, 509, 1217 [Google Scholar]
- Rutledge, R. E., Fox, D. B., & Shevchuk, A. H. 2008, ApJ, 672, 1137 [NASA ADS] [CrossRef] [Google Scholar]
- Scargle, J. D. 1982, ApJ, 263, 835 [Google Scholar]
- Schwope, A. D., Hambaryan, V., Haberl, F., & Motch, C. 2005, A&A, 441, 597 [NASA ADS] [CrossRef] [EDP Sciences] [Google Scholar]
- Schwope, A., Pires, A. M., Kurpas, J., et al. 2022, A&A, 661, A41 [NASA ADS] [CrossRef] [EDP Sciences] [Google Scholar]
- Staubert, R., Trümper, J., Kendziorra, E., et al. 2019, A&A, 622, A61 [NASA ADS] [CrossRef] [EDP Sciences] [Google Scholar]
- Tan, C. M., Bassa, C. G., Cooper, S., et al. 2018, ApJ, 866, 54 [NASA ADS] [CrossRef] [Google Scholar]
- Tiengo, A., Esposito, P., Mereghetti, S., et al. 2013, Nature, 500, 312 [CrossRef] [Google Scholar]
- Turolla, R. 2009, Astrophys. Space Sci. Libr., 357, 141 [NASA ADS] [CrossRef] [Google Scholar]
- van Kerkwijk, M. H., & Kaplan, D. L. 2007, Ap&SS, 308, 191 [NASA ADS] [CrossRef] [Google Scholar]
- Viganò, D., Perna, R., Rea, N., & Pons, J. A. 2014, MNRAS, 443, 31 [CrossRef] [Google Scholar]
- Wilms, J., Allen, A., & McCray, R. 2000, ApJ, 542, 914 [Google Scholar]
- Yoneyama, T., Hayashida, K., Nakajima, H., Inoue, S., & Tsunemi, H. 2017, PASJ, 69, 50 [NASA ADS] [CrossRef] [Google Scholar]
- Yoneyama, T., Hayashida, K., Nakajima, H., & Matsumoto, H. 2019, PASJ, 71, 17 [NASA ADS] [CrossRef] [Google Scholar]
- Zavlin, V. E., Pavlov, G. G., & Shibanov, Y. A. 1996, A&A, 315, 141 [NASA ADS] [Google Scholar]
- Zavlin, V. E., Pavlov, G. G., Sanwal, D., & Trümper, J. 2000, ApJ, 540, L25 [Google Scholar]
All Tables
All Figures
|
Fig. 1. RGB XMM-Newton EPIC image. Red indicates counts in the 0.2–1 keV band, green in the 1–2 keV band, and blue in the 2–12 keV band. The source and background regions used in the EPIC-pn analysis are marked by the green circle and box. The X-ray sources we used to correct the X-ray sky position of J1317 are marked by cyan circles. |
| In the text | |
|
Fig. 2. NICER Lomb-Scargle periodogram. The green lines indicate the Lomb-Scargle power, which equals a significance of 1–8σ (from bottom to top). |
| In the text | |
|
Fig. 3. Phase-folded light curves showing the pulse profile of J1317 in the 0.3–2 keV (NICER) and 0.2–2 keV (XMM-Newton) energy band. Two cycles are shown for visual purposes. |
| In the text | |
|
Fig. 4. Dependence of the pulse profile as a function of energy and phase. The number of detected photons in EPIC-pn, normalised by the median value derived from the sum of all photons that were detected in a certain energy bin column, is colour-coded. At the top, we indicate the pulsed fraction, determined from events in a certain energy bin, whereas to the right, we plot the normalised light curves in the energy bands 0.2–0.4 keV (blue), 0.4–0.8 keV (orange), and 0.8–2 keV (green). They were computed by summing up all events in a certain phase bin and energy range and normalising again by the median number of counts in the given energy range and all phase bins. |
| In the text | |
|
Fig. 5. EPIC-pn spectrum in the energy range 0.2–2 keV. We indicate the best model and residuals for a single absorbed BB model (red), an absorbed BB with a single absorption component (blue), and an absorbed BB with two absorption components (green). |
| In the text | |
|
Fig. 6. FORS2 R_SPECIAL-band image of the field of J1317. The circles indicate the 1σ positional uncertainty estimated from XMM-Newton (green) and eROSITA (blue). We searched for possible counterparts using the SExtractor software. The identified field objects are marked in brown (circles have arbitrary radii of 1″). |
| In the text | |
|
Fig. 7. X-ray-to-optical flux ratios of several classes of X-ray emitters as a function of hardness ratio (see Kurpas et al. 2023, for details). The updated position of the target is denoted by the lower limit in black and is compared to those of the five XDINSs on the German eROSITA footprint (western hemisphere from the Galactic centre; magenta data points). |
| In the text | |
|
Fig. 8. Spin vs. spin-down diagram presenting the spin properties of the known isolated neutron star population. In the background, we plot all the objects collected in the ATNF pulsar database (Version 1.70; Manchester et al. 2005). The period of J1317 is marked by the vertical green line. The horizontal magenta line indicates the upper 3σ spin-down limit derived from the XMM-Newton and NICER observations. |
| In the text | |
|
Fig. 9. X-ray luminosity as a function of spin-down luminosity for the collection of thermally emitting isolated neutron stars from Potekhin et al. (2020). The luminosity limits inferred for J1317 are shown in green (for a distance of 185 pc) and black (for a distance of 1 kpc). The grey box indicates the parameter space constrained by the current data, assuming distances within 0.1–1 kpc and the spin-down limit from the timing analysis Ṗ ≤ 8 × 10⁻¹¹ s s−1(3σ). The dashed black line indicates where both luminosities are equal in value. |
| In the text | |
Current usage metrics show cumulative count of Article Views (full-text article views including HTML views, PDF and ePub downloads, according to the available data) and Abstracts Views on Vision4Press platform.
Data correspond to usage on the plateform after 2015. The current usage metrics is available 48-96 hours after online publication and is updated daily on week days.
Initial download of the metrics may take a while.