Fig. 4.
Download original image
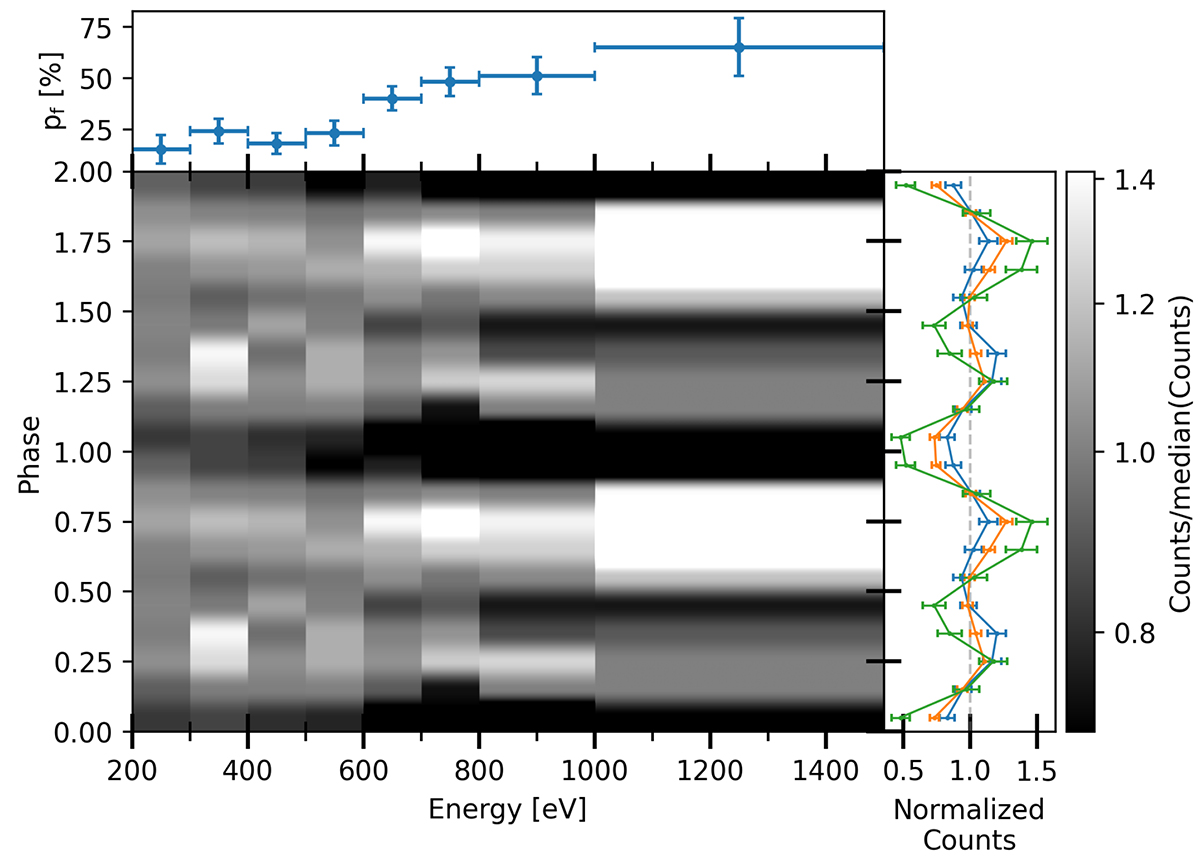
Dependence of the pulse profile as a function of energy and phase. The number of detected photons in EPIC-pn, normalised by the median value derived from the sum of all photons that were detected in a certain energy bin column, is colour-coded. At the top, we indicate the pulsed fraction, determined from events in a certain energy bin, whereas to the right, we plot the normalised light curves in the energy bands 0.2–0.4 keV (blue), 0.4–0.8 keV (orange), and 0.8–2 keV (green). They were computed by summing up all events in a certain phase bin and energy range and normalising again by the median number of counts in the given energy range and all phase bins.
Current usage metrics show cumulative count of Article Views (full-text article views including HTML views, PDF and ePub downloads, according to the available data) and Abstracts Views on Vision4Press platform.
Data correspond to usage on the plateform after 2015. The current usage metrics is available 48-96 hours after online publication and is updated daily on week days.
Initial download of the metrics may take a while.