| Issue |
A&A
Volume 687, July 2024
|
|
|---|---|---|
| Article Number | A251 | |
| Number of page(s) | 13 | |
| Section | Stellar structure and evolution | |
| DOI | https://doi.org/10.1051/0004-6361/202450248 | |
| Published online | 18 July 2024 | |
Thermally emitting isolated neutron star candidates from the SRG/eROSITA All-Sky Survey
1
Leibniz-Institut für Astrophysik Potsdam (AIP), An der Sternwarte 16, 14482 Potsdam, Germany
e-mail: jkurpas@aip.de
2
Potsdam University, Institute for Physics and Astronomy, Karl-Liebknecht-Straße 24/25, 14476 Potsdam, Germany
3
Center for Lunar and Planetary Sciences, Institute of Geochemistry, Chinese Academy of Sciences, 99 West Lincheng Rd., 550051, Guiyang, PR China
4
Max-Planck-Institut für extraterrestrische Physik, Giessenbachstraße 1, 85748 Garching, Germany
Received:
5
April
2024
Accepted:
13
May
2024
The SRG/eROSITA All-Sky Survey (eRASS) allows for the creation of a complete sample of X-ray dim isolated neutron stars (XDINSs), which will significantly facilitate the study of their population properties, evolution, and connection to other families of isolated neutron stars (INSs). In this work, we conduct a systematic search for XDINSs on the eROSITA western Galactic hemisphere down to an X-ray flux limit of 10−13 erg s−1 cm−2 and discuss the resulting candidate sample. Consistently with the properties of the known XDINSs, we selected all eRASS sources possessing a soft X-ray spectral distribution and that are unlikely to be associated with optical or infrared sources. Our selection criteria allowed us to recover all known XDINSs and previously proposed candidates. In addition, we put forward 33 new candidate members for dedicated follow-up identification campaigns. We found the resulting candidate sample to be about 30–50% complete, mainly due to source confusion and the stringent cross-matching criteria adopted to select the most promising candidates for immediate follow-up investigation. The candidates of the sample presented here can be broadly divided into two groups: 13 rather soft and 20 hot and somewhat hard X-ray emitters. Interestingly, the remarkably thermal nature of the candidates in the first group as well as their spatial distribution, lack of known counterparts, and absence of significant flux variability agree well with the properties of other confirmed thermally emitting INSs. For the candidates in the second group, the current observational data do not allow one to discern between rotation-powered or recycled pulsars, cataclysmic variables, or quiescent neutron stars in binary systems or even to rule out an extragalactic nature. On the basis of population synthesis and the estimated source completeness of the search, we expect that between one and three new XDINSs are among the already singled-out list of XDINS candidates – a long-sought increase in the proposed number of members of this elusive class of X-ray emitters.
Key words: stars: neutron / pulsars: general
© The Authors 2024
 Open Access article, published by EDP Sciences, under the terms of the Creative Commons Attribution License (https://creativecommons.org/licenses/by/4.0), which permits unrestricted use, distribution, and reproduction in any medium, provided the original work is properly cited.
This article is published in open access under the Subscribe to Open model. Subscribe to A&A to support open access publication.
1. Introduction
Thermal emission originating from the surface of isolated neutron stars (INSs) has been observed for a broad range of different INS types. However, the total number of INSs for which thermal emission has been detected is still low with respect to the overall known population (e.g., Potekhin et al. 2020). Studying the thermal emission of INSs allows for investigation into the physical state of the matter, composition, and emission processes of the neutron star atmosphere (e.g., Zavlin & Pavlov 2002); calibration of evolutionary models and cooling curves (e.g., De Grandis et al. 2021); and estimation of the neutron star radius, a requirement to constrain the equation of state of cold nuclear matter (e.g., Özel & Freire 2016). Thus, the identification of new thermally emitting INSs is of very high interest.
The cleanest thermal INS spectra that can be observed are those from the class of X-ray dim isolated neutron stars (XDINSs; Turolla 2009). In comparison to most other INS types (see e.g., Popov 2023, and references therein), these objects possess long spin periods (3–17 s), comparably strong magnetic fields (1013 − 1014 G), and thermal luminosities that exceed the observed loss of rotational energy, which suggest an evolution governed by the magnetic field and a possible connection with magnetars (Viganò et al. 2013). Evidence for the presence of non-thermal emission components has only recently been discovered in the stacked X-ray spectra of some of the XDINSs (Yoneyama et al. 2017, 2019; Dessert et al. 2020; De Grandis et al. 2022). The absence of supernova remnants, pulsar wind nebulae, and coherent pulsed radio and gamma-ray emission as well as faint counterparts at optical or ultraviolet wavelengths make XDINSs particularly difficult to detect. The seven known XDINSs were originally identified from observations at soft X-ray energies with the Roentgen Satellit (ROSAT; Haberl 2007), where thermal emission is most prevalent. The seven XDINSs are all X-ray bright (implying large X-ray-to-optical flux ratios of log(fX/fopt) ≳ 4; Haberl 2004; Kaplan 2008), lowly absorbed, and situated in the immediate solar vicinity (< 1 kpc; see Motch et al. 2009, and references therein), which implies a local birthrate that is akin to that of the much more numerous class of rotation-powered pulsars (RPPs; Becker 2009). As such, XDINSs may constitute a substantial part of the Galactic INS population (Keane & Kramer 2008). Since their initial discovery in the 1990s, several efforts to identify new members have been carried out by making use of large serendipitous datasets from pointed X-ray observations (Pires et al. 2009, 2022; Rigoselli et al. 2022) or searches in the data of the ROSAT All-Sky Survey (Rutledge et al. 2008; Agüeros et al. 2011; Demasi et al. 2024). These campaigns have led to a growing list of previously unknown soft X-ray emitters and INS candidates, though an XDINS nature is yet to be established for them.
From December 2019 to February 2022, the extended Roentgen Survey with an Imaging Telescope Array (eROSITA) instrument aboard the Spectrum Roentgen Gamma (SRG) mission conducted 4.3 entire scans of the sky in the X-ray band (between 200 eV and 8 keV) as part of the eROSITA All-Sky Survey (eRASS; Predehl et al. 2021; Merloni et al. 2024). In comparison to its predecessor, the ROSAT All-Sky Survey (Voges et al. 1999; Boller et al. 2016), eROSITA offers a much improved sensitivity at soft X-ray energies (Merloni et al. 2024) and better positional accuracy. Given the large sky coverage, eRASS is well suited to search for new thermally emitting INSs, in particular fainter XDINSs (Pires et al. 2017; Khokhryakova et al. 2021). We searched the eRASS source catalogues (see Merloni et al. 2024) to identify suitable INS candidates and initiated a dedicated follow-up campaign at X-ray and optical energies to confirm their nature. The overall properties of the first two proposed candidates, eRASSU J065715.3+260428 and eRASSU J131716.9–402647, which have been singled out on the basis of extremely high X-ray-to-optical flux ratios, predominantly soft and constant X-ray emission, and absence of catalogued counterparts, were presented in Kurpas et al. (2023). Additional observations of eRASSU J131716.9–402647 unveiling the spin period of the neutron star and the presence of possible spectral absorption lines, suggest that the properties of the X-ray source are remarkably similar to those of a highly magnetised INS, an XDINS, or a high magnetic field pulsar (Kurpas et al. 2024).
In this work, we present a detailed account of our search procedure and the overall properties of the resulting sample of INS candidates. The results of still on-going follow-up identification campaigns will be presented elsewhere. In Sect. 2, we start by outlining the selection criteria, then proceed to present the reduction steps involved in the analysis of the eROSITA data and how the optical and infrared (IR) magnitude limits were derived. In Sect. 3, we estimate the completeness and false-deselection rate of our search, compare the selection to previous searches, and present the results of the spectral analysis, the inferred X-ray variability, and the current X-ray-to-optical flux ratios of our sample of candidates. In Sect. 4, we discuss the properties of the identified candidates in the context of the known population of INSs, particularly the class of XDINSs. Our conclusions and outlook to further improve future searches, especially based on eROSITA data, are presented in Sect. 5.
2. Data reduction
2.1. Candidate selection
The eROSITA instrument has conducted four complete sky surveys and initiated the fifth. Therefore, for each sky location and detected X-ray source, X-ray information from four or five epochs, roughly obtained six months apart, are available. To identify INS candidates, we followed the procedure briefly outlined in Kurpas et al. (2023). An overview of all applied cuts and the remaining number of candidates is given in Table 1. The starting point of the candidate selection is a stacked eROSITA source catalogue1 containing sources that were detected using all the available observations. We required well detected and point-like sources (detection likelihood > 10 at energies 0.2–2.3 keV and extend = 0″) and that are brighter than a limiting flux of 10−13 erg s−1 cm−2 (within 1σ; 0.2–2 keV). This results in an input sample of 102, 620 sources. At the chosen flux limit, a follow-up program to confirm or reject the INS nature is feasible with a moderate amount of observing resources. Accordingly, population synthesis models predict about 26 ± 4 INSs to be discovered all-sky at this flux level (Pires et al. 2017).
Applied selection steps.
Based on cuts in hardness ratio (“X-ray colour”) space, we only considered eRASS sources with an X-ray spectrum consistent with that of XDINSs, within 1σ. More specifically, the hardness ratio compares the number of counts in two neighboring X-ray energy bands, e.g.,  , for bands 1 and 2. In the case of the eRASS catalogues, these were defined for energy bands 0.2–0.5 keV, 0.5–1 keV, 1–2 keV, and 2–5 keV. In order to identify the parameter space in hardness ratio where thermally emitting INSs are located, we expect their spectra to follow an absorbed blackbody continuum. As such, we used the latest eROSITA response files and the XSPEC (version 12.12.0; Arnaud 1996) fakeit command to simulate absorbed blackbody models with temperature and hydrogen column density ranges of 30–250 eV and 0–1023 cm−2, respectively (see the diagrams in Fig. 1). The adopted range in temperature includes that of the observed XDINSs (40 – 100 eV; Turolla 2009), while leaving sufficient margin to select also younger and possibly hotter members of this class. Based on the simulation results, we defined cuts in the hardness ratio spaces HR1 × HR2 and HR2 × HR3 (black dashed lines in Fig. 1). Their application results in a sample of ∼27 670 sources.
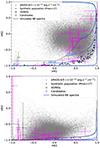 |
Fig. 1. Hardness ratio plots presenting the hardness ratio distribution for all the selected candidates (magenta), the five confirmed XDINSs on the western Galactic hemisphere and recently proposed candidates (green; Pires et al. 2015, 2022), and the synthetic INS population from (black; Pires et al. 2017). The applied cut to select the soft X-ray emitting candidates from all the eROSITA sources above the applied flux limit (grey) is indicated by the black dashed line and is based on simulated black body spectra of varying temperature and absorption strengths (blue lines). (See the text for additional information on these simulations.) |
The third selection cut in Table 1 is motivated by the large X-ray-to-optical flux ratio values that are observed for the known XDINSs. This property alone separates INSs from any other soft X-ray emitter and can be used to confirm the INS nature, but also to efficiently pinpoint promising candidates for follow-up investigations. Given the flux level of our list of INS candidates (∼(1 − 5)×10−13 erg s−1 cm−2), their expected optical and IR emission would be too faint (e.g., mV > 27 mag under the assumption of log(fX/fopt) ≳ 4 that is observed for the known population; Haberl 2004; Kaplan 2008) to be detected in most wide-area photometric catalogues. Thus, we cross-correlated the eROSITA source positions against those of optical and IR objects present in Gaia DR3 (Gaia Collaboration 2023), Legacy Survey DR10 (Dey et al. 2019), Pan-STARRS DR1 (Chambers et al. 2016), DeCAPS2 (Saydjari et al. 2023), VISTA Hemisphere Survey (McMahon et al. 2013), unWISE (Schlafly et al. 2019), and CatWISE2020 (Marocco et al. 2021), adopting the multi-catalogue probabilistic method implemented in the ARCHES tool (Pineau et al. 2017). The ARCHES tool computes individual probabilities for all possible combinations of X-ray, optical and IR sources, based on their angular distance, local distribution, and positional accuracy. To discard X-ray sources with likely optical and IR counterparts, we defined the probability that the X-ray source has no counterpart at all (hereafter the non-matching probability) as the lowest likelihood value of non-association among all the individual matching combinations computed by ARCHES. We then retained the 554 X-ray sources with non-matching probabilities above a threshold value of 50%.
We finally screened the remaining sources to exclude spurious candidates. First, we required overall long-term flux stability between eROSITA visits. In practice, we excluded transient sources that were not individually detected in all the single eRASS scans2 since the eRASS is expected to be generally complete at the applied flux limit (the completeness at a given flux and exposure time is exemplarily shown for the first eROSITA sky scan in Fig. 10 of Merloni et al. 2024). Similarly, we found that some remaining sources showed a large spread between the single eRASS scan positions, to a degree that it was difficult to still associate these single eRASS scan positions with the detection in the stacked catalogue. Many of these objects were located in regions with increased X-ray sky background, like supernova remnants, making them more likely to be spurious detections and not real astronomical point sources. For a clean selection we discarded these sources as well. Finally, we found that the remaining sample still contained eRASS sources that can be associated with optically very bright counterparts (e.g., nearby stars with magnitudes ≲14 mag) that were also consequently removed. While the ARCHES cross-match should have originally associated these objects with their optical counterparts, all these sources possess very accurate optical source positions and a significant displacement of the eRASS sky position. This led to spuriously large non-matching probabilities. We included the proper motion into the ARCHES match such that an intrinsic shift in the sky position should not be the cause of the observed displacement. We conclude that for eROSITA sources in the vicinity of an optically bright object larger systematic uncertainties may need to be considered. The screening left us with a candidate sample of 41 sources. The published version of the eRASS1 source catalogue contains flags (see Merloni et al. 2024), marking objects that could be spurious or potentially affected by optical loading. We verified that none of the remaining targets are flagged in any way.
We used the SIMBAD database (Wenger et al. 2000) and the ATNF pulsar catalogue (Version 2.0; Manchester et al. 2005) to identify already known neutron stars in the selected sample. In total, we found the sample to include eight archival neutron stars. These were the five known XDINSs in the western Galactic hemisphere, the two proposed XDINS candidates 2XMM J104608.7–594306 (Pires et al. 2015) and 4XMM J022141.5–735632 (Rigoselli et al. 2022; Pires et al. 2022) and the RPP PSR B0656+14, which also emits strong thermal radiation at soft X-ray energies (e.g., Schwope et al. 2022). This left us with 33 previously unknown sources that have survived the selection. We list the X-ray sky position, Galactic latitude, angular distance to the next optical or IR source, probability of non-association, hardness ratios, and eROSITA exposure times of this sample in Table 2.
Properties of the selected candidates.
2.2. eROSITA data reduction
The eRASS is conducted with the eROSITA instrument aboard the SRG mission (Predehl et al. 2021). This instrument contains seven individual Wolter-I X-ray telescopes (dubbed TM1, TM2, ..., TM7; together forming a virtual telescope TM0) that simultaneously observe the sky. While the selection of XDINS candidates was done using the standardised pipeline-processed source catalogues (Brunner et al. 2022), directly studying the individual eROSITA spectra of the 33 selected candidates allowed for better characterisation of the sources. We retrieved the event lists corresponding to each of the 33 XDINS candidates’ sky tiles in all available eRASS scans and analysed the events with the eROSITA Science Analysis Software System (eSASS; user version 211214.0.5; Brunner et al. 2022). The event lists, with photons from all telescope modules (TM0), were processed with the latest pipeline version c020.
For the spectral analysis, we adopted a region of interest of 15′ around the position of each candidate and considered all valid photon patterns with good quality flags (PATTERN ≤ 15 and FLAG=0xE000F0003). Periods of high background were excluded by constructing updated good-time-interval (GTI) lists with the flaregti task. The remaining total net exposures and counts are presented in Table 2 for all the sources. We then followed (Brunner et al. 2022) to perform source detection in the 0.2–2.3 keV band to locate the target and nearby field sources. The srctool task was then applied to produce optimised source and background regions based on the results of the source detection (see Fig. 2 for an example) and to extract the source and background spectra. The spectra were then grouped requiring at least one count per spectral bin with the FTOOLS task grppha (version: 3.1.0; Blackburn 1995).
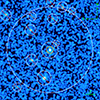 |
Fig. 2. eROSITA image of the field of J13472. The source extraction region is indicated by the orange circle, whereas the background region annulus and excluded field sources are marked by white circles. |
2.3. Estimation of the optical magnitude limits
We computed the local optical detection limit in the field of each XDINS candidate by collecting the magnitude values of all optical objects catalogued in the Gaia DR3, Pan-STARRS DR1, Legacy Survey DR10 and DeCAPS2 surveys within a search radius of 5′. The limiting magnitude was then defined as the value where the count number of optical objects in the distribution of magnitude values has decreased to half of the maximum of the histogram. For improved accuracy, for each field and available catalogue we used the splrep function, built into the scipy python package (Virtanen et al. 2020), to interpolate between the discrete histogram bins of the distribution. This approach is exemplarily presented in Fig. 3 for the candidate J13472 (in the following, we will refer to individual candidates based on the first five digits of their position). The computed magnitude limits are noted for each candidate in Table 2.
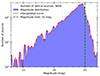 |
Fig. 3. Magnitude distribution of Legacy Survey DR10 sources in a 5′ radius around the candidate J13472. The distribution was interpolated with a B-spline (red line), and the resulting local magnitude limit at 25 mag is indicated by the vertical green dashed line. |
3. Results
3.1. Completeness and false-deselection fraction of the candidate selection
In the following, we assess the efficiency of the method at selecting XDINS candidates from the eRASS catalogues based on the completeness and reliability of the sample. The long-term goal of this project is to enable the creation of a complete flux-limited sample of well-characterised XDINSs that will improve studies of their population properties and evolution. For this reason, the applied cut in X-ray flux at a limit of 10−13 erg s−1 cm−2 is justified since the inclusion of fainter sources in the envisaged sample is made difficult by the amount of needed follow-up to fully characterise their nature. Considering 50 simulations of the population synthesis model described in Pires et al. (2017), the applied flux cut would keep (46 ± 13)% of the population expected to be in the eRASS catalogue version that we analysed4.
In principle, the applied hardness-ratio cuts could deselect good candidates. To prevent this, the cut was designed to be conservative by allowing for a much wider temperature (up to 250 eV) and hydrogen column density (up to 1023 cm−2) range than is actually observed in the known XDINS population (kT ∼ 40 − 100 eV and NH < 1021 cm−2). Indeed, a comparison of these cuts with the simulated population of INSs in Pires et al. (2017) shows that we select all of them (see black dots in Fig. 1). Consequently, we expect that no good candidates were lost.
The selection step that is most prone to removing good candidates is the cross-matching of the eROSITA and archival optical or IR imaging catalogues. For an X-ray survey mission, eROSITA has unprecedentedly good positional accuracy (the 95% 1σ positional error percentile is located at 2.6″, estimated from all soft sources surviving the hardness ratio cuts). However, a neutron star can erroneously be removed just by being located angularly close to an optical or IR source on the sky. Source confusion is expected to worsen in crowded sky regions, such as at low Galactic latitudes, due to the increased chance of assigning a spurious identification to a given X-ray source.
To study the chance of spurious identifications, we assessed the false-deselection rate of INS candidates by describing how likely just by positional coincidence an eRASS source would have matched with an optical or IR counterpart. To estimate this rate, we shifted the eROSITA positions of all 27 670 sources that survived the hardness ratio cut by 1′ to the north-east and repeated the ARCHES cross-matching with all optical and IR catalogues. We show the resulting cumulative distribution of non-matching probabilities (blue) in Fig. 4. As it can be seen, at the arbitrarily chosen threshold of 50% non-matching probability, about 39% of the shifted sources were erroneously associated with an optical or IR counterpart (as marked by the blue dashed lines), indicating a false-deselection rate of this magnitude. Figure 5 presents the dependence of the false-deselection rate with Galactic position. The Galactic plane, where deep DeCAPS2 imaging is available, can be clearly identified, given the comparatively large number of erroneously matched objects. Quantitatively, at |b|< 15° the false-deselection rate is 46%. Contrarily at |b|> 15°, the false-deselection fraction decreases to 34%.
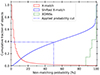 |
Fig. 4. Distribution of non-matching probabilities in the cross-match used for the candidate selection (red), a cross-match with artificially shifted positions (blue), and for the known XDINSs (green dashed) that comprise the five ROSATdetected sources on the western Galactic hemisphere and the proposed candidates 4XMM J022141.5–735632 (Rigoselli et al. 2022; Pires et al. 2022) and 2XMM J104608.7–594306 (Pires et al. 2015). |
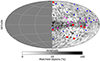 |
Fig. 5. Galactic view of the false-deselection rate sky distribution. We show the location of the 13 softer (magenta) and the 20 harder (blue) candidates. The known XDINSs (same sources as in Fig. 4) are indicated in red. |
Lower false-deselection rates can be achieved by decreasing the applied non-matching probability threshold. Doing so will, on the other hand, heavily increase the number of remaining objects. This can be seen from Fig. 4 where the non-matching probability distribution of the cross-matching based on the original eRASS positions (red line) is also presented. At the current cut of 50% non-matching probability, we retain 554 sources (∼2% of the input sample). If one would attempt to decrease the false-deselection rate to 20% all-sky, a non-matching probability threshold of 20% would need to be applied (see blue line in Fig. 4). However, this threshold would retain 1542 sources, an increase by a factor > 2.7.
To further estimate how strongly source confusion may affect the selection of candidates in our sample, we also studied the effectiveness to select already known XDINSs and proposed candidates. In this regard, the selection was very successful since all the five known XDINSs on the western Galactic hemisphere were recovered. Comparing the selection to previous INS searches, we also singled out the INSs 2XMM J104608.7–594306 (95% non-matching probability; Pires et al. 2015) and 4XMM J022141.5–735632 (93% non-matching probability; Rigoselli et al. 2022; Pires et al. 2022). That all of these sources survive the cross-match is also shown in Fig. 4. Other than the INS 4XMM J022141.5–735632 confirmed by Pires et al. (2022), the other three candidates proposed by Rigoselli et al. (2022) in the XMM-Newton 4XMM-DR10 footprint, 4XMM J031722.7–663704, 4XMM J175437.8–294149, and 4XMM J180528.2–273158 have not entered our sample because they were either outside the western Galactic hemisphere or were fainter than the applied flux limit. More recently, Demasi et al. (2024) searched the reprocessed version of the ROSAT catalogue (Boller et al. 2016) for possible INS candidates. The resulting candidate list includes 55 objects, among them also two known XDINSs. Seventeen out of these 55 sources are located on the western Galactic hemisphere. Adopting a fixed search radius of 1′, we matched the position of these candidates with the X-ray sources of the stacked eRASS catalogue. We only found possible matches for four of them. Among them, there is the known XDINS RX J1308.6+2127 and three newly proposed candidates: 2RXS J051541.7+010528, 2RXS J092055.5+175526, and 2RXS J101449.9+004101. The candidates 2RXS J092055.5+175526 and 2RXS J101449.9+004101 possess eROSITA flux values below the applied flux limit (∼2 × 10⁻¹⁴ erg s−1 cm−2, 0.2–2 keV), whereas the source 2RXS J051541.7+010528 is bright, ∼2 × 10⁻¹² erg s−1 cm−2 (0.2–2 keV), but with spectral properties incompatible with our cuts in hardness ratio: HR1 = −0.82(3), HR2 = −0.59(8), and HR3 = −0.65(17). For this source, the angular distance between ROSAT and eROSITA is quite large (49″), whereas for the other two sources the ROSAT position matched with eROSITA within 20″. We note that the eROSITA position of 2RXS J051541.7+010528 implies a likely association to the cataclysmic variable (CV) V1309 Ori. We finally conclude that based on the eROSITA measurements of known XDINSs and recently proposed candidates, we were able to select all of them.
3.2. X-ray spectral analysis
3.2.1. Methodology
We analyzed the spectra of all the 33 selected candidates using the Bayesian X-ray Analysis (BXA; Buchner et al. 2014) package connected to XSPEC. Specifically, we modeled the candidate spectra with a single blackbody (BB) or a single power law (PL) component in order to study if the continuum of the source is primarily of thermal or non-thermal nature. To account for the interstellar medium absorption in the line-of-sight, we combined the spectral models with the XSPEC tbabs component, adopting the abundance values of Wilms et al. (2000). This model computes the X-ray absorption cross-sections on-the-fly. For the spectral fits, we allowed for generally broad parameter ranges (e.g., 1018–1024 cm−2 for the hydrogen column density, NH) that contain all the physically acceptable values, and refrained from fixing the model parameters to specific values. We applied uniform priors for parameters that vary within a range spanning less than three decades (e.g., kT or Γ), while log-uniform priors were adopted for the remaining ones (e.g., NH).
The results of all fits are shown in Table 3. In order to assess the best model between a BB or PL, we list the resulting Bayesian evidence (log(Z)), the Bayes factor with respect to the BB model (log(ZBB/Z)), and the value for the Akaike Information Criterion (AIC). Generally, models that possess larger Bayesian evidence or smaller AIC values are to be favoured. To judge the significance of these results, we conducted simulations aiming to constrain the false-positive and false-negative rate that the source spectrum is of thermal nature. In the first case, we simulated 250 spectra based on the best-fit PL result to study how often a similarly well or better fitting BB is observed by chance, although the fitted spectrum is of non-thermal origin. For the second case, we simulated 250 spectra based on the best-fit BB solution to estimate how likely the true BB nature could be rejected based on a better fitting PL model. The results of the simulations are displayed in Table 3. To give an impression on the quality of the eROSITA spectra and the resulting fits, we show the spectrum and subsequent best-fit BB model for J13472 in Fig. 6.
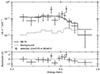 |
Fig. 6. Example eROSITA spectrum and BB fit for the source J13472. For presentation purposes, the spectrum was rebinned. |
eROSITA spectral fit results.
As a consistency test, we included the two XDINS candidates reported in Kurpas et al. (2023), J06571 and J13171 in the spectral analysis. We did not discover any discrepancies in the analysis of either source, indicating that the results presented here are robust. To investigate whether the known light-leak (Predehl et al. 2021) of two of the seven telescope modules of eROSITA might have affected the analysis, we repeated the fits with spectra containing photons only from the affected modules (TM5 and TM7) and with spectra that should be unaffected, by using events from the remaining 5 modules. These fits, albeit less accurate, are in agreement with the results presented in Table 3 based on TM0. We conclude that counting statistics seems to dominate over systematic effects that might arise due to the light leak for all the observed sources or that the observations were generally not affected by stray light.
Based on the fit results presented in Table 3, we distinguish two types of sources in our candidate sample: there are soft X-ray emitters (kT < 150 eV, Γ > 5) and those with slightly harder spectra (kT ≳ 200 eV, Γ ∼ 1 − 4). For these two groups, we will discuss the results of the spectral analysis independently in the following two subsections.
3.2.2. Soft X-ray emitters
We have identified 13 sources that possess BB spectra with effective temperatures < 150 eV. Their spectral properties match well with the known XDINSs (kT ∼ 40 − 100 eV; Haberl 2007). The corresponding PL fits converge to photon indices with values > 5, which is too steep for most astronomical sources contained in the eRASS catalogues. In fact, the only sources that may depict such a soft PL like spectrum are narrow-line Seyfert 1 galaxies (NLS1s; Grünwald et al. 2023). With only one exception, the 13 soft sources possess generally small false-positive rates (< 10%), thus implying with high confidence a thermal nature for these sources. For the only exception of J09042, the best-fit PL model is exceptionally steep (Γ ∼ 13), and the NH is very large. From a physical interpretation of the fit parameters, this makes the PL fit unlikely since there are no astronomical objects that possess such steep PL spectra. This behaviour of the PL fit is often observed for sources where BB models converge to colder effective temperatures. This is also the case for the best-fit BB solution of this source (kT ∼ 100 eV).
The BB fit results of the 13 sources generally agree with a Galactic nature since the estimates on the NH are consistent with values lower than the Galactic value. The only exceptions are J09042, J13171 and J17553, where the NH exceeds the Galactic value by more than 1σ. While this might initially look concerning, these results may not necessarily imply a non-INS nature. At least in the case of J13171, as follow-up observations at X-ray wavelengths have shown (Kurpas et al. 2024), the large NH is likely due to a strong absorption feature at soft energies that alters the shape of the spectral continuum. In this case, a simple BB model can only adequately describe the observed spectrum, if it converges towards a stronger ISM absorption. Larger signal-to-noise ratio spectra are needed to lift this degeneracy. We found the obtained BB emission radius values to be generally consistent with an INS nature for all soft candidates since they would agree with the canonical INS radius of 12 km for distances of 1–15 kpc, depending on the source (the true source distance could also be lower since XDINSs were observed to possess smaller emission region sizes, see e.g., Drake et al. 2002, or if the thermal emission originates from a hot spot only).
3.2.3. Harder X-ray emitters
The remaining 20 candidates possess spectra where BB fits imply effective temperatures ≳200 eV. These might be in agreement with the thermal emission seen in younger INSs (e.g., magnetars; Olausen & Kaspi 2014) or the temperatures of hot spots observed on the surfaces of RPPs (e.g., Potekhin et al. 2020). The PL fits possess photon indices with 1σ confidence ranges from Γ ∼ 1.5 − 5. Discerning the exact source nature based on the eROSITA spectra alone will be more difficult for these sources. This is for the reason that the inferred photon index values are not as unphysical as for most of the softer sources in Sect. 3.2.2. In fact, photon indices of 1–3 are typically observed for the magnetospheric emission of RPPs (Becker 2009) or in many objects that are driven by accretion processes like active galactic nuclei (AGN; e.g., Ishibashi & Courvoisier 2010).
We found false-positive rates (< 10%) that statistically imply a thermal nature only for seven candidates (J05215, J07182, J08071, J08535, J10111, J12215, and J21492). At kT ≳ 200 eV the size of the emission regions are generally below 300 m. Under the assumption of an INS nature, this would either imply that the emission originates from a hot spot on the neutron star surface or that the sources are located much farther away than the assumed 1 kpc. The NH values of the BB fits are also generally in agreement with a Galactic nature. For two sources, temperatures of ∼1100 eV were observed. While the 1σ confidence regions of these temperature values are sufficiently broad to include not as hot INSs, the current limits on the spectral parameters permit a variety of possible source scenarios but do not allow for a conclusive judgement on their exact nature to be made. These sources show hardness ratio values where one would expect cooling INSs to be strongly absorbed, but the spectral fits indicate them to be located relatively nearby due to the possibility of small NH values with respect to the Galactic value. This might place them at odds with an INS nature and may imply that other spectral models than a BB or PL nature are needed to properly describe their emission.
Small false-negative rates (< 10%) that favour the PL fit were obtained for six candidates. These include also the four sources where the Bayes factor is negative and already favours the PL. Interestingly, for half of them (J08070, J11024, J18334) the PL fits converged to low interstellar absorption values (NH ∼ 1020 cm−2) that are below the Galactic limit and thus imply small distances. This could be in agreement with an INS nature (e.g., a RPP). For the remaining three sources (J08525, J09331, J10395) the NH would also allow for an extragalactic origin.
The remaining seven candidates (J06274, J07263, J08303, J10095, J12182, J13082, and J17541) are equally well fitted with both models. For that reason, the nature of the continuum emission cannot currently be constrained. X-ray follow-up observations will be necessary to better characterise these sources. We note that for J07263 and J08303, the BB fits are quite hot (absolute values of kT ≥ 500 eV). While the confidence regions may still agree with an INS nature, the PL fits with Γ ∼ 2 are physically more appealing.
3.3. Short- and long-term variability
The fact that eROSITA repeatedly observed the sources allowed us to search for the presence of long-term variability. This is interesting to investigate since XDINSs are expected to be rather stable X-ray emitters, while other neutron star types (e.g., magnetars) or contaminant sources, such as X-ray binaries (XRBs), CVs, or AGN, would be expected to display significant variation. We computed for each source and each individual survey, the observed count rate in the 0.2–2 keV band, and between all surveys, we calculated the maximum observed rate deviation,
![$$ \begin{aligned} \mathrm{RATE\_VAR}=\underset{k,l \in [1,n]}{\max } \frac{|R_k-R_l|}{\sqrt{\sigma _k^2+\sigma _l^2}}, \end{aligned} $$](/articles/aa/full_html/2024/07/aa50248-24/aa50248-24-eq235.gif)
by analogy with the definition of the FLUXVAR parameter in the XMM-Newton stacked catalogues (e.g., Traulsen et al. 2020). The results are presented in Table 3. Only J08525 was observed to vary by more than 3σ, which might be regarded significant. Variability below the 3σ threshold is also observable for some of the XDINSs on the western Galactic hemisphere. As Pires et al. (2022) argue, these variations in count rate may be attributed to low count statistics. Based on the rate values presented in Appendix B of Pires et al. (2022), we exemplarily estimated a “RATE_VAR” of 2.5σ for RX J0720.4–3125. However, as is the case for all the known XDINSs, RX J0720.4–3125 is observed to be intrinsically stable on long time-scales. It was only observed to show changes in spectral state (Hohle et al. 2012). We thus conclude that most of the selected candidates conform with a stable nature over the course of the eROSITA observations.
Checking for variability beyond the eROSITA surveys is made possible by using the HILIGT tool (Saxton et al. 2022; König et al. 2022) to create long-term light curves. These display either detected flux values in past X-ray observations near the eROSITA position or, in the absence of a detection, a 3σ upper limit. The light curves include detections and upper limit values from XMM-Newton pointed observations (e.g., Webb et al. 2020), the XMM-Newton Slew Survey (Saxton et al. 2008), Swift/XRT (Burrows et al. 2005), and ROSAT PSPC and HRI pointed observations, as well as from the PSPC All-Sky Survey (Pfeffermann et al. 1987; Boller et al. 2016). The HILIGT tool bases its computation on a pre-defined grid of parameter values. As such, for each candidate we individually determined the grid point that is closest to the best-fit solution presented in Table 3. The resulting light curves were then checked for significant variability. We found 11 of our candidates to be detected by ROSAT and three of them to be also detected in the XMM-Newton Slew Survey (J08195, J13171, J17485). In all cases, the archival X-ray flux values were in agreement with eROSITA. The presence of variability was only indirectly observed for three undetected sources (J09331, J10395, and J11024), where archival upper limits were observed that reached below the eROSITA flux values. Such a light curve is presented for J10395 in Fig. 7. Interestingly, all three sources belong to the harder sample and a non-thermal spectral continuum seems more likely. While J08525 might be variable on shorter timescales, its HIGLIGT light curve does not indicate long term variability since the source was never detected in the past and the upper limits from ROSAT and XMM-Newton are generally above the eROSITA flux level.
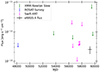 |
Fig. 7. Long-term light curve for the candidate J10395. Upper limits from the XMM-Newton Slew Survey (green), the ROSAT All-Sky survey (blue), and Swift/XRT (magenta) are shown. The stacked eROSITA flux is indicated in black, with the x-axis error depicting the time between the first and last eROSITA observation. |
The overall small number of detected counts that is spread over 4–5 epochs prevents a meaningful timing analysis (see also Sect. 3.2 in Kurpas et al. 2023, for more information). Follow-up observations will be necessary to identify the neutron star spin period, which is essential for deeper insights into the nature of the candidates.
3.4. X-ray-to-optical flux ratios
To study if a non-INS nature can be excluded based on archival optical imaging alone, we used the computed magnitude limits to estimate the X-ray-to-optical flux ratio. To allow for comparison of the limiting magnitudes calculated in different passbands (either Gaia g-band or the r-band used in Legacy Survey, Pan-STARRS or DeCAPS2), we assumed an optical spectrum that is flat in frequency space and normalised to the observed flux density as computed from the observed magnitude limits. The X-ray-to-optical flux ratio can then be computed via  , with FX being the X-ray flux, m the magnitude limit and 5.39 a constant to relate the X-ray-to-optical flux ratio values to the V-band. We applied this relation to all the candidates and present the individual results in Table 2. For the X-ray flux the best-fit BB/PL model value was applied (depending on the estimated false-positive and false-negative rates as described in Sect. 3.2; the BB flux was used for the eight candidates that are equally well fit with a BB or PL continuum).
In Fig. 8 we compare the resulting X-ray-to-optical flux ratio values to those of the most abundant contaminants in our search. We found that an M-star nature can be excluded for all of the candidates; however, the majority of candidates (19 sources) are still located in the upper part of the AGN and CV cloud. Thus, based on X-ray-to-optical flux ratio alone, excluding these non-INS natures is difficult. We want to note that the remaining 14 candidates possess X-ray-to-optical flux ratios in excess of 200. Of these, three sources belong to the soft sample of candidates (J06571, J13171, and J13472). Of the remaining 11 sources, seven possess spectra that were equally or better fitted by a BB model (J05215, J08303, J08535, J10111, J12215, J13082, and J21492). While X-ray-to-optical flux ratios above 200 are comparably large and seem to be less common in AGN and CVs, it needs to be considered that also other compact object types, like XRBs or super-soft sources (SSS) may reach similarly large X-ray-to-optical flux ratios. We conclude that deeper optical follow-up observations are required to confirm the INS nature for most candidates, as they have exemplarily already been conducted for J13171 (Kurpas et al. 2024). Consequently, this source possesses the largest X-ray-to-optical flux ratio in Fig. 8, which confirms the INS nature.
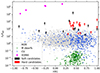 |
Fig. 8. X-ray-to-optical flux ratio limits for all the soft (black) and harder (red) candidates and some of the most prevalent contaminants. The limits for J06571 and J13171 were taken from Kurpas et al. (2023) and Kurpas et al. (2024). The indicated contaminants are the same as were used in Fig. 7 of Kurpas et al. (2023). |
4. Discussion
In this work, we have reported the results of a search for thermally emitting INS candidates in the data of the eRASS. The selection criteria, where we screened for soft X-ray emitting sources lacking counterparts at optical and IR wavelengths, have resulted in a candidate sample of 33 sources. We observed the seven established XDINSs to possess thermal spectra with BB temperatures of ∼40 − 100 eV (Turolla 2009). We found 13 promising candidates (see upper section of Table 3) displaying similarly soft spectra, and if confirmed, they could be in a similar evolutionary state. The spectral analysis of eRASS data remarkably favours (in all but one case) a thermal BB continuum with effective temperatures between 50 eV and 150 eV. At the same time, a PL nature may also be seen as unlikely based on the observed PL photon indexes that are oftentimes in excess of five to six for these sources, a limit known to be reached only by a few extreme NLS1s (Grünwald et al. 2023). We note, however, that present X-ray-to-optical flux ratio limits are still too shallow for most of them to secure an INS nature (see Fig. 8).
While some INS types may exhibit significant variability, most thermally emitting INSs (including XDINS, RPPs and most central compact objects in supernova remnants) are observed to be stable X-ray emitters over long timescales. We found no significant evidence of flux variability in the eRASS data of virtually any soft candidate that could favour an alternative nature, for instance, an SSS (e.g., Maitra & Haberl 2022, reporting the detection of four SSS in eROSITA). Interestingly, all soft candidates are located within |b|< 25° from the Galactic plane, where one would expect to find most INSs (e.g., Posselt et al. 2008; Pires et al. 2017).
Interesting from a population point of view is the discovery of hotter and potentially younger XDINSs, which would allow testing of evolutionary links with other families of INSs. These could be hidden amidst the sample of 20 hotter candidates we selected from eRASS. Of them, seven sources are better fit by a BB model of temperatures of kT ≳ 200 eV with respect to a PL with photon index 2.5–4. The small implied BB emission regions, at an assumed 1 kpc distance, may be indicative of hot spots on the neutron star surfaces. At larger distances, d ≥ 5 kpc, the X-ray flux is consistent with emission from most of the neutron star surface; such large distances are, however, in disagreement with the generally low column density derived for most of them from the spectra.
The sample of harder candidates in the lower section of Table 3 includes all six objects for which the false-negative rates imply a non-thermal continuum as well as most other candidates for which both a BB and PL model fit the data equally well. The result of a better-fitting PL does not necessarily imply a non-INS nature (see e.g., Becker 2009).
We found that many sources in the hard sample are located at higher Galactic latitudes, implying nearby low-luminosity sources or an extragalactic nature for them. The safest route to distinguish INSs from AGN or an accreting binary system is via the X-ray-to-optical flux ratio. Eleven sources in the hard sample already possess an X-ray-to-optical flux ratio limit above 200. However, also at this level, a CV or AGN nature cannot be fully ruled out. Among the eleven high X-ray-to-optical flux ratio sources are seven that are equally or better fitted with a BB model (J05215, J08303, J08535, J10111, J12215, J13082, and J21492). The remaining four high X-ray-to-optical flux ratio sources are better described by a PL nature. Studying the variability of these four sources, the absence of any significant variation in J08070 and an NH value that implies a Galactic nature makes it a prime candidate to be an RPP. The remaining three sources were observed to possibly be variable during the two-year period of eRASS data analysed here (J08525) and at longer timescales, considering upper limits by other X-ray instruments (J10395, J11024). This behaviour may be more in agreement with AGN or CVs. It is interesting to note that all candidates that we found to show hints of variability seem to correspond better with a non-thermal nature. The nine sources in the hard sample with low X-ray-to-optical flux ratios require additional follow-up observations to judge their nature.
As SRG/eROSITA is primarily a surveying mission, systematic positional inaccuracies or shifts might be expected. Such was the case for the XIDNS candidate J13171. The XMM-Newton follow-up observation of the source revealed its position to be consistent only at the 2σ level with eROSITA (Kurpas et al. 2024). A similar situation is likely not a concern for most of our candidates, as the angular distances to the nearest optical or IR object are significantly larger (see Table 2). On the other hand, source confusion is critical for the candidates located in crowded areas (like J12521). As such, follow-up observations at X-ray energies are necessary to obtain accurate astrometry while searching for possible optical or IR counterparts.
A promising result of our selection procedure is that we recover all known XDINSs and the recently proposed candidates in the searched eROSITA footprint. As these are generally found at brighter X-ray fluxes, they consequently possess more accurate positions than the majority of eROSITA sources. Thus, the selection accuracy may significantly decrease towards the flux limit of our search (10−13 erg s−1 cm−2, 0.2–2 keV). With the cut in hardness-ratio space being fairly inclusive, we expected most XDINSs to be erroneously deselected in the probabilistic cross-matching stage, which is rather strict. As our estimate of the false-deselection rate has shown, more than a third of the population may be erroneously excluded; at low Galactic latitudes, this fraction increases to 50%.
In Pires et al. (2017), neutron stars are born from progenitor massive stars distributed in the spiral arms of the Milky Way, at a scale height of 50 pc in the plane. Consequently, at a timescale relevant for cooling, most neutron stars will be located still relatively close to their birth place, where we expect our search to be most inefficient due to source confusion. In Fig. 9 we show the distribution in Galactic latitude of the simulated INS population and that of our sample of XDINS candidates. As it can be seen, the distribution of the synthetic neutron stars is considerably more skewed towards low Galactic latitudes than that of our eRASS candidate sample. However, when splitting the candidates into the soft and hard samples, the results look more promising. In fact, all of the soft eRASS candidates are located at low Galactic latitudes (|b|< 25°), which is in agreement with the expectation. The hard sample, on the other hand, spans a much wider latitude range, which might suggest an alternative nature.
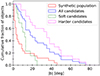 |
Fig. 9. Distribution of Galactic latitude (|b|), the synthetic population simulated in Pires et al. (2017, red full), and all identified candidates (blue full). To facilitate more detailed studies, we also show the distribution of the candidates identified as soft emitters (kT < 150 eV; green dashed) and as harder emitters (magenta dashed). |
In Posselt et al. (2008), the spatial distribution of fainter XDINSs is instead directly tied to those of more remote OB associations of the Milky Way beyond the Gould Belt. Based on this, the authors aim to identify the sky regions that are most promising for XDINS searches. Since, the considered OB associations are located near the Galactic plane, most new XDINSs are likewise expected to be situated at |b|< 30°. In our eRASS sample of XDINS candidates, more than 60% of the sources would be found at these latitudes, including all candidates of the soft sub-sample.
Within the limits enforced by small number statistics, the eRASS forecast in Pires et al. (2017) may be used to estimate the number of XDINSs that are in the candidate sample. Given that we have access to only half the sky, one may expect the eRASS input catalogue to contain 9–12 XDINSs. This is derived from the eRASS forecast, where between the western and eastern Galactic hemispheres a ratio of 2:3 XDINSs (above a flux limit of ∼2.2 × 10⁻¹³ erg s−1 cm−2) was found and a total number of 26 ± 4 all-sky was predicted (Pires et al. 2017). Folding these numbers with the determined false-deselection rates, one may expect that 2–6 XDINSs were matched away. XDINSs are expected to be mostly located near the Galactic plane (Posselt et al. 2008); thus, it may be more likely that the true numbers are at the larger end of this distribution. Consequently, one may expect that the candidate sample will contain between one and three new XDINSs.
Needless to say, population synthesis models, though a fundamental tool in astrophysics to compare observational results (e.g., from surveys) with theoretical expectations, are subject to several theoretical and observational uncertainties. If a significant number of objects are known, it allows for the testing of many of the population’s physical (and theoretically unknown) properties. Very often, however, the number of poorly constrained physical parameters is so large that very different models might be consistent with a given set of observational data. Conversely, the large number of hypotheses and simplifying assumptions tend to leave room for caution about the absolute predictive power of a given model. In this regard, the characterisation of XDINS candidates from the eRASS survey is of utmost importance (see e.g., the case of old INSs expected to be detected through accretion from the interstellar medium by ROSAT; Treves et al. 2000, for a review).
Finally, to improve completeness, the goal must be to expand the search towards lower non-matching thresholds. As can be seen in Fig. 4, decreasing the probability cut from 50% to include all sources above 20% non-matching probability would halve the false-deselection rate (from about 40% to 20% all-sky). However, this will increase the number of candidates by a factor > 2.7. Consequently, the time needed to conduct follow-up observations, which will allow the candidate sample to be fully characterised, will also grow accordingly. As such, searches for XDINSs at low non-matching probabilities may be expected to become more inefficient. To counter this inefficiency, a possible way forward could be to mainly concentrate on the regions that were identified in the past to be most promising to contain new XDINSs (Posselt et al. 2008).
5. Conclusions and outlook
For the first time since the ROSAT era, flux-limited all-sky searches for new thermally emitting INSs covering considerable areas of the sky can be pursued. Our investigation based on the two first years of the eROSITA mission has already produced promising results. We selected 33 INS candidates that can be divided into two soft and hard sub-samples. The 13 soft sources are a generally good match with thermally emitting INSs, though they still require deeper limits in the optical for a secure identification. For the 20 candidates of the hard sub-sample, alternative identifications, such as an AGN or CV nature, may also be viable. We expect that a full characterisation of the selected candidates may increase the number of known XDINSs by one or up to three, a significant increase with respect to the known population of only seven sources.
The next step is to follow up on the candidates and establish their INS identification and characterise their evolutionary state. At X-ray energies, these efforts primarily concern periodicity searches, which are essential to relate newly discovered sources with the several families of Galactic INSs. Likewise, it is important to characterise the neutron star spectrum and atmosphere. For example, the evidence for spectral features, as observed for several thermally emitting INSs (e.g., Tiengo et al. 2013; Schwope et al. 2022; Pires et al. 2023; Kurpas et al. 2024), allows for an estimate of the neutron star magnetic field close to the surface. While such absorption features cannot be identified in shallow eROSITA spectra alone, we note that indirect evidence, such as a large best-fit NH, may be indicative of their presence (see e.g., the case of J13171 in Kurpas et al. 2024).
Fully characterizing the candidate sample will not only better constrain the population properties of XDINSs but also help in understanding the most common contaminants surviving our search procedure. This promises improvements in future searches since the remaining contaminants may allow for more accurate tailoring of the selection steps towards INSs. In this regard, it is also of high interest to compare our selection with other cross-identification projects, as they are being undertaken within the German eROSITA consortium to select stars, CVs, or generally the most likely cross-match for any eROSITA source (Freund et al. 2024; Merloni et al. 2024).
The candidate J08071, which otherwise survives the selection, was detected in an internal earlier version of the eRASS1 source catalogue, but is not included in the published version (Merloni et al. 2024). The source is nonetheless reliably detected in all the other eRASS scans (detection likelihood values within 17 and 40). The non-detection in eRASS1 is not problematic since we found the eRASS1 flux upper limit of 1.38 × 10⁻¹³ erg s−1 cm−2 (0.2–2.3 keV; Tubín-Arenas et al. 2024) to exceed the observed source flux.
Adopting conservative optical blocking filter options (see Pires et al. 2017, for details).
Acknowledgments
We thank the anonymous referee for helpful suggestions and feedback that improved this paper. This work was funded by the Deutsche Forschungsgemeinschaft (DFG, German Research Foundation) – 414059771. This work was supported by the project XMM2ATHENA, which has received funding from the European Union’s Horizon 2020 research and innovation programme under grant agreement no101004168. AMP acknowledges the Innovation and Development Fund of Science and Technology of the Institute of Geochemistry, Chinese Academy of Sciences, the National Key Research and Development Program of China (Grant No. 2022YFF0503100), the Strategic Priority Research Program of the Chinese Academy of Sciences (Grant No. XDB 41000000), and the Key Research Program of the Chinese Academy of Sciences (Grant NO. KGFZD-145-23-15). This work is based on data from eROSITA, the soft X-ray instrument aboard SRG, a joint Russian-German science mission supported by the Russian Space Agency (Roskosmos), in the interests of the Russian Academy of Sciences represented by its Space Research Institute (IKI), and the Deutsches Zentrum für Luft- und Raumfahrt (DLR). The SRG spacecraft was built by Lavochkin Association (NPOL) and its subcontractors, and is operated by NPOL with support from the Max Planck Institute for Extraterrestrial Physics (MPE). The development and construction of the eROSITA X-ray instrument was led by MPE, with contributions from the Dr. Karl Remeis Observatory Bamberg & ECAP (FAU Erlangen-Nuernberg), the University of Hamburg Observatory, the Leibniz Institute for Astrophysics Potsdam (AIP), and the Institute for Astronomy and Astrophysics of the University of Tübingen, with the support of DLR and the Max Planck Society. The Argelander Institute for Astronomy of the University of Bonn and the Ludwig Maximilians Universität Munich also participated in the science preparation for eROSITA. The eROSITA data shown here were processed using the eSASS/NRTA software system developed by the German eROSITA consortium. For analysing X-ray spectra, we use the analysis software BXA (Buchner et al. 2014), which connects the nested sampling algorithm UltraNest (Buchner 2021) with the fitting environment XSPEC (Arnaud 1996). This research has made use of the VizieR catalogue access tool, CDS, Strasbourg, France (DOI : https://doi.org/10.26093/cds/vizier). The original description of the VizieR service was published in 2000, A&AS 143, 23. This research has made use of data obtained from XMMSL2, the Second XMM-Newton Slew Survey Catalogue, produced by members of the XMM SOC, the EPIC consortium, and using work carried out in the context of the EXTraS project (“Exploring the X-ray Transient and variable Sky”, funded from the EU’s Seventh Framework Programme under grant agreement no. 607452). This work made use of Astropy: (http://www.astropy.org) a community-developed core Python package and an ecosystem of tools and resources for astronomy (Astropy Collaboration 2013, 2018, 2022).
References
- Agüeros, M. A., Posselt, B., Anderson, S. F., et al. 2011, AJ, 141, 176 [CrossRef] [Google Scholar]
- Arnaud, K. A. 1996, in Astronomical Data Analysis Software and Systems V, eds. G. H. Jacoby, & J. Barnes, ASP Conf. Ser., 101, 17 [NASA ADS] [Google Scholar]
- Astropy Collaboration (Robitaille, T. P., et al.) 2013, A&A, 558, A33 [NASA ADS] [CrossRef] [EDP Sciences] [Google Scholar]
- Astropy Collaboration (Price-Whelan, A. M., et al.) 2018, AJ, 156, 123 [Google Scholar]
- Astropy Collaboration (Price-Whelan, A. M., et al.) 2022, ApJ, 935, 167 [NASA ADS] [CrossRef] [Google Scholar]
- Becker, W. 2009, Astrophys. Space Sci. Lib., 357, 91 [NASA ADS] [CrossRef] [Google Scholar]
- Blackburn, J. K. 1995, in Astronomical Data Analysis Software and Systems IV, eds. R. A. Shaw, H. E. Payne, & J. J. E. Hayes, ASP Conf. Ser., 77, 367 [Google Scholar]
- Boller, T., Freyberg, M. J., Trümper, J., et al. 2016, A&A, 588, A103 [NASA ADS] [CrossRef] [EDP Sciences] [Google Scholar]
- Brunner, H., Liu, T., Lamer, G., et al. 2022, A&A, 661, A1 [NASA ADS] [CrossRef] [EDP Sciences] [Google Scholar]
- Buchner, J. 2021, J. Open Source Softw., 6, 3001 [CrossRef] [Google Scholar]
- Buchner, J., Georgakakis, A., Nandra, K., et al. 2014, A&A, 564, A125 [NASA ADS] [CrossRef] [EDP Sciences] [Google Scholar]
- Burrows, D. N., Hill, J. E., Nousek, J. A., et al. 2005, Space Sci. Rev., 120, 165 [Google Scholar]
- Chambers, K. C., Magnier, E. A., Metcalfe, N., et al. 2016, arXiv e-prints [arXiv:1612.05560] [Google Scholar]
- De Grandis, D., Taverna, R., Turolla, R., et al. 2021, ApJ, 914, 118 [NASA ADS] [CrossRef] [Google Scholar]
- De Grandis, D., Rigoselli, M., Mereghetti, S., et al. 2022, MNRAS, 516, 4932 [NASA ADS] [CrossRef] [Google Scholar]
- Demasi, S., Anderson, S. F., & Agüeros, M. A. 2024, ApJ, 961, 36 [NASA ADS] [CrossRef] [Google Scholar]
- Dessert, C., Foster, J. W., & Safdi, B. R. 2020, ApJ, 904, 42 [Google Scholar]
- Dey, A., Schlegel, D. J., Lang, D., et al. 2019, AJ, 157, 168 [Google Scholar]
- Drake, J. J., Marshall, H. L., Dreizler, S., et al. 2002, ApJ, 572, 996 [NASA ADS] [CrossRef] [Google Scholar]
- Freund, S., Czesla, S., Predehl, P., et al. 2024, A&A, 684, A121 [NASA ADS] [CrossRef] [EDP Sciences] [Google Scholar]
- Gaia Collaboration (Vallenari, A., et al.) 2023, A&A, 674, A1 [NASA ADS] [CrossRef] [EDP Sciences] [Google Scholar]
- Grünwald, G., Boller, T., Rakshit, S., et al. 2023, A&A, 669, A37 [NASA ADS] [CrossRef] [EDP Sciences] [Google Scholar]
- Haberl, F. 2004, AdSpR, 33, 638 [NASA ADS] [Google Scholar]
- Haberl, F. 2007, Ap&SS, 308, 181 [NASA ADS] [CrossRef] [Google Scholar]
- HI4PI Collaboration (Ben Bekhti, N., et al.) 2016, A&A, 594, A116 [NASA ADS] [CrossRef] [EDP Sciences] [Google Scholar]
- Hohle, M. M., Haberl, F., Vink, J., et al. 2012, MNRAS, 423, 1194 [NASA ADS] [CrossRef] [Google Scholar]
- Ishibashi, W., & Courvoisier, T. J. L. 2010, A&A, 512, A58 [NASA ADS] [CrossRef] [EDP Sciences] [Google Scholar]
- Kaplan, D. L. 2008, in 40 Years of Pulsars: Millisecond Pulsars, Magnetars and More, eds. C. Bassa, Z. Wang, A. Cumming, & V. M. Kaspi, AIP Conf. Ser., 983, 331 [CrossRef] [Google Scholar]
- Keane, E. F., & Kramer, M. 2008, MNRAS, 391, 2009 [Google Scholar]
- Khokhryakova, A. D., Biryukov, A. V., & Popov, S. B. 2021, Astron. Rep., 65, 615 [NASA ADS] [CrossRef] [Google Scholar]
- König, O., Saxton, R. D., Kretschmar, P., et al. 2022, Astron. Comput., 38, 100529 [CrossRef] [Google Scholar]
- Kurpas, J., Schwope, A. D., Pires, A. M., Haberl, F., & Buckley, D. A. H. 2023, A&A, 674, A155 [NASA ADS] [CrossRef] [EDP Sciences] [Google Scholar]
- Kurpas, J., Schwope, A. D., Pires, A. M., & Haberl, F. 2024, A&A, 683, A164 [NASA ADS] [CrossRef] [EDP Sciences] [Google Scholar]
- Maitra, C., & Haberl, F. 2022, A&A, 657, A26 [NASA ADS] [CrossRef] [EDP Sciences] [Google Scholar]
- Manchester, R. N., Hobbs, G. B., Teoh, A., & Hobbs, M. 2005, AJ, 129, 1993 [Google Scholar]
- Marocco, F., Eisenhardt, P. R. M., Fowler, J. W., et al. 2021, ApJS, 253, 8 [Google Scholar]
- McMahon, R. G., Banerji, M., Gonzalez, E., et al. 2013, The Messenger, 154, 35 [NASA ADS] [Google Scholar]
- Merloni, A., Lamer, G., Liu, T., et al. 2024, A&A, 682, A34 [NASA ADS] [CrossRef] [EDP Sciences] [Google Scholar]
- Motch, C., Pires, A. M., Haberl, F., Schwope, A., & Zavlin, V. E. 2009, A&A, 497, 423 [NASA ADS] [CrossRef] [EDP Sciences] [Google Scholar]
- Olausen, S. A., & Kaspi, V. M. 2014, ApJS, 212, 6 [Google Scholar]
- Özel, F., & Freire, P. 2016, ARA&A, 54, 401 [Google Scholar]
- Pfeffermann, E., Briel, U. G., Hippmann, H., et al. 1987, in Soft X-ray Optics and Technology, eds. E. Koch, & G. A. Schmahl, SPIE Conf. Ser., 733, 519 [Google Scholar]
- Pineau, F. X., Derriere, S., Motch, C., et al. 2017, A&A, 597, A89 [NASA ADS] [CrossRef] [EDP Sciences] [Google Scholar]
- Pires, A. M., Motch, C., & Janot-Pacheco, E. 2009, A&A, 504, 185 [NASA ADS] [CrossRef] [EDP Sciences] [Google Scholar]
- Pires, A. M., Motch, C., Turolla, R., et al. 2015, A&A, 583, A117 [NASA ADS] [CrossRef] [EDP Sciences] [Google Scholar]
- Pires, A. M., Schwope, A. D., & Motch, C. 2017, Astron. Nachr., 338, 213 [NASA ADS] [CrossRef] [Google Scholar]
- Pires, A. M., Motch, C., Kurpas, J., et al. 2022, A&A, 666, A148 [NASA ADS] [CrossRef] [EDP Sciences] [Google Scholar]
- Pires, A. M., Schwope, A., & Kurpas, J. 2023, IAU Symp., 363, 288 [Google Scholar]
- Popov, S. B. 2023, Universe, 9, 273 [NASA ADS] [CrossRef] [Google Scholar]
- Posselt, B., Popov, S. B., Haberl, F., et al. 2008, A&A, 482, 617 [NASA ADS] [CrossRef] [EDP Sciences] [Google Scholar]
- Potekhin, A. Y., Zyuzin, D. A., Yakovlev, D. G., Beznogov, M. V., & Shibanov, Y. A. 2020, MNRAS, 496, 5052 [NASA ADS] [CrossRef] [Google Scholar]
- Predehl, P., Andritschke, R., Arefiev, V., et al. 2021, A&A, 647, A1 [EDP Sciences] [Google Scholar]
- Rigoselli, M., Mereghetti, S., & Tresoldi, C. 2022, MNRAS, 509, 1217 [Google Scholar]
- Rutledge, R. E., Fox, D. B., & Shevchuk, A. H. 2008, ApJ, 672, 1137 [NASA ADS] [CrossRef] [Google Scholar]
- Saxton, R. D., Read, A. M., Esquej, P., et al. 2008, A&A, 480, 611 [NASA ADS] [CrossRef] [EDP Sciences] [Google Scholar]
- Saxton, R. D., König, O., Descalzo, M., et al. 2022, Astron. Comput., 38, 100531 [NASA ADS] [CrossRef] [Google Scholar]
- Saydjari, A. K., Schlafly, E. F., Lang, D., et al. 2023, ApJS, 264, 28 [NASA ADS] [CrossRef] [Google Scholar]
- Schlafly, E. F., Meisner, A. M., & Green, G. M. 2019, ApJS, 240, 30 [Google Scholar]
- Schwope, A., Pires, A. M., Kurpas, J., et al. 2022, A&A, 661, A41 [NASA ADS] [CrossRef] [EDP Sciences] [Google Scholar]
- Tiengo, A., Esposito, P., Mereghetti, S., et al. 2013, Nature, 500, 312 [CrossRef] [Google Scholar]
- Traulsen, I., Schwope, A. D., Lamer, G., et al. 2020, A&A, 641, A137 [NASA ADS] [CrossRef] [EDP Sciences] [Google Scholar]
- Treves, A., Turolla, R., Zane, S., & Colpi, M. 2000, PASP, 112, 297 [NASA ADS] [CrossRef] [Google Scholar]
- Tubín-Arenas, D., Krumpe, M., Lamer, G., et al. 2024, A&A, 682, A35 [NASA ADS] [CrossRef] [EDP Sciences] [Google Scholar]
- Turolla, R. 2009, in Astrophysics and Space Science Library, ed. W. Becker, 357, 141 [NASA ADS] [CrossRef] [Google Scholar]
- Viganò, D., Rea, N., Pons, J. A., et al. 2013, MNRAS, 434, 123 [CrossRef] [Google Scholar]
- Virtanen, P., Gommers, R., Oliphant, T. E., et al. 2020, Nature Methods, 17, 261 [CrossRef] [Google Scholar]
- Voges, W., Aschenbach, B., Boller, T., et al. 1999, A&A, 349, 389 [NASA ADS] [Google Scholar]
- Webb, N. A., Coriat, M., Traulsen, I., et al. 2020, A&A, 641, A136 [NASA ADS] [CrossRef] [EDP Sciences] [Google Scholar]
- Wenger, M., Ochsenbein, F., Egret, D., et al. 2000, A&AS, 143, 9 [NASA ADS] [CrossRef] [EDP Sciences] [Google Scholar]
- Wilms, J., Allen, A., & McCray, R. 2000, ApJ, 542, 914 [Google Scholar]
- Yoneyama, T., Hayashida, K., Nakajima, H., Inoue, S., & Tsunemi, H. 2017, PASJ, 69, 50 [NASA ADS] [CrossRef] [Google Scholar]
- Yoneyama, T., Hayashida, K., Nakajima, H., & Matsumoto, H. 2019, PASJ, 71, 17 [NASA ADS] [CrossRef] [Google Scholar]
- Zavlin, V. E., & Pavlov, G. G. 2002, in Neutron Stars, Pulsars, and Supernova Remnants, eds. W. Becker, H. Lesch, & J. Trümper, 263 [Google Scholar]
All Tables
All Figures
|
Fig. 1. Hardness ratio plots presenting the hardness ratio distribution for all the selected candidates (magenta), the five confirmed XDINSs on the western Galactic hemisphere and recently proposed candidates (green; Pires et al. 2015, 2022), and the synthetic INS population from (black; Pires et al. 2017). The applied cut to select the soft X-ray emitting candidates from all the eROSITA sources above the applied flux limit (grey) is indicated by the black dashed line and is based on simulated black body spectra of varying temperature and absorption strengths (blue lines). (See the text for additional information on these simulations.) |
| In the text | |
|
Fig. 2. eROSITA image of the field of J13472. The source extraction region is indicated by the orange circle, whereas the background region annulus and excluded field sources are marked by white circles. |
| In the text | |
|
Fig. 3. Magnitude distribution of Legacy Survey DR10 sources in a 5′ radius around the candidate J13472. The distribution was interpolated with a B-spline (red line), and the resulting local magnitude limit at 25 mag is indicated by the vertical green dashed line. |
| In the text | |
|
Fig. 4. Distribution of non-matching probabilities in the cross-match used for the candidate selection (red), a cross-match with artificially shifted positions (blue), and for the known XDINSs (green dashed) that comprise the five ROSATdetected sources on the western Galactic hemisphere and the proposed candidates 4XMM J022141.5–735632 (Rigoselli et al. 2022; Pires et al. 2022) and 2XMM J104608.7–594306 (Pires et al. 2015). |
| In the text | |
|
Fig. 5. Galactic view of the false-deselection rate sky distribution. We show the location of the 13 softer (magenta) and the 20 harder (blue) candidates. The known XDINSs (same sources as in Fig. 4) are indicated in red. |
| In the text | |
|
Fig. 6. Example eROSITA spectrum and BB fit for the source J13472. For presentation purposes, the spectrum was rebinned. |
| In the text | |
|
Fig. 7. Long-term light curve for the candidate J10395. Upper limits from the XMM-Newton Slew Survey (green), the ROSAT All-Sky survey (blue), and Swift/XRT (magenta) are shown. The stacked eROSITA flux is indicated in black, with the x-axis error depicting the time between the first and last eROSITA observation. |
| In the text | |
|
Fig. 8. X-ray-to-optical flux ratio limits for all the soft (black) and harder (red) candidates and some of the most prevalent contaminants. The limits for J06571 and J13171 were taken from Kurpas et al. (2023) and Kurpas et al. (2024). The indicated contaminants are the same as were used in Fig. 7 of Kurpas et al. (2023). |
| In the text | |
|
Fig. 9. Distribution of Galactic latitude (|b|), the synthetic population simulated in Pires et al. (2017, red full), and all identified candidates (blue full). To facilitate more detailed studies, we also show the distribution of the candidates identified as soft emitters (kT < 150 eV; green dashed) and as harder emitters (magenta dashed). |
| In the text | |
Current usage metrics show cumulative count of Article Views (full-text article views including HTML views, PDF and ePub downloads, according to the available data) and Abstracts Views on Vision4Press platform.
Data correspond to usage on the plateform after 2015. The current usage metrics is available 48-96 hours after online publication and is updated daily on week days.
Initial download of the metrics may take a while.