Open Access
Fig. 7.
Download original image
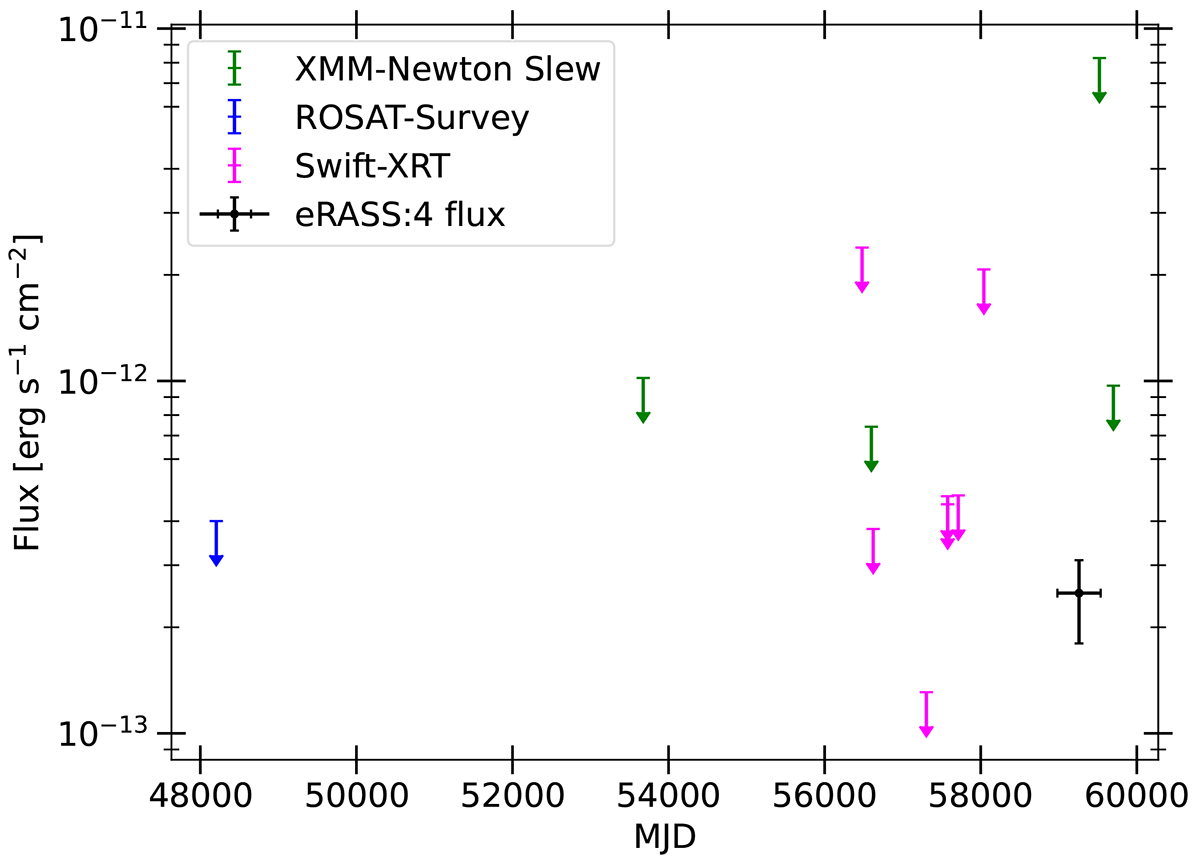
Long-term light curve for the candidate J10395. Upper limits from the XMM-Newton Slew Survey (green), the ROSAT All-Sky survey (blue), and Swift/XRT (magenta) are shown. The stacked eROSITA flux is indicated in black, with the x-axis error depicting the time between the first and last eROSITA observation.
Current usage metrics show cumulative count of Article Views (full-text article views including HTML views, PDF and ePub downloads, according to the available data) and Abstracts Views on Vision4Press platform.
Data correspond to usage on the plateform after 2015. The current usage metrics is available 48-96 hours after online publication and is updated daily on week days.
Initial download of the metrics may take a while.