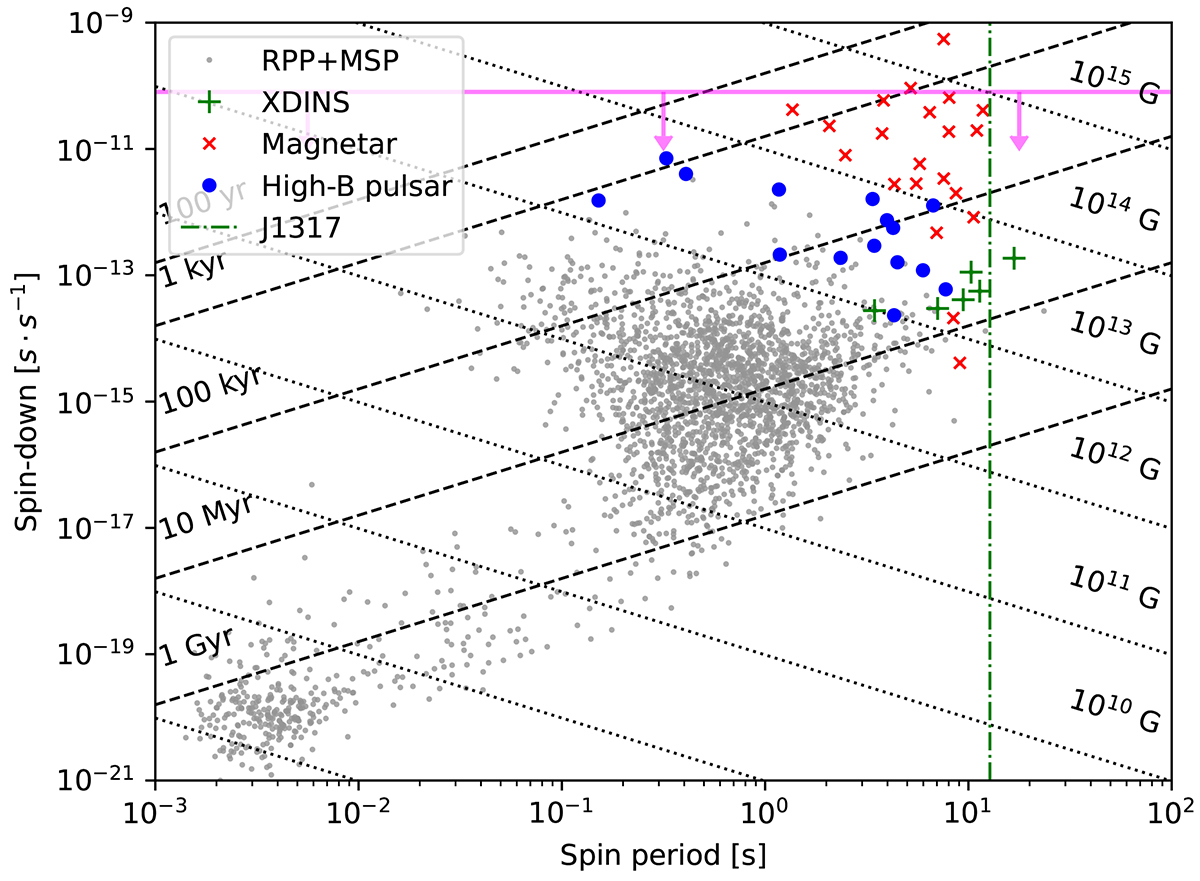
Fig. 8.
Download original image
Spin vs. spin-down diagram presenting the spin properties of the known isolated neutron star population. In the background, we plot all the objects collected in the ATNF pulsar database (Version 1.70; Manchester et al. 2005). The period of J1317 is marked by the vertical green line. The horizontal magenta line indicates the upper 3σ spin-down limit derived from the XMM-Newton and NICER observations.
Current usage metrics show cumulative count of Article Views (full-text article views including HTML views, PDF and ePub downloads, according to the available data) and Abstracts Views on Vision4Press platform.
Data correspond to usage on the plateform after 2015. The current usage metrics is available 48-96 hours after online publication and is updated daily on week days.
Initial download of the metrics may take a while.