Fig. 1.
Download original image
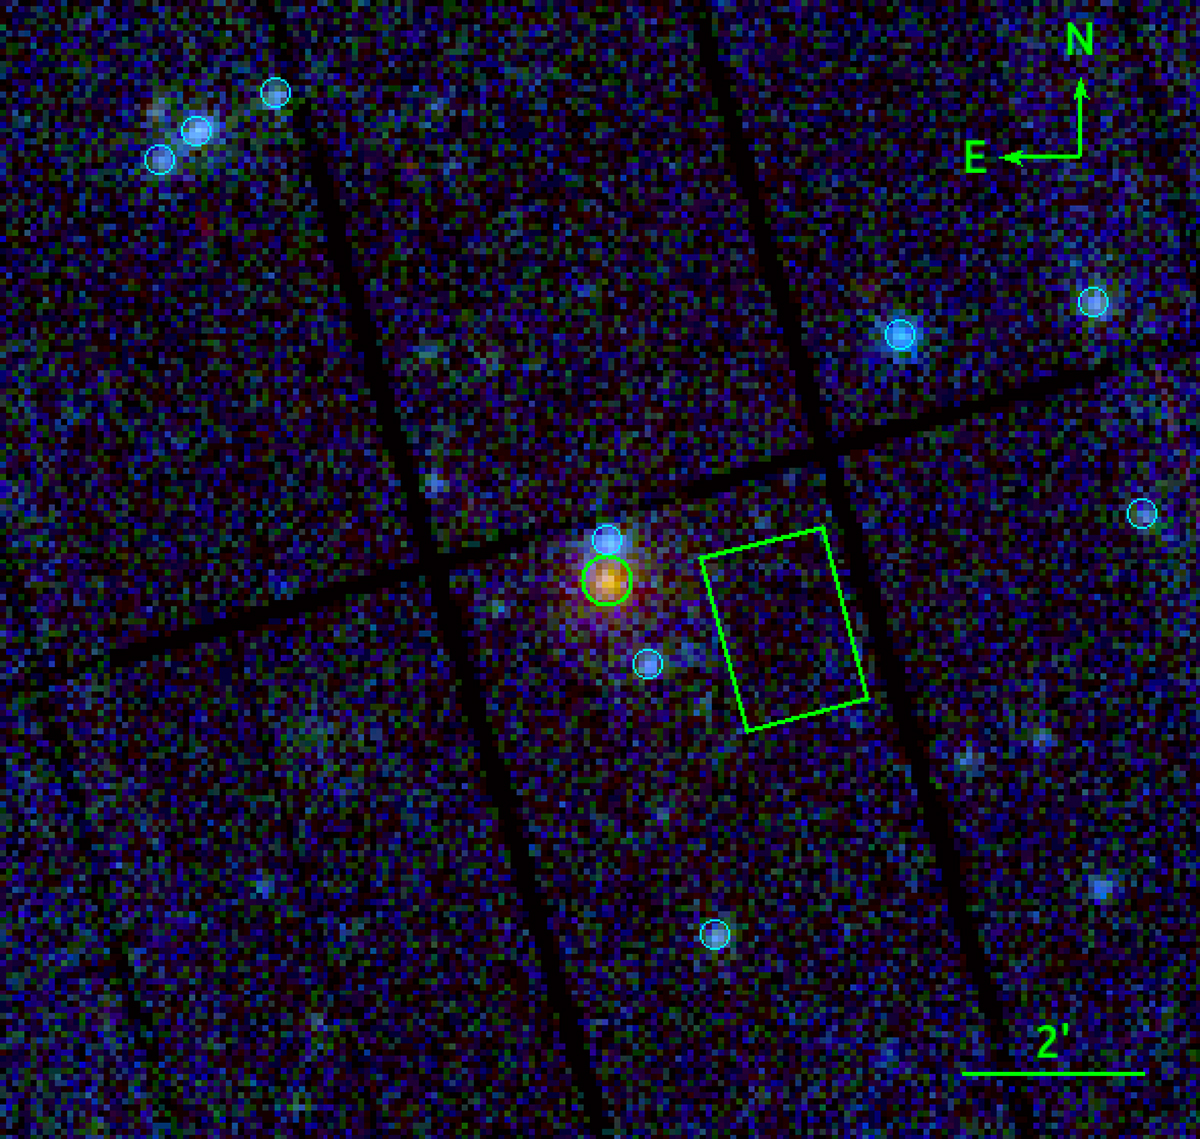
RGB XMM-Newton EPIC image. Red indicates counts in the 0.2–1 keV band, green in the 1–2 keV band, and blue in the 2–12 keV band. The source and background regions used in the EPIC-pn analysis are marked by the green circle and box. The X-ray sources we used to correct the X-ray sky position of J1317 are marked by cyan circles.
Current usage metrics show cumulative count of Article Views (full-text article views including HTML views, PDF and ePub downloads, according to the available data) and Abstracts Views on Vision4Press platform.
Data correspond to usage on the plateform after 2015. The current usage metrics is available 48-96 hours after online publication and is updated daily on week days.
Initial download of the metrics may take a while.