| Issue |
A&A
Volume 683, March 2024
|
|
|---|---|---|
| Article Number | A148 | |
| Number of page(s) | 14 | |
| Section | Planets and planetary systems | |
| DOI | https://doi.org/10.1051/0004-6361/202347168 | |
| Published online | 18 March 2024 | |
Impact of discontinuous grain size distributions on the spectral energy distribution of debris disks
1
Department of Physics, University of Warwick,
Gibbet Hill Road,
Coventry
CV4 7AL,
UK
e-mail: minjae.k.kim@warwick.ac.uk
2
Centre for Exoplanets and Habitability, University of Warwick,
Gibbet Hill Road,
Coventry
CV4 7AL,
UK
3
Institute of Theoretical Physics and Astrophysics, University of Kiel,
Leibnizstraße 15,
24118
Kiel,
Germany
Received:
13
June
2023
Accepted:
8
January
2024
Context. The collisional evolution of debris disks is expected to cause the characteristic wavy pattern, that is, an under- or overabundance of particles of specific sizes, of grain size distributions. This perturbed grain size distribution potentially leaves characteristic patterns in the spectral energy distribution (SED) of the disk system.
Aims. We aim to quantify and understand the specific influence of discontinuous particle size distributions on the appearance of debris disks. For this purpose, we considered dust emission models based on two different grain size distributions, namely, one with a single power law and one with a broken power law. In particular, our study is focused on the impact of an overabundance of small grains and an underabundance of medium-sized grains on the far-IR and (sub-)millimeter regime on the dust reemission radiation and the potential to constrain discontinuities in the grain size distribution from (sub-)millimeter photometric measurements of debris disks.
Methods. We compared the spectral index α (Fν ∝ να) in the case of a continuous grain size distribution with that of a discontinuous grain size distribution. We performed this comparison for central stars with different spectral types and two different disk structures (e.g., slim and broad debris dust rings).
Results. Within the considered parameter space, we found a characteristic difference between the spectral slopes of the SED in the different scenarios. In particular, the overabundance of small grains resulting from collisional events and thus parameters defining the outcome of disk events in debris disks is potentially observable by comparison with the SED corresponding to a grain size distribution resulting from an ideal collisional cascade. More specifically, the overabundance of small grains leads to a steeper slope in the far-IR and sub-millimeter regime, while the spectral index in the millimeter regime is hardly affected. On the other hand, the underabundance of medium-sized grains results in a slight steepening of the far-IR slope of the SED, but its primary effect is on the millimeter slope of the SED, causing it to become shallower. We also found that the impact of an overabundance of small dust particles is more pronounced than that of an underabundance of medium-sized dust particles. We also found that the difference between the spectral indices for the two different grain size distributions is largest for debris disks around brighter central stars and broader disks. However, the impact of the considered spatial distributions described by the fractional width of the disk system is weak. Our results also show that the dust composition is not the sole physical mechanism responsible for the spectral inversion observed in the far-IR to millimeter part of the SED of debris disk systems. Furthermore, the location of the spectral break is placed at different wavelength regimes if the grain size distribution is considered as a function of blowout size and stellar type.
Key words: methods: numerical / circumstellar matter / planetary systems
© The Authors 2024
 Open Access article, published by EDP Sciences, under the terms of the Creative Commons Attribution License (https://creativecommons.org/licenses/by/4.0), which permits unrestricted use, distribution, and reproduction in any medium, provided the original work is properly cited.
This article is published in open access under the Subscribe to Open model. Subscribe to A&A to support open access publication.
1 Introduction
The lifetime of small dust grains in debris disks is much shorter than the stellar age (Artymowicz & Clampin 1997), indicating that dust cannot be primordial in these systems. Thus, the dust in debris disks must be continuously replenished through disruptive collisions. This process leads to the creation of fragments with a broad size distribution, which can be approximately described by a power law. For example, for a steady-state collisional cascade (Dohnanyi 1969), a power law with γ = −3.5 is valid for the differential size distribution, namely, dn (a) ∝ aγ da, where a is the size of the dust grain. However, due to the finite size distribution and size-dependent collisional strength of the colliding bodies and particles, the real slope of the size distribution may strongly deviate from this value and thus may not accurately reflect the true grain size distribution. For example, the collisional cascade does not extend down to arbitrarily small particles because tiny particles with a high ß ratio between radiation pressure and stellar gravity are quickly blown away by the stellar radiation pressure from the disks (Krivov et al. 2006). Furthermore, non-gravitational forces (e.g., Poynting-Robertson drag; Backman & Paresce 1993) acting on grains of particular sizes in the range of tens to hundreds of micrometers may further modify the grain size distribution (Löhne et al. 2017).
In previous studies based on numerical simulations, a characteristic wavy pattern in the grain size distribution resulting from collisional evolution within debris disks has been found (e.g., Thébault & Augereau 2007; Kim et al. 2018). These patterns, which are not solely described by a simple power law but, for example, by broken power laws, indicate the overabundance or underabundance of particles of specific sizes. In particular, the wavy pattern of the discontinuous grain size distribution becomes more pronounced (deeper) and broader in extreme scenarios involving the lower material strength of dust grains (Kim et al. 2018).
Furthermore, several observational findings have pointed toward the need for a more complex model for grain size distribution beyond a simple single power law. For instance, observational findings based on the comparison between flux and polarization measurements of protoplanetary disks at sub-millimeter wavelengths have also raised questions regarding the corresponding grain size distribution (e.g., Brunngräber & Wolf 2021). Bürger et al. (2023) also recently demonstrated an apparent overabundance of grains with radii between 3 and 6 mm in the derived grain size distribution of comet 67P/Churyumov-Gerasimenko. Additionally, Rodigas et al. (2015) found that the grain size distributions derived from the observation of thermal reemission radiation are not consistent with those from scattered light colors and/or scattering functions. Finally, Olofsson et al. (2023) recently demonstrated that the overabundance of small grains in debris disks could also explain an intriguing arc-like structure observed in total intensity. These findings suggest the presence of a discontinuous or more complicated grain size distribution and challenge the traditional single power law model.
The grain size distribution directly influences the slope of the spectral energy distribution (SED) in the far-infrared (far-IR) to (sub-)millimeter range of the thermal reemission by the dust (Wyatt & Dent 2002). Consequently, the presence of overabundant or underabundant particle sizes at these wavelengths potentially leaves an observable imprint in the SED. For example, the recent NIKA2 observation of HD 107146 indicates a break at the far-IR and sub-millimeter/millimeter wavelength regimes (Lestrade et al. 2020), which is further supported by supplementary observations, possibly showing a change in the slope of the SED (e.g., Holland et al. 2017; Ricci et al. 2015b). In this particular case, the spatial distribution of dust in this debris disk system cannot be a reason for this break at long wavelength because HD 107146 is observed as a narrow belt system (Marino et al. 2018). Moreover, the influence of the dust temperature on the Planck function is weak in the Rayleigh-Jeans regime, diminishing its importance at long wavelengths. However, given the small range of dust temperatures in a narrow belt system, the impact of the underlying grain size distribution becomes more pronounced. Consequently, a change in the SED slope due to an overabundance/underabundance of grains is expected in the wavelength region where grains of the corresponding size emit most efficiently.
The goal of the current study is to evaluate the impact of the discontinuous size distribution of dust in debris disks on the SED of these systems. In turn, the results of this study are expected to serve as a tool to also address the opposite question, namely whether constraints on the parameters describing the collisions in debris disks can be derived from the analysis of the slope of their thermal reemission SED. The present study is structured as follows: in Sect. 2, we describe our model for the simulations of debris disk observables. In Sect. 3, we quantify and discuss the impact of the grain size distributions on the observational appearance of debris disks, in particular, their SEDs (e.g., the slope of SEDs). In Sect. 4, we discuss an application of our results to observations and possible degeneracies as well as connections to chemical and physical properties. We summarize our findings in Sect. 5.
Disk and dust model parameters for the simulations and corresponding references.
Stellar, disk, and dust model parameters for the simulations and their reference.
2 Modeling of debris disks
2.1 Model parameters of debris disk system
The parameters and characteristics of stars, disks, and dust in our models are based on observations of currently known debris disk systems. Tables 1 and 2 summarize the detailed characteristics of disk and dust parameters for our simulations.
Disk geometry. We considered the inner and outer radii of disks based on the empirical relation between planetesimal belt radius and stellar luminosity (Matrà et al. 2018) with two different belt fractional widths: a narrower belt (e.g., ΔR/R ~ 0.17 of debris disks around ε Eridani; Lestrade & Thilliez 2015) comparable to the classical Kuiper belt and a broader belt (e.g., ΔR/R ~ 1.25 of debris disks around HD 206893; Marino et al. 2020). We note that broader belt systems show a broad range of dust temperatures. The mass of inner belts in a two-belt system is typically only a few percent compared to outer belts (e.g., Ertel et al. 2011; Marino et al. 2018), implying that the contribution of the inner belt to the slope of the SED is negligible. Thus, we considered a single belt system to reduce the complexity of the model.
Minimum/maximum grain size and dust composition. For the smallest grain size, we applied a blowout grain size abo (Backman & Paresce 1993) depending on the spectral type. For cases without a blowout size (i.e., for central stars’ effective temperatures below 5250 K in our model setup; Kirchschlager & Wolf 2013), we considered a minimum grain size of 0.264 µm that has been used in previous studies (e.g., Löhne et al. 2017; Kim et al. 2018), which shows the similarity to the previous findings of debris disks around M-type stars (e.g., Matthews et al. 2015) based on the strong stellar wind (Plavchan et al. 2005), causing an effect similar to that of the radiation pressure force (Augereau & Beust 2006). Furthermore, using Mie theory, silicate or ice grains comparable to this size are hardly affected by the stellar radiation pressure in debris disks around a solar-type star (Cataldi 2016). We adopted a maximum grain radius of 10 cm (Lestrade et al. 2020; Pawellek et al. 2021) to analyze the dust continuum up to a wavelength of a few millimeters (e.g., ATCA Survey; Ricci et al. 2015b). We note that the contribution of larger grains to the net flux is negligible when considering a steep grain size distribution. For the grain composition, we assumed the simplest dust grains to be compact and homogenous spheres composed of astronomical silicate (referred to as “Astrosil”) with a bulk density of 3.5 g cm−3 and optical constants taken from Draine (2003).
Disk mass. Based on previous surveys at sub-millimeter wavelengths, we considered a dust mass in debris disks of ~ 10−7 M⊙ for the single power law grain size distribution model (e.g., dust mass of most debris disks typically range from ~10−9 to several 10−7 M⊙; Greaves et al. 2005). In the case of the broken power law grain size distribution model, the dust mass is varied depending on the scale factor but remains within a similar range (i.e., 1.0 to 1.26 × 10⁻⁷ M⊙; see Table 3). This is because the contribution of small dust grains mainly affects the dust reemission rather than significantly influencing the overall mass budget, which is dominated by larger grains. We considered the same mass of dust Mdust for both types of disk structures (i.e., narrow and broad belt-like disks). We note that within this model, the overall mass of a disk does not significantly affect the spectral index as long as the disk remains optically thin; however, a specific range of dust masses with the under- or overabundance of medium and small grains is indeed an important factor. The detailed characteristics of the modeled classical single power law and wavy pattern (i.e., broken power law) grain size distribution are compiled in Fig. 1 and Table 3.
Central star. We considered central stars of the following five spectral types (in brackets, exemplary systems are listed): A star (β Pictoris), F star (HD 139664), G star (HD 107146), K star (HD 53143), and M star (AU mic). Table 2 summarizes the detailed characteristics of the stellar parameters and corresponding disk and dust parameters.
Simulation of SEDs. For the calculation of model SEDs, we used the software tool DMS (Kim et al. 2018), which is optimized for optically thin emission of debris disks. Based on wavelength-dependent refractive indices, we calculated the required the optical properties with the tool miex on the basis of the Mie scattering theory (Wolf & Voshchinnikov 2004).
Considered grain size distributions, dust mass, and corresponding model ID.
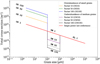 |
Fig. 1 Simulated total cross section of the dust in our debris disk around the A star (e.g., abo ~ 1.99 µm) based on the considered grain size distributions. The red solid line represents the classical single power law (reference case; see Sect. 2.2.1). The yellow, green, and blue dashed lines represent the perturbed size distribution with an overabundance of grains with radii ranging from the blowout size (see Table 2) to 100 µm. The purple, gray, and navy dashed lines represent the distribution with the underabundance in the size range of 100 µm to 1000 µm, which are mainly motivated by the collisional model presented in Thébault & Augereau (2007) and Kim et al. (2018). |
2.2 Modeling of grain size distributions
To understand how the grain size distribution affects the SED of debris disks, we considered dust emission models that are based on two different grain size distributions: a single power law grain size distribution (Sect. 2.2.1) and a broken power law grain size distribution (Sect. 2.2.2). Based on these distributions, we studied the shape of the thermal reemission SED in the far-IR to the sub-millimeter-millimeter wavelength range.
2.2.1 Single power law grain size distribution
As a reference case, we considered the classical single power law grain size distribution dn (a) ∝ a−3.5da (see Fig. 1 and Table 3 top row for details) resulting from a collisional cascade in debris disks at steady-state equilibrium with size-independent collisional strength (Dohnanyi 1969). Since the absorption cross section Cabs of dust grains gradually decreases toward longer wavelengths irrespective of the dust composition (Kim et al. 2019), the dust emission model employing the single power law grain size distribution is expected to result in a continuous decrease in the SED at long wavelengths (i.e., the far-IR to millimeter range).
2.2.2 Broken power law grain size distribution
As indicated by previous studies (Thébault & Augereau 2007; Löhne et al. 2017; Kim et al. 2018), collisional evolution leaves an imprint on the grain size distribution. In particular, the depletion of the smallest grains to the blowout size results in a surplus of slightly larger grains due to reduced collisional erosion. This leads to the propagation of an overabundance around small dust grains with radii ranging from several to approximately hundreds of micrometers and an underabundance (i.e., local minimum) toward larger grains with radii of several hundred to thousands of micrometers. For example, an observed peak in the wavy pattern of the grain size distribution occurs for grains that are slightly larger than the blowout size, specifically at about ~1.5 times this size. Additionally, the first minimum in this distribution is noted at about 100 times the blowout size (Thébault & Augereau 2007).
Furthermore, for the particular case of debris disks around HD107146, referenced in Sect. 1, a local decrease in the long wavelength regime of the SED ranging from 800 µm to 6 mm has been observed (Lestrade et al. 2020). A possible explanation for this finding is to link it to the peculiarities of the grain size distribution, where the deep depletion of the abundance of grains in the size range of hundreds of micrometers coincides with the characteristic grain size for strongly absorbing materials (~ approximately ranging from 100 to 1000 µm; Backman & Paresce 1993).
Based on the discussion in this section, we considered a general and rather simplistic grain size distribution that shows the key characteristics that potentially allow us to explain discontinuities in the shape of the thermal reemission SED of debris disks. Our discontinuous grain size distribution models follow a broken power law pattern, comprising an overabundance of small grains ranging from the blowout grain size to 100 µm and an underabundance of medium-sized grains (“medium grain” in the following) ranging from 100 to 1000 µm (Backman & Paresce 1993). We incorporated scaling factors of 10, 50, and 100 to represent the relative abundance of these grain populations (see Fig. 1 and Table 3 for details). We did not consider the depletion of the smallest dust grains to the blowout grain size that results in the excess of slightly larger grains (e.g., Kim et al. 2018), as the effect of their absence on the spectral slope of the SED is negligible in the spectral range explored in this present study. To avoid the introduction of additional parameters, we set all slopes described by the exponent of the grain size distribution γ in the broken power law grain size distribution to -3.5 (Dohnanyi 1969) for all size ranges. We note that the location of the subsequent minima and maxima and their overabundance and underabun-dance may depend not only on the collisional circumstances but also on further disk parameters (e.g., Thébault & Augereau 2007; Kim et al. 2018). Thus, the location and abundance of the local minima and maxima of the size distribution may not be directly indicated by the physical situations (e.g., the collisional state of the disk).
We also note that a uniform overabundance and/or underabundance of grains of certain sizes across all spectral types may not accurately represent the actual conditions within these systems. Thus, we particularly considered grain size distributions with an overabundance and/or underabundance of certain grain sizes as a function of stellar spectral type (i.e., blowout size). For this purpose, we applied a grain size distribution model following the findings of Thébault & Augereau 2007; Kim et al. 2018, in which the first local maximum of the grain size distribution typically occurs at about 1.5 times the blowout size. Furthermore, the first minimum and second maximum are observed at around 100 and 1000 times the blowout size, respectively (see also Fig. 2 and Table 4). In the case of disks around stars that are not luminous enough to reach β = 0.5 (e.g., K and M stars in our model; Kirchschlager & Wolf 2013), we considered 0.264 µm as the minimum grain size (see also Sect. 2.1). The results based on the specifically proposed grain size distribution and concerning its impact on the corresponding SEDs in particular can be found in Sect. 4.4.
3 Results
In the following, we systematically compare and evaluate the influence of the different dust emission models based on the two different grain size distributions on the SED for the various considered debris disk systems. Specifically, we focus on quantifying the slope of the SED at long wavelengths in order to assess how the presence of over- and underabundances of the specific size of grains in the distribution impacts the emission characteristics of debris disks. For this purpose, we compute the spectral index α as
 (1)
(1)
where Fv represents the radiative flux density and v denotes the frequency in the dust continuum emission.
Considering our specific grain size distribution with overabundant small grains and a deep depletion of grains in the size range of hundreds of micrometers, we expected spectral transitions to occur at sub-millimeter to millimeter wavelengths. To characterize the SED in this wavelength range, we calculated the spectral index within two distinct wavelength ranges: 450/850 µm  and 1000/2000 µm
  . These spectral indices enabled us to quantify the differences between the two wavelength ranges represented by
  . Positive and negative values of Δα respectively indicate a lower and higher value of
  , representing a shallower and steeper slope in the 1000 to 2000 µm range compared to the 450–850 µm range, respectively.
Locations of the first and second maximum/minimum in grain size distribution depending on the central star for the simulations.
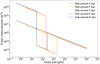 |
Fig. 2 Simulated total cross section of the dust in our debris disk around A, F, G, K, and M stars (e.g., abo ~ 1.99, 1.05, 0.43, 0.264, and 0.264 µm; red, orange, yellow, green, and blue color solid lines) based on the considered grain size distributions with exemplary cases (i.e., 100 times overabundance of small grains and underabundance of medium grains). The dashed red, orange, yellow, green, and blue color lines represent the classical single power law (reference case) around A, F, G, K, and M stars. The perturbed size distributions with an overabundance of small grains with radii ranging from the blowout size to 100 times each blowout size and one with an underabundance of medium grains with radii ranging from 100 times to 1000 times each blowout size, depending on spectral types are shown (see Table 2). These size distributions are mainly motivated by the collisional model presented in Thébault & Augereau (2007) and Kim et al. (2018). We note that the K star and M star do not have blowout sizes, suggesting the minimum grain sizes are used often in previous studies (Löhne et al. 2017; Kim et al. 2018). Thus, both grain size distributions look the same. See Table 4 for details. |
3.1 Single power law grain size distribution
We began by examining the spectral index of the SED for the continuous grain size distribution described by the single power law (i.e., γ = −3.5). This reference case allowed us to identify the influence of the over and underabundance of grains of specific sizes. The top-left plots of Figs. 3 and 4 show the resulting SED for the two different disk structures (i.e., thin belt and broad disk) depending on the spectral type of the central stars (see also Tables 5 and 6, column “OS1+UM1+SL1”). For this reference case, the SEDs show the “typical” smooth and steady decrease in the far-IR and millimeter wavelength range resulting from the steady decrease of the absorption cross section Cabs toward longer wavelengths and the steady decrease of the dust grain temperature with increasing radial distance from the central star.
The slope of the SED slightly steepens when increasing the wavelength (i.e., the value of  is slightly larger than
  ). The absolute amount of this difference between the spectral indices increases toward stars of the late spectral type. This can be explained by the shift of the wavelength of the dust emission maximum toward longer wavelengths with decreasing effective temperature of the central star. Consequently, the spectral index
  decreases, leading to an increase of the absolute value of Δα.
3.2 Broken power law grain size distribution
Next, we analyzed the spectral index of the SED for models with a discontinuous grain size distribution described by a broken power law. Our grain size distribution model is defined by three distinct groups of grains: an overabundance of small grains, a depletion of medium-sized grains, and a standard abundance of larger grains (Sect. 2.2.2). We assessed the individual impact of each group on the resulting SEDs separately.
Overabundance of small grains. Figure 3 shows the modeled SED with a broken power law grain size distribution depending on the overabundance of small grains, disk structures (thin belts and broad disks), and varying stellar sources. The corresponding spectral indices  , and their differences Δα are listed in Table 5.
We found that an overabundance of small grains leads to a modest impact on the millimeter slope of the SED, causing it to become slightly steeper (i.e., slightly higher value of  ), but the overabundance predominantly affects and steepens the far-IR slope of the SED (i.e., higher value of
  ).
).
This behavior becomes more pronounced as the overabundance of small grains increases. In particular, for models with an overabundance of small grains of a factor of 50 (0S50) – compared to the ideal collisional cascade model - we found a significant kink in the slope of the SED in the 800 to 900 µm wavelength range (see the bottom-left plot of Fig. 3).
Furthermore, we found that the spectral index transition is more pronounced in debris disks around brighter (hotter) central stars and larger disk radial extent. The systems with broader debris rings (i.e., disks that have an inner radius significantly close to the central star and an outer radius located farther out, compared to their thin-ring counterpart) exhibited a larger range of temperatures, with higher dust temperatures closer to the star resulting in stronger emissions and the location of their maximum being shifted toward shorter wavelengths. This leads to a steeper slope of the SED in the 450–850 µm wavelength range (e.g., larger absolute values of the index  ). However, compared to the impact of different abundances in the different grain size distributions, the impact of the fractional width ΔR/R on the spectral index is small.
Next, we investigated the contribution of grains in different size regimes to the observed spectral index. For this purpose, we examined their individual contributions to the total flux and thus their impact on the spectral indices (see Fig. 5). Dust particles with sizes comparable to the observing wavelength emit most efficiently in this wavelength regime (Backman & Paresce 1993). We found that small grains, which constitute a significant portion of the emitting surface area in the grain size distribution, primarily affect the spectral index  , as they efficiently reemit in the far-IR, while their contribution to the long wavelength regime, and thus their impact on
  is negligible. On the other hand, grains larger than the medium size (e.g., SL1), whose abundance is held constant in this model, have a noticeable impact on the SED and the spectral index in the millimeter range. In particular, grains larger than ~l mm, which radiate in a manner similar to black bodies at longer wavelengths, cause a shallower slope of the millimeter SED.
Underabundance of medium grains. Figure 4 shows the SED for the case of the broken power law grain size distribution depending on the underabundance of medium grains, disk structures (thin belts and broad disks), and the spectral type of the central stars. The corresponding spectral indices  and
and  and their differences Δα are listed in Table 6.
As an exemplary case, the contribution of medium grains for different levels of their underabundance to the SED is shown in Fig. 6. We found that an underabundance of medium grains leads to a slight steepening of the far-IR slope of the SED (i.e., the slightly higher value of  ). However, it primarily affects the millimeter slope of the SED, which becomes shallower, corresponding to a lower spectral index
  . Therefore, the presence of both an overabundance of small grains and an underabundance of medium grains increases the absolute difference between
  and
and  , leaving the 800–900 µm kink as a characteristic impact on the reemission SED.
However, we did not observe a significant spectral inversion solely due to the underabundance of medium grains. Thus, we conclude that the impact of the underabundance of medium grains on the spectral transition is weaker compared to the effect of the overabundance of small grains. Additionally, we found that the spectral index transition is more pronounced in debris disks around brighter (hotter) central stars and broader disk systems, which is consistent with the findings regarding the overabundance of small grains.
We note that the impact of the underabundance of medium grains could lead to a higher value of  if the disk is massive enough (e.g., more mass in the medium-to-large-sized particles). However, this model could also lead to a steeper slope of the SED at a longer wavelength (i.e., a higher value of
  )· Thus, the grain size model with the underabundance of medium grains hardly shows a noticeable spectral inversion.
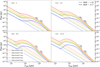 |
Fig. 3 SEDs of the case of the overabundance of small grains. Solid and dashed lines indicate the modeled SED of the dust reemission for the two different disk structures (thin belts and broad disks). The dotted lines represent the direct stellar radiation. The top-left plot shows the result based on the single power law grain size distribution (OS1+UM1+SL1), while the other three plots exhibit the results based on the broken power law grain size distribution, specifically the overabundance of small grains with the different scaling factors, 10, 50, and 100 (i.e., OS10, OS50, and OS100). See Sect. 3.2 and Table 5 for details. |
Comparison of the spectral index of the considered discontinuous grain size distributions depending on the overabundance of small grains, stellar parameters (e.g., stellar temperature and radius), and disk parameters (e.g., fractional width ΔR/R).
Comparison of the spectral index of the considered discontinuous grain size distributions depending on the underabundance of medium grains, stellar parameters (e.g., stellar temperature and radius), and disk parameters (e.g., fractional width ΔR/R).
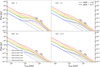 |
Fig. 4 SEDs of the case of the underabundance of medium grains. Solid and dashed lines indicate the modeled SED of the dust reemission for the two different disk structures (thin belts and broad disks). The dotted lines represent the direct stellar radiation. The top-left plot shows the result based on the single power law grain size distribution (OS1+UM1+SL1), while the other three plots exhibit the results based on the broken power law grain size distribution, specifically the underabundance of medium grains with the different scaling factors, 10, 50, and 100 (i.e., UM18, UM58, and UM100). See Sect. 3.2 and Table 6 for details. |
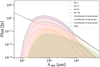 |
Fig. 5 Modeled SED of debris disks with a narrow belt (ΔR/R ~ 0.17) around an A-type star depending on the overabundance of small grains (colored dotted lines). Total emissions (i.e., net SED including the emission from the star and dust) are indicated with solid lines of the same color for the overabundant of small grains (dashed line). See Table 5 for details. |
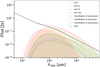 |
Fig. 6 Modeled SED of debris disks with a narrow belt (ΔR/R ~ 0.17) around an A-type star depending on the underabundance of medium grains (color dot lines). Total emissions (i.e., net SED including the emission from the star and dust) are indicated with solid lines of the same color for the underabundance of medium grains. See Table 5 for details. |
4 Discussion
4.1 Application to observations
Lestrade et al. (2020) highlighted that the spectral indices  derived from NIKA2 observations of the debris disks around Vega and HD 107146 are in agreement with the expected values in the Rayleigh-Jeans regime, consistently around 2.0 ± 0.18 to 2.0 ± 0.32. Furthermore, MacGregor et al. (2016) found that millimeter spectral indices αmm (i.e., the flux density for the complete sample at a given millimeter wavelength combined with the VLA 9 millimeter or ATCA 7 millimeter fluxes; Ricci et al. (2012, 2015a,b) have the value of 1.63 to 3.08, with mean values ~2.55, and inferred for the slope of the size distribution a range from -2.84 (e.g., HD 141569) to −3.64 (e.g., HD 104860), with the weighted mean of these values as −3.36 ± 0.02. These results indicate a shallower slope of the size distribution compared to standard collisional models. Matthews et al. (2015) also indicated a spectral index of approximately two as being desired at sub-millimeter and millimeter wavelengths for AU Mic, which is lower than expected. These findings are in contrast to the steeper spectral indices
  measured at shorter wavelengths, showing 2.8 to 2.9 (Holland et al. 2017). In general, the SONS JCMT/SCUBA2 Legacy Survey (Holland et al. 2017) found that the spectral indices
  in 48 debris disks range from 2.7 to 4.7, indicating some size distributions steeper than one based on the collisional cascade. Further spectral index inversions were observed in the debris disks around q1 Eri (i.e., from 2.90 for
  to 2.39 for
  ; Holland et al. 2017, Ricci et al. 2015b), HD 98 800 (i.e., from 3.21 for
  to 1.00 for
  ; Nilsson et al. 2010, Sylvester et al. 2001), and HD 95086 (i.e., from 3.18 for
  to 2.34 for
  ; Su et al. 2017, Ricci et al. 2015b).
Comparison of the spectral index of the considered discontinuous grain size distributions depending on the overabundance of small grains, disk parameters (e.g., fractional width ΔR/R), and ice volume fraction 𝓕ice.
4.2 Possible degeneracies with the grain composition
Variations in dust grain compositions, such as the inclusion of ice or consideration of porosity, affect the absorption and scattering efficiencies (Kim et al. 2019), thereby influencing the overall shape of the SED (Lebreton et al. 2012; Schüppler et al. 2015). To understand the effect of dust compositions on the spectral inversion and potential degeneracy, we examined the implications of altering chemical compositions, specifically by integrating crystalline water ice into icy astrosilicate mixtures (e.g., 50% ice volume fraction 𝓕ice = 0.5), and the microstruc-ture of the dust grains when introducing moderate porosity (e.g., 50% porosity 𝒫 = 0.5) through effective medium approximations (e.g., Maxwell-Garnett rule; Maxwell Garnett 1904) based on the grain size distribution described by the single power law and broken power law.
We found that a single power law grain size distribution and a broken power law grain size distribution with lower over and underabundance of small and medium grains (e.g., OS10+UM1+SL1 and OS1+UM10+SL1; see the first and second columns of Table 7, and Figs. 7 and 8) result in a decrease in the difference in their slopes (i.e., smaller Δα) and might help the situation. However, these modifications not only steepen the slope in the far-IR range but also affect the millimeter range, resulting in relatively small spectral inversions. Furthermore, both models lead to even smaller deviations in the spectral slopes, particularly with an increase in over and underabundance of small and medium grains based on the broken power law grain size distribution model (e.g., OS50+UM1+SL1 and OS1+UM50+SL1; see the third and fourth columns of Table 7, and Figs. 7 and 8). Consequently, these modifications to the dust compositions alone are insufficient to reproduce the observed spectral inversion. This indicates that the specific composition is not the sole factor responsible for the spectral inversions seen in the far-IR to millimeter ranges of debris disk SEDs.
Overall, the effect of ice inclusion seems stronger than that of porosity in cases of an increase in the over/underabundance of small/medium grains. On the other hand, for the case of underabundance of medium grains, all of our models with the modification of dust composition fail to reproduce spectral inversion, highlighting the more significant effect of a higher abundance of small grains. Moreover, the fractional width does not seem to play a significant role in these outcomes, suggesting that the spectral characteristics are largely independent of this aspect of grain size distribution. This finding is consistent with our previous results in Sect. 3.
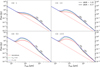 |
Fig. 7 SEDs of the case of the overabundance of small grains depending on the dust composition (ice inclusion 𝓕ice = 0·5 and porosity 𝒫 = 0.5). Solid and dashed lines indicate the modeled SED of the dust reemission for the two different disk structures (thin belts and broad disks). The dotted lines represent the direct stellar radiation from the A star. The top-left plot shows the result based on the single power law grain size distribution (OS1+UM1+SL1), while the other three plots exhibit the results based on the broken power law grain size distribution, specifically the overabundance of small grains with the different scaling factors, 10, 50, and 100 (i.e., OS10, OS58, and OS100). See Sect. 3.2 and Table 7 for details. |
4.3 Possible connection between the inferred size distribution and the collisional state of the disk
As MacGregor et al. (2016) suggested, the slope of the grain size distribution γ can be derived from the measurement of the mm spectral index αmm based on the dust opacity power law index of small particles (e.g., compared to observing wavelengths) ßs and an inferred power-law exponent from the dust temperature for each disk (i.e., spectral index of the Planck function αPL) given wavelength ranges. Since most astronomical dust compositions have very similar values of ßs (e.g., 1.5–2) and the dust temperature only affects the Planck function weakly at long wavelengths (e.g., αPL ~ 1.9–1.95 with the value of 2 as the Rayleigh-Jeans limit), αmm directly corresponds to the slope of the grain size distribution γ.
The inferred range of the parameters γ based on αmm for the overabundance of small grains from our models (e.g., ~ − 3.5 to −3.6 regardless of stellar properties and dust compositions) is in good agreement with the predictions of steady-state collisional models, both from the classical model and modern models (e.g., Dohnanyi 1969; Marshall et al. 2017), while the one from under-abundance of medium grains showing a bit shallower slopes of grain size distributions (e.g., γ ~ −3.0), which can be explained by the size dependence of the forces removing the smaller dust grains from the system (e.g., PR drag and stellar radiation).
These observational results yielded valuable insights, but they also highlight the intrinsic challenges faced in such measurements, primarily due to the typical uncertainties (e.g., around 5% to 15%) present in observational data, which lead to spectral inversions that differ by approximately 10%. These differences may stem from the varying sensitivities of telescopes as well as from the diverse calibration and reduction techniques employed to mitigate atmospheric conditions, optical flaws, and environmental sensitivity, all of which impact the accuracy and precision of observations. Additionally, our studies show variability in spectral indices, which appears to depend on the specific properties of the considered debris disks (see Sect. 3). The complexity of these factors underscores advanced solutions, which are anticipated to be addressed by the ngVLA (Next Generation Very Large Array; Di Francesco et al. 2019).
4.4 Effect of the blow-out size dependent grain size distribution on the SEDs
We also considered the grain size distribution with the overabundance and/or underabundance of different grain sizes as a function of stellar properties (i.e., blowout size; see also Sect. 2.2.2). We found that the variations in the blowout size and spectral type that are responsible for the location of the first and second maximum/minimum in the grain size distribution (see also Fig. 2 and Table 4), in turn, change the spectral slope of the SED at varying wavelength regimes (Figs. 9 and 10). For example, a grain size distribution with an overabundance of small grains in the case of an A-type star displays a change in the slope at significantly longer wavelengths (e.g., of approximately a few millimeters). On the other hand, K- and M-type stars show this impact at even shorter wavelengths (e.g., at about a few hundred micrometers; see Fig. 9). In the case of an F-type star, the results are comparable to those previously discussed in Sect. 2.2.2 because of a similar grain size distribution. These results illustrate that the location of the gap in the grain size distribution has a direct impact on the wavelength at which the slope of the SED is affected. This finding highlights the impact of the blowout size on the resulting (even sub-millimeter/millimeter) slope of the SED. Furthermore, we found that the underabun-dance of medium-sized grains has a rather weak impact on the changing slope of the SED (see Figs. 9 and 10; Tables 8; and 9), which is consistent with our previous findings discussed in Sect. 3.2.
The results discussed in this section suggest the need to constrain the slope of the SED in the different wavelength regimes in order to disentangle the impact of the spectral type from the impact of other potential physical mechanisms on the grain size distribution and thus the slope of the SED. However, we note that previous observational studies (e.g., Lestrade et al. 2020; MacGregor et al. 2016; see also Sect. 4.1) have not identified a clear dependence of the impact of stellar spectral type on the slope of the SED, showing consistent observed spectral breaks occurring at similar wavelength regions, irrespective of the central star types. For a comprehensive understanding of the grain size distribution intricacies, further investigation into the collisional evolution of debris disks based on spectral types is suggested.
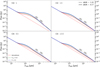 |
Fig. 8 SEDs of the case of the overabundance of small grains depending on the dust composition (ice inclusion 𝓕ice = 0.5 and porosity 𝒫 = 0.5). Solid and dashed lines indicate the modeled SED of the dust reemission for the two different disk structures (thin belts and broad disks). The dotted lines represent the direct stellar radiation from the A star. The top-left plot shows the result based on the single power law grain size distribution (OS1+UM1+SL1), while the other three plots exhibit the results based on the broken power law grain size distribution, specifically the underabundance of medium grains with the different scaling factors, 10, 50, and 100 (i.e., UM10, UM50, and UM100). See Sect. 3.2 and Table 7 for details. |
5 Summary
Motivated by the expected deviation of the grain size distribution from the often assumed continuous distribution described by a single power law, we investigated the impact of the over- and underabundance of grains in specific size regimes on the SED of debris disks. Based on a simple exemplary model, we quantified and discussed the impact of different values of over- and underabundances of submicrometer- to millimeter-sized grains in a debris dust ring with two different fractional widths ΔR/R around central stars with spectral types A, F, G, K, and M on the slope of the far-IR to millimeter SED of these systems. We described this shape and its the spectral indices  and
and  , and we discussed their differences Δα. Our key findings are the following:
The deviation of a grain size distribution from that described by a single power law can be potentially derived from the analysis of the SED in the far-IR to millimeter wavelength range. More specifically, the characteristics of the slope of the SED via spectral indices and wavelengths at which photometric data can be obtained even from ground-based telescopes appear promising. In the considered model characterized by a chosen grain size distribution, that is, the specific size range of grains for which an over- or under-abundance was assumed, we found a characteristic kink in the SED around 800–900 µm.
As the change of the slope and the wavelength range of its occurrence is directly linked to the deviation of the grain size distribution from a single power law distribution, these observations potentially provide the key for constraining the underlying physical processes leading to the specific grain size distribution. In particular, these observations provide the potential to constrain the collisional physics (e.g., material strength) of the otherwise hardly accessible properties of the larger grains (⪢cm).
The presence of both the overabundance of small grains and the underabundance of medium grains contributes to a steeper slope in the SED at the far-IR range. However, their effects differ at millimeter wavelengths. Specifically, the overabundance of small grains primarily results in a much higher value
 (i.e., steeper slope), while the
  becomes only slightly higher (i.e., a slightly steeper slope). On the other hand, the underabundance of medium grains leads to a higher value of
  (i.e., slightly steeper slope), but it primarily results in a lower value of
  (i.e., shallower slope). The impact of the overabundance of small dust particles is stronger than that of the underabundance of medium-sized dust particles.
We find that the spectral index transition is more pronounced for debris disks around brighter (i.e., early-type) central stars and broader disks. However, the disk structure, such as the fractional width of the disk system, has only a small effect on the far-IR to millimeter slope of the SED if compared to the impact of the grain size distributions.
We find that dust composition is not the sole physical mechanism responsible for the spectral inversion observed in the far-IR to (sub-)millimeter part of the SEDs of debris disk systems.
if we assume that the location of the first and second maximum and minimum of the grain size distribution depends on the blowout size and thus on the stellar spectral type, the corresponding impact on the sub-millimeter and millimeter SED is wavelength dependent. Thus, further investigations into the collisional evolution of debris disks depending on spectral types are suggested for a more comprehensive understanding of the intricacies of grain size distribution.
The inherent challenges arising from typical uncertainties in observational data, which result in varying spectral slopes, underscore the need for advanced future observations, such as those provided by ngVLA.
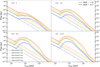 |
Fig. 9 SEDs of the case of the overabundance of small grains depending on the stellar properties (i.e., blowout sizes). Solid and dashed lines indicate the modeled SED of the dust reemission for the two different disk structures (thin belts and broad disks). The dotted lines represent the direct stellar radiations. The top-left plot shows the result based on the single power law grain size distribution (OS1+UM1+SL1), while the other three plots exhibit the results based on the broken power law grain size distribution, specifically the overabundance of small grains with the different scaling factors, 10, 50, and 100 (i.e., OS10, OS50, and OS100). See Table 4 and Fig. 2 for the proposed grain size distributions depending on the central star and blowout sizes (Thébault & Augereau 2007; Kim et al. 2018). |
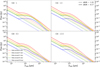 |
Fig. 10 SEDs of the case of the underabundance of medium grains depending on the stellar properties (i.e., blowout sizes). Solid and dashed lines indicate the modeled SED of the dust reemission for the two different disk structures (thin belts and broad disks). The dotted lines represent the direct stellar radiations. The top-left plot shows the result based on the single power law grain size distribution (OS1+UM1+SL1), while the other three plots exhibit the results based on the broken power law grain size distribution, specifically the underabundance of medium grains with the different scaling factors, 10, 50, and 100 (i.e., UM10, UM50, and UM100). See Table 4 and Fig. 2 for the proposed grain size distributions depending on the central star and blowout sizes (Thébault & Augereau 2007; Kim et al. 2018). |
Acknowledgements
The authors thank J.-F. Lestrade for fruitful discussions on the modeling of specific grain size distribution in this study. M.K. gratefully acknowledges the funding from the Royal Society. M.K. and S.W. gratefully acknowledge the financial support by the Deutsche Forschungsgemeinschaft under contracts WO 857/15-1 and WO 857/15-2 (DFG).
References
- Artymowicz, P., & Clampin, M. 1997, ApJ, 490, 863 [NASA ADS] [CrossRef] [Google Scholar]
- Augereau, J. C., & Beust, H. 2006, A&A, 455, 987 [NASA ADS] [CrossRef] [EDP Sciences] [Google Scholar]
- Backman, D. E., & Paresce, F. 1993, in Protostars and Planets III, eds. E. H. Levy, & J. I. Lunine, 1253 [Google Scholar]
- Brunngräber, R., & Wolf, S. 2021, A&A, 648, A87 [NASA ADS] [CrossRef] [EDP Sciences] [Google Scholar]
- Bürger, J., Glißmann, T., Lethuillier, A., et al. 2023, MNRAS, 519, 641 [Google Scholar]
- Cataldi, G. 2016, PhD thesis, Stockholm University, Sweden [Google Scholar]
- Di Francesco, J., Chalmers, D., Denman, N., et al. 2019, in Canadian Long Range Plan for Astronomy and Astrophysics White Papers, 2020, 32 [Google Scholar]
- Dohnanyi, J. S. 1969, J. Geophys. Res., 74, 2531 [Google Scholar]
- Donati, J. F., Cristofari, P. I., Finociety, B., et al. 2023, MNRAS, 525, 455 [NASA ADS] [CrossRef] [Google Scholar]
- Draine, B. T. 2003, ApJ, 598, 1026 [Google Scholar]
- Ertel, S., Wolf, S., Metchev, S., et al. 2011, A&A, 533, A132 [NASA ADS] [CrossRef] [EDP Sciences] [Google Scholar]
- Gray, R. O., Corbally, C. J., Garrison, R. F., et al. 2006, AJ, 132, 161 [Google Scholar]
- Greaves, J. S., Holland, W. S., Wyatt, M. C., et al. 2005, ApJ, 619, L187 [NASA ADS] [CrossRef] [Google Scholar]
- Holland, W. S., Matthews, B. C., Kennedy, G. M., et al. 2017, MNRAS, 470, 3606 [NASA ADS] [CrossRef] [Google Scholar]
- Kalas, P., Graham, J. R., Clampin, M. C., & Fitzgerald, M. P. 2006, ApJ, 637, L57 [NASA ADS] [CrossRef] [Google Scholar]
- Kervella, P., Thévenin, F., Morel, P., et al. 2004, in Stars as Suns: Activity, Evolution and Planets, 219, eds. A. K. Dupree, & A. O. Benz, 80 [NASA ADS] [Google Scholar]
- Kim, M., Wolf, S., Löhne, T., Kirchschlager, F., & Krivov, A. V. 2018, A&A, 618, A38 [NASA ADS] [CrossRef] [EDP Sciences] [Google Scholar]
- Kim, M., Wolf, S., Potapov, A., Mutschke, H., & Jäger, C. 2019, A&A, 629, A141 [NASA ADS] [CrossRef] [EDP Sciences] [Google Scholar]
- Kirchschlager, F., & Wolf, S. 2013, A&A, 552, A54 [NASA ADS] [CrossRef] [EDP Sciences] [Google Scholar]
- Krivov, A. V., Löhne, T., & Sremcevic, M. 2006, A&A, 455, 509 [NASA ADS] [CrossRef] [EDP Sciences] [Google Scholar]
- Lebreton, J., Augereau, J. C., Thi, W. F., et al. 2012, A&A, 539, A17 [NASA ADS] [CrossRef] [EDP Sciences] [Google Scholar]
- Lestrade, J.-F., & Thilliez, E. 2015, A&A, 576, A72 [NASA ADS] [CrossRef] [EDP Sciences] [Google Scholar]
- Lestrade, J. F., Augereau, J. C., Booth, M., et al. 2020, in Eur. Phys. J. Web Conf., 228, 00015 [NASA ADS] [CrossRef] [EDP Sciences] [Google Scholar]
- Löhne, T., Krivov, A. V., Kirchschlager, F., Sende, J. A., & Wolf, S. 2017, A&A, 605, A7 [Google Scholar]
- MacGregor, M. A., Wilner, D. J., Chandler, C., et al. 2016, ApJ, 823, 79 [Google Scholar]
- Mamajek, E. E. 2012, ApJ, 754, L20 [Google Scholar]
- Marino, S., Carpenter, J., Wyatt, M. C., et al. 2018, MNRAS, 479, 5423 [NASA ADS] [CrossRef] [Google Scholar]
- Marino, S., Zurlo, A., Faramaz, V., et al. 2020, MNRAS, 498, 1319 [Google Scholar]
- Marshall, J. P., Maddison, S. T., Thilliez, E., et al. 2017, MNRAS, 468, 2719 [NASA ADS] [CrossRef] [Google Scholar]
- Matrà, L., Marino, S., Kennedy, G. M., et al. 2018, ApJ, 859, 72 [Google Scholar]
- Matthews, B. C., Kennedy, G., Sibthorpe, B., et al. 2015, ApJ, 811, 100 [NASA ADS] [CrossRef] [Google Scholar]
- Maxwell Garnett, J. C. 1904, Philos. Trans. Roy. Soc. Lond. Ser. A, 203, 385 [NASA ADS] [CrossRef] [Google Scholar]
- Nilsson, R., Liseau, R., Brandeker, A., et al. 2010, A&A, 518, A40 [NASA ADS] [CrossRef] [EDP Sciences] [Google Scholar]
- Olofsson, J., Thébault, P., Bayo, A., et al. 2023, A&A, 674, A84 [NASA ADS] [CrossRef] [EDP Sciences] [Google Scholar]
- Pawellek, N., Wyatt, M., Matrà, L., Kennedy, G., & Yelverton6, B. 2021, MNRAS, 502, 5390 [NASA ADS] [CrossRef] [Google Scholar]
- Plavchan, P., Jura, M., & Lipscy, S. J. 2005, ApJ, 631, 1161 [NASA ADS] [CrossRef] [Google Scholar]
- Reiners, A. 2006, A&A, 446, 267 [NASA ADS] [CrossRef] [EDP Sciences] [Google Scholar]
- Rhee, J. H., Song, I., Zuckerman, B., & McElwain, M. 2007, ApJ, 660, 1556 [Google Scholar]
- Ricci, L., Testi, L., Maddison, S. T., & Wilner, D. J. 2012, A&A, 539, L6 [NASA ADS] [CrossRef] [EDP Sciences] [Google Scholar]
- Ricci, L., Carpenter, J. M., Fu, B., et al. 2015a, ApJ, 798, 124 [NASA ADS] [CrossRef] [Google Scholar]
- Ricci, L., Maddison, S. T., Wilner, D., et al. 2015b, ApJ, 813, 138 [NASA ADS] [CrossRef] [Google Scholar]
- Rodigas, T. J., Stark, C. C., Weinberger, A., et al. 2015, ApJ, 798, 96 [Google Scholar]
- Schüppler, C., Löhne, T., Krivov, A. V., et al. 2015, A&A, 581, A97 [Google Scholar]
- Su, K. Y. L., MacGregor, M. A., Booth, M., et al. 2017, AJ, 154, 225 [CrossRef] [Google Scholar]
- Sylvester, R. J., Dunkin, S. K., & Barlow, M. J. 2001, MNRAS, 327, 133 [Google Scholar]
- Thébault, P., & Augereau, J. C. 2007, A&A, 472, 169 [NASA ADS] [CrossRef] [EDP Sciences] [Google Scholar]
- Watson, C. A., Littlefair, S. P., Diamond, C., et al. 2011, MNRAS, 413, L71 [Google Scholar]
- Wolf, S., & Voshchinnikov, N. V. 2004, Comput. Phys. Commun., 162, 113 [Google Scholar]
- Wyatt, M. C., & Dent, W. R. F. 2002, MNRAS, 334, 589 [NASA ADS] [CrossRef] [Google Scholar]
All Tables
Stellar, disk, and dust model parameters for the simulations and their reference.
Locations of the first and second maximum/minimum in grain size distribution depending on the central star for the simulations.
Comparison of the spectral index of the considered discontinuous grain size distributions depending on the overabundance of small grains, stellar parameters (e.g., stellar temperature and radius), and disk parameters (e.g., fractional width ΔR/R).
Comparison of the spectral index of the considered discontinuous grain size distributions depending on the underabundance of medium grains, stellar parameters (e.g., stellar temperature and radius), and disk parameters (e.g., fractional width ΔR/R).
Comparison of the spectral index of the considered discontinuous grain size distributions depending on the overabundance of small grains, disk parameters (e.g., fractional width ΔR/R), and ice volume fraction 𝓕ice.
All Figures
|
Fig. 1 Simulated total cross section of the dust in our debris disk around the A star (e.g., abo ~ 1.99 µm) based on the considered grain size distributions. The red solid line represents the classical single power law (reference case; see Sect. 2.2.1). The yellow, green, and blue dashed lines represent the perturbed size distribution with an overabundance of grains with radii ranging from the blowout size (see Table 2) to 100 µm. The purple, gray, and navy dashed lines represent the distribution with the underabundance in the size range of 100 µm to 1000 µm, which are mainly motivated by the collisional model presented in Thébault & Augereau (2007) and Kim et al. (2018). |
| In the text | |
|
Fig. 2 Simulated total cross section of the dust in our debris disk around A, F, G, K, and M stars (e.g., abo ~ 1.99, 1.05, 0.43, 0.264, and 0.264 µm; red, orange, yellow, green, and blue color solid lines) based on the considered grain size distributions with exemplary cases (i.e., 100 times overabundance of small grains and underabundance of medium grains). The dashed red, orange, yellow, green, and blue color lines represent the classical single power law (reference case) around A, F, G, K, and M stars. The perturbed size distributions with an overabundance of small grains with radii ranging from the blowout size to 100 times each blowout size and one with an underabundance of medium grains with radii ranging from 100 times to 1000 times each blowout size, depending on spectral types are shown (see Table 2). These size distributions are mainly motivated by the collisional model presented in Thébault & Augereau (2007) and Kim et al. (2018). We note that the K star and M star do not have blowout sizes, suggesting the minimum grain sizes are used often in previous studies (Löhne et al. 2017; Kim et al. 2018). Thus, both grain size distributions look the same. See Table 4 for details. |
| In the text | |
|
Fig. 3 SEDs of the case of the overabundance of small grains. Solid and dashed lines indicate the modeled SED of the dust reemission for the two different disk structures (thin belts and broad disks). The dotted lines represent the direct stellar radiation. The top-left plot shows the result based on the single power law grain size distribution (OS1+UM1+SL1), while the other three plots exhibit the results based on the broken power law grain size distribution, specifically the overabundance of small grains with the different scaling factors, 10, 50, and 100 (i.e., OS10, OS50, and OS100). See Sect. 3.2 and Table 5 for details. |
| In the text | |
|
Fig. 4 SEDs of the case of the underabundance of medium grains. Solid and dashed lines indicate the modeled SED of the dust reemission for the two different disk structures (thin belts and broad disks). The dotted lines represent the direct stellar radiation. The top-left plot shows the result based on the single power law grain size distribution (OS1+UM1+SL1), while the other three plots exhibit the results based on the broken power law grain size distribution, specifically the underabundance of medium grains with the different scaling factors, 10, 50, and 100 (i.e., UM18, UM58, and UM100). See Sect. 3.2 and Table 6 for details. |
| In the text | |
|
Fig. 5 Modeled SED of debris disks with a narrow belt (ΔR/R ~ 0.17) around an A-type star depending on the overabundance of small grains (colored dotted lines). Total emissions (i.e., net SED including the emission from the star and dust) are indicated with solid lines of the same color for the overabundant of small grains (dashed line). See Table 5 for details. |
| In the text | |
|
Fig. 6 Modeled SED of debris disks with a narrow belt (ΔR/R ~ 0.17) around an A-type star depending on the underabundance of medium grains (color dot lines). Total emissions (i.e., net SED including the emission from the star and dust) are indicated with solid lines of the same color for the underabundance of medium grains. See Table 5 for details. |
| In the text | |
|
Fig. 7 SEDs of the case of the overabundance of small grains depending on the dust composition (ice inclusion 𝓕ice = 0·5 and porosity 𝒫 = 0.5). Solid and dashed lines indicate the modeled SED of the dust reemission for the two different disk structures (thin belts and broad disks). The dotted lines represent the direct stellar radiation from the A star. The top-left plot shows the result based on the single power law grain size distribution (OS1+UM1+SL1), while the other three plots exhibit the results based on the broken power law grain size distribution, specifically the overabundance of small grains with the different scaling factors, 10, 50, and 100 (i.e., OS10, OS58, and OS100). See Sect. 3.2 and Table 7 for details. |
| In the text | |
|
Fig. 8 SEDs of the case of the overabundance of small grains depending on the dust composition (ice inclusion 𝓕ice = 0.5 and porosity 𝒫 = 0.5). Solid and dashed lines indicate the modeled SED of the dust reemission for the two different disk structures (thin belts and broad disks). The dotted lines represent the direct stellar radiation from the A star. The top-left plot shows the result based on the single power law grain size distribution (OS1+UM1+SL1), while the other three plots exhibit the results based on the broken power law grain size distribution, specifically the underabundance of medium grains with the different scaling factors, 10, 50, and 100 (i.e., UM10, UM50, and UM100). See Sect. 3.2 and Table 7 for details. |
| In the text | |
|
Fig. 9 SEDs of the case of the overabundance of small grains depending on the stellar properties (i.e., blowout sizes). Solid and dashed lines indicate the modeled SED of the dust reemission for the two different disk structures (thin belts and broad disks). The dotted lines represent the direct stellar radiations. The top-left plot shows the result based on the single power law grain size distribution (OS1+UM1+SL1), while the other three plots exhibit the results based on the broken power law grain size distribution, specifically the overabundance of small grains with the different scaling factors, 10, 50, and 100 (i.e., OS10, OS50, and OS100). See Table 4 and Fig. 2 for the proposed grain size distributions depending on the central star and blowout sizes (Thébault & Augereau 2007; Kim et al. 2018). |
| In the text | |
|
Fig. 10 SEDs of the case of the underabundance of medium grains depending on the stellar properties (i.e., blowout sizes). Solid and dashed lines indicate the modeled SED of the dust reemission for the two different disk structures (thin belts and broad disks). The dotted lines represent the direct stellar radiations. The top-left plot shows the result based on the single power law grain size distribution (OS1+UM1+SL1), while the other three plots exhibit the results based on the broken power law grain size distribution, specifically the underabundance of medium grains with the different scaling factors, 10, 50, and 100 (i.e., UM10, UM50, and UM100). See Table 4 and Fig. 2 for the proposed grain size distributions depending on the central star and blowout sizes (Thébault & Augereau 2007; Kim et al. 2018). |
| In the text | |
Current usage metrics show cumulative count of Article Views (full-text article views including HTML views, PDF and ePub downloads, according to the available data) and Abstracts Views on Vision4Press platform.
Data correspond to usage on the plateform after 2015. The current usage metrics is available 48-96 hours after online publication and is updated daily on week days.
Initial download of the metrics may take a while.