Fig. 1
Download original image
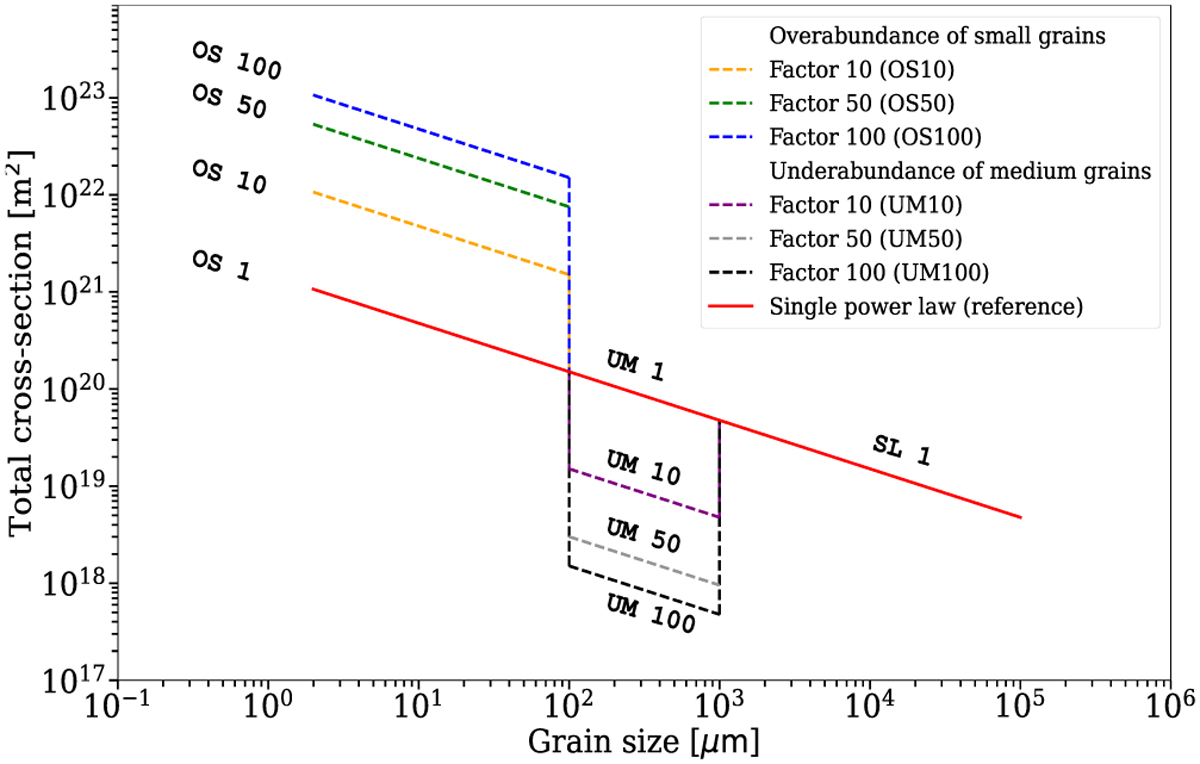
Simulated total cross section of the dust in our debris disk around the A star (e.g., abo ~ 1.99 µm) based on the considered grain size distributions. The red solid line represents the classical single power law (reference case; see Sect. 2.2.1). The yellow, green, and blue dashed lines represent the perturbed size distribution with an overabundance of grains with radii ranging from the blowout size (see Table 2) to 100 µm. The purple, gray, and navy dashed lines represent the distribution with the underabundance in the size range of 100 µm to 1000 µm, which are mainly motivated by the collisional model presented in Thébault & Augereau (2007) and Kim et al. (2018).
Current usage metrics show cumulative count of Article Views (full-text article views including HTML views, PDF and ePub downloads, according to the available data) and Abstracts Views on Vision4Press platform.
Data correspond to usage on the plateform after 2015. The current usage metrics is available 48-96 hours after online publication and is updated daily on week days.
Initial download of the metrics may take a while.