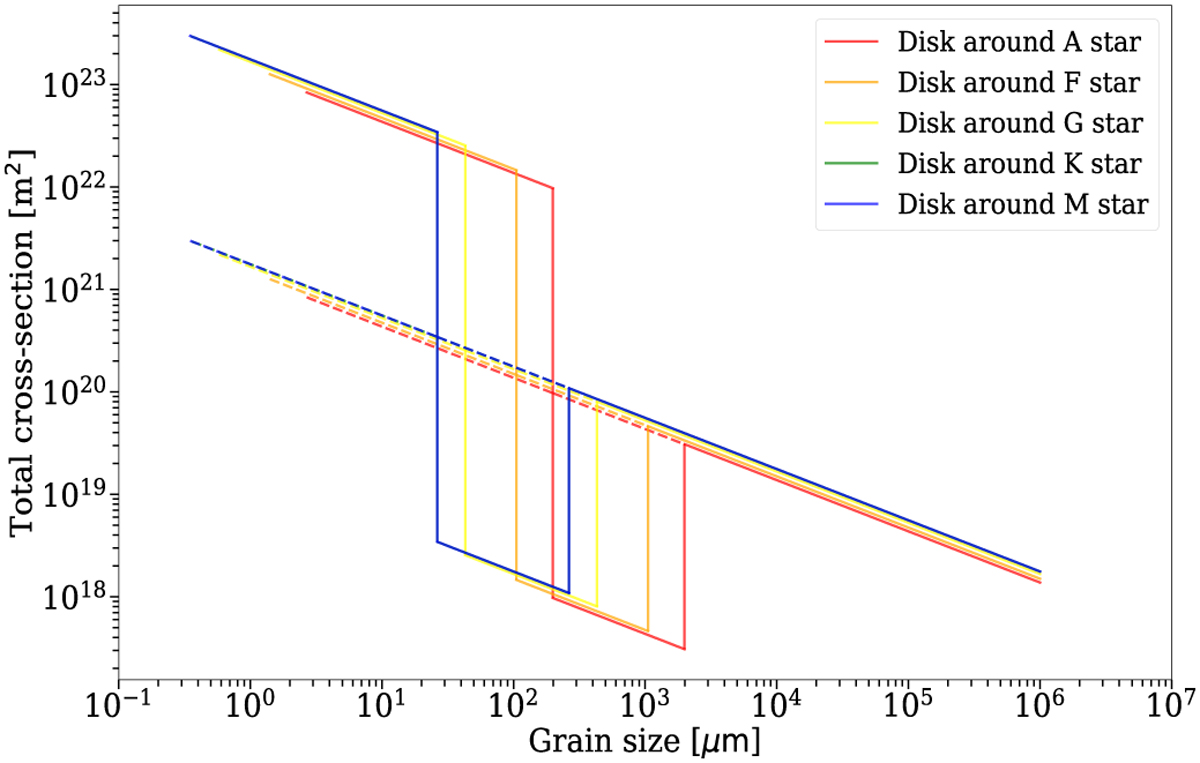
Fig. 2
Download original image
Simulated total cross section of the dust in our debris disk around A, F, G, K, and M stars (e.g., abo ~ 1.99, 1.05, 0.43, 0.264, and 0.264 µm; red, orange, yellow, green, and blue color solid lines) based on the considered grain size distributions with exemplary cases (i.e., 100 times overabundance of small grains and underabundance of medium grains). The dashed red, orange, yellow, green, and blue color lines represent the classical single power law (reference case) around A, F, G, K, and M stars. The perturbed size distributions with an overabundance of small grains with radii ranging from the blowout size to 100 times each blowout size and one with an underabundance of medium grains with radii ranging from 100 times to 1000 times each blowout size, depending on spectral types are shown (see Table 2). These size distributions are mainly motivated by the collisional model presented in Thébault & Augereau (2007) and Kim et al. (2018). We note that the K star and M star do not have blowout sizes, suggesting the minimum grain sizes are used often in previous studies (Löhne et al. 2017; Kim et al. 2018). Thus, both grain size distributions look the same. See Table 4 for details.
Current usage metrics show cumulative count of Article Views (full-text article views including HTML views, PDF and ePub downloads, according to the available data) and Abstracts Views on Vision4Press platform.
Data correspond to usage on the plateform after 2015. The current usage metrics is available 48-96 hours after online publication and is updated daily on week days.
Initial download of the metrics may take a while.