Fig. 9
Download original image
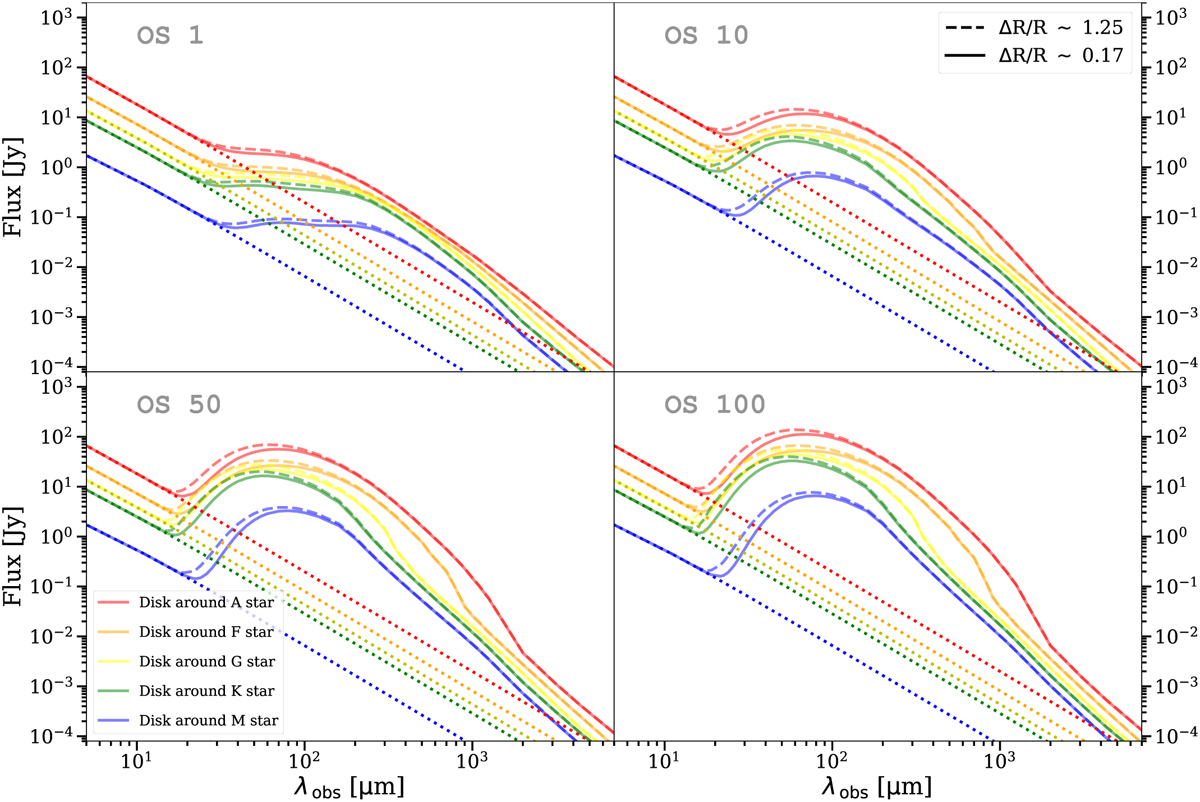
SEDs of the case of the overabundance of small grains depending on the stellar properties (i.e., blowout sizes). Solid and dashed lines indicate the modeled SED of the dust reemission for the two different disk structures (thin belts and broad disks). The dotted lines represent the direct stellar radiations. The top-left plot shows the result based on the single power law grain size distribution (OS1+UM1+SL1), while the other three plots exhibit the results based on the broken power law grain size distribution, specifically the overabundance of small grains with the different scaling factors, 10, 50, and 100 (i.e., OS10, OS50, and OS100). See Table 4 and Fig. 2 for the proposed grain size distributions depending on the central star and blowout sizes (Thébault & Augereau 2007; Kim et al. 2018).
Current usage metrics show cumulative count of Article Views (full-text article views including HTML views, PDF and ePub downloads, according to the available data) and Abstracts Views on Vision4Press platform.
Data correspond to usage on the plateform after 2015. The current usage metrics is available 48-96 hours after online publication and is updated daily on week days.
Initial download of the metrics may take a while.