Fig. 6
Download original image
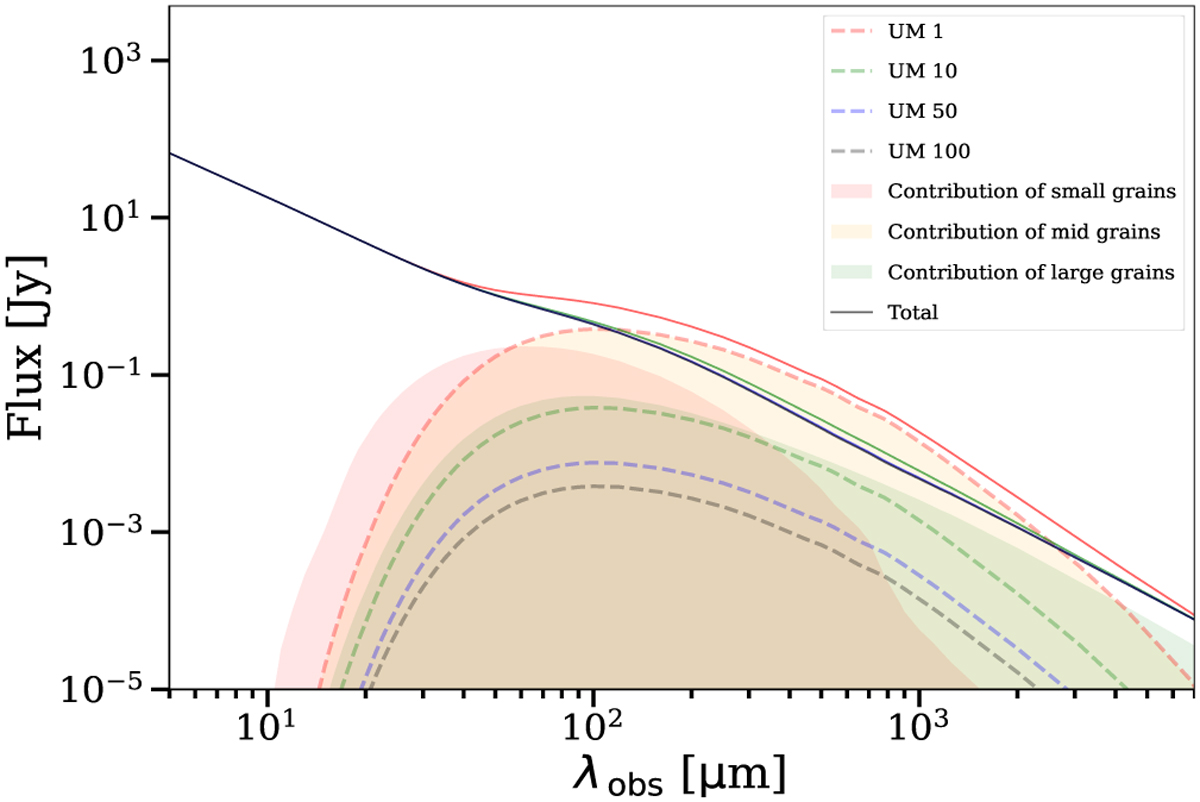
Modeled SED of debris disks with a narrow belt (ΔR/R ~ 0.17) around an A-type star depending on the underabundance of medium grains (color dot lines). Total emissions (i.e., net SED including the emission from the star and dust) are indicated with solid lines of the same color for the underabundance of medium grains. See Table 5 for details.
Current usage metrics show cumulative count of Article Views (full-text article views including HTML views, PDF and ePub downloads, according to the available data) and Abstracts Views on Vision4Press platform.
Data correspond to usage on the plateform after 2015. The current usage metrics is available 48-96 hours after online publication and is updated daily on week days.
Initial download of the metrics may take a while.