| Issue |
A&A
Volume 682, February 2024
|
|
|---|---|---|
| Article Number | L17 | |
| Number of page(s) | 6 | |
| Section | Letters to the Editor | |
| DOI | https://doi.org/10.1051/0004-6361/202449252 | |
| Published online | 20 February 2024 | |
Letter to the Editor
JWST reveals a high fraction of disk breaks at 1 ≤ z ≤ 3
1
Department of Astronomy, Peking University, 5 Yiheyuan Road, Haidian District, Beijing 100871, PR China
2
The Kavli Institute for Astronomy and Astrophysics, Peking University, 5 Yiheyuan Road, Haidian District, Beijing 100871, PR China
3
Max-Planck-Institut für Radioastronomie, Auf dem Hügel 69, 53121 Bonn, Germany
e-mail: This email address is being protected from spambots. You need JavaScript enabled to view it.
; This email address is being protected from spambots. You need JavaScript enabled to view it.
Received:
17
January
2024
Accepted:
6
February
2024
Abstract
We analyzed the deconvolved surface brightness profiles of 247 massive and angularly large disk galaxies at 1 ≤ z ≤ 3 to study high-redshift disk breaks, using F356W-band images from the Cosmic Evolution Early Release Science survey (CEERS). We found that 12.6% of these galaxies exhibit type I (exponential) profiles, 56.7% exhibit type II (down-bending) profiles, and 34.8% exhibit type III (up-bending) profiles. Moreover, we showed that galaxies that are more massive, centrally concentrated, or redder, tend to show fewer type II and more type III breaks. These fractions and the detected dependencies on galaxy properties are in good agreement with those observed in the Local Universe. In particular, the ratio of the type II disk break radius to the bar radius in barred galaxies typically peaks at a value of 2.25, perhaps due to bar-induced radial migration. However, the timescale for secular evolution may be too lengthy to explain the observed breaks at such high redshifts. Instead, violent disk instabilities may be responsible, where spiral arms and clumps torque fling out the material, leading to the formation of outer exponential disks. Our results provide further evidence for the assertion that the Hubble Sequence was already in place during these early periods.
Key words: galaxies: evolution / galaxies: high-redshift / galaxies: photometry / galaxies: structure
© The Authors 2024
 Open Access article, published by EDP Sciences, under the terms of the Creative Commons Attribution License (https://creativecommons.org/licenses/by/4.0), which permits unrestricted use, distribution, and reproduction in any medium, provided the original work is properly cited.
This article is published in open access under the Subscribe to Open model.
Open access funding provided by Max Planck Society.
1. Introduction
The radial distribution of stars in galaxy disks has been widely described by an exponential function (de Vaucouleurs 1958, 1959; Freeman 1970) that may be a result of the redistribution of mass and angular momentum due to viscosity (Lin & Pringle 1987). Although an exponential function provides on average a reasonably successful description, numerous recent works have pointed out that the outer regions of many galaxies deviate from this simple functional form and could instead be better parameterized by a double exponential function (Erwin et al. 2005, 2008; Pohlen & Trujillo 2006; Gutiérrez et al. 2011; Laine et al. 2014; Watkins et al. 2019; Tang et al. 2020).
Following the nomenclature of Freeman (1970), which was further developed by Pohlen & Trujillo (2006) and Erwin et al. (2008), the disk surface brightness profiles are divided primarily into three types: type I, which aptly follows a single exponential function; type II, which is best fitted by a double exponential function with a steeper slope in the outer profile; and type III, best described by a double exponential function with a shallower slope in the outer profile. There are approximately 70%–80% nearby disk galaxies having type II or III disk breaks (Pohlen & Trujillo 2006; Erwin et al. 2008; Gutiérrez et al. 2011; Laine et al. 2014; Tang et al. 2020). It has been found that type II disks are more prevalent in late-type galaxies, while type III disk breaks occur more frequently in early-type systems (Pohlen & Trujillo 2006; Erwin et al. 2008; Gutiérrez et al. 2011; Laine et al. 2016; Tang et al. 2020). Furthermore, the fraction of type II profiles present in cluster disk galaxies is suppressed in comparison to those found in field galaxies (Erwin et al. 2012; Roediger et al. 2012; Raj et al. 2019; Pfeffer et al. 2022; but see Pranger et al. 2017). Type II disk are likely caused by a threshold in molecular surface density for forming new stars (Kennicutt 1989; Martin & Kennicutt 2001; Schaye 2004; Elmegreen & Hunter 2006), radial migration driven by bars or spirals (Sellwood & Binney 2002; Debattista et al. 2006; Bakos et al. 2008; Roškar et al. 2008; Minchev et al. 2012; Di Matteo et al. 2013), or disk instabilities in the earlier Universe (Bournaud et al. 2007). In contrast, relatively little is known about the origins of type III disks. Proposed scenarios have included mergers (Bekki 1998), tidal disturbances (e.g., Watkins et al. 2019), confusion with a stellar halo (Martín-Navarro et al. 2012, 2014; Peters et al. 2017), and in situ star formation due to gas accretion (Wang et al. 2018).
Thanks to the Hubble Space Telescope (HST), galaxies exhibiting disk breaks at intermediate redshifts (z ≲ 1) have been found (Pérez 2004; Trujillo & Pohlen 2005; Azzollini et al. 2008; Bakos et al. 2008; Borlaff et al. 2018). However, the exploration of disk breaks at higher redshifts (z ≳ 1) using HST has been limited, due to the clumpy nature of high-redshift galaxies observed by HST (Conselice et al. 2008; Mortlock et al. 2013). Recent studies, leveraging the unprecedented sensitivity and resolution of the James Webb Space Telescope (JWST) in the infrared, have revealed that a substantial fraction of high-redshift galaxies are regular disks, rather than being predominantly clumpy (Ferreira et al. 2022, 2023; Kartaltepe et al. 2023). These galaxies display features such as spirals and bars, as seen in nearby galaxies (Chen et al. 2022; Fudamoto et al. 2022; Guo et al. 2023; Le Conte et al. 2023). These findings raise new questions about the occurrence and frequency of disk breaks in galaxies at high redshifts. These answers may contribute to our understanding of galaxy evolution. To investigate these questions further in this work, we analyze the surface brightness profiles of disk galaxies observed by JWST at redshifts 1 ≤ z ≤ 3.
2. Data and sample
We analyzed the galaxies observed in the Cosmic Evolution Early Release Science (CEERS) Survey (PI: Finkelstein, ID = 1345, Finkelstein et al. 2022). The sample selection criteria were based on redshift, rest-frame color, and stellar mass from the 3D-HST catalog (Brammer et al. 2012; Skelton et al. 2014). We focused on galaxies with redshifts of 1 ≤ z ≤ 3 and stellar masses of M* ≥ 1010 M⊙. The diagram of rest-frame V − J versus rest-frame U − V, along with the demarcation line proposed by Williams et al. (2009), were used to identify star-forming galaxies, most of which are disk galaxies. We utilized the mosaic image product provided by the DAWN JWST Archive (Valentino et al. 2023)1. We use WebbPSF (version 1.2.1, Perrin et al. 2014) to construct the point spread function (PSF). Specifically, this study employs the F356W-band mosaic images for their effectiveness in tracing older stellar populations, whereas the F444W band is avoided due to its broader PSF that tends to smooth out the disk structure further. This uniform use of the F356W band also minimizes uncertainties associated with deconvolution. Galaxies that are spheroidal in shape, those located at the edges of the mosaic image, and those affected by significant light contamination from nearby sources are excluded upon visual inspection. We measured the axis ratio (b/a) and half-light radius (R50) for each galaxy and then further restricted our selection to galaxies with b/a ≥ 0.5 to avoid severe projection effects and those with R50 ≥ 2 × FWHM for obtaining accurate deconvolved surface brightness profiles. The deconvolution is elaborated in the following section. Our sample selection results in a final sample of 247 galaxies.
3. Deconvolution of surface brightness profiles and classification of disk breaks
As galaxies at higher redshifts become angularly smaller due to longer cosmological distance or intrinsic size evolution, their structures become more blurred because of the PSF smoothing effect (e.g., Liang et al. 2023). This PSF effect leads to a flattening of the observed surface brightness profile, especially in galaxies at high redshifts. Therefore, deconvolution is essential to minimize the PSF smoothing effect and recover the intrinsic surface brightness profiles of these galaxies. The Richardson-Lucy algorithm (Richardson 1972; Lucy 1974), a popular deconvolution method, can severely amplify noise and introduce artificial flux in low surface brightness regions, making it unsuitable for studying surface brightness profiles. Alternatively, we deconvolved galaxy images throughout a 2D model fitting process, adapting the strategy used in Trujillo & Fliri (2016). For each galaxy image, we use sep (Barbary 2016) to generate a mask to avoid contamination from other sources. By involving the F356W PSF, we use imcascade, developed by Miller & van Dokkum (2021), to fit the galaxy using their multi-Gaussian expansion method to obtain the intrinsic galaxy model that has no PSF effects. The deconvolved image is obtained by subtracting the intrinsic model convolved with the PSF from the original image and then adding the intrinsic model back to the residual. This process effectively minimizes the contribution of the PSF, facilitating the extraction of deconvolved surface brightness profiles, yet it cannot deconvolve finer local structures, such as spiral arms. The center from the fitting is taken as the galaxy center, while the b/a and position angle (PA) are measured on the outskirts of the galaxy using isophotes. With fixed galaxy center, b/a, and PA, we use photutils (Bradley et al. 2020) to extract azimuthally averaged surface brightness profiles from the deconvolved images.
In Fig. 1, we illustrate the effectiveness and the limitations of the deconvolution process using the r-band images of ESO 112-005, which exhibits a type I profile (top), and NGC 12, showcasing a type II profile (bottom), as cleaned of stars and provided by Yu et al. (2023). The left panels show the intrinsic profiles extracted from the high-resolution stars-cleaned images. The panels in the subsequent columns illustrate the profiles before and after deconvolution, represented by dashed and solid curves, respectively. These comparisons are made using simulated images with various ratios of R50 to the F356W FWHM. The effect of convolution tends to smooth the surface brightness profiles, transforming them into apparent type I profiles. The dashed curves in the bottom panels illustrate how, in the absence of deconvolution, an intrinsic type II profile could be mistakenly identified as a type I profile. When R50 ≥ 2 × FWHM, the deconvolved profiles closely resemble the intrinsic profile, including a similar disk break. In contrast, for R50 ≤ 1 × FWHM, the deconvolved profile is highly non-exponential, with a slope that changes across the entire radial extent, and thus fails to reconstruct the intrinsic profile with its characteristic break. Therefore, the deconvolution is most effective when R50 ≥ 2 × FWHM, a criterion that has been adopted for sample selection in Sect. 2.
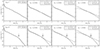 |
Fig. 1. Illustration of the deconvolved surface brightness profiles. The left two panels illustrate the intrinsic profiles obtained from high-resolution images of nearby galaxies, featuring ESO 112-005 at the top and NGC 12 at the bottom, respectively. The panels in the subsequent columns present the profiles extracted from artificial downsized images convolved with the JWST F356W PSF, indicated by dashed curves, and present the deconvolved profiles, shown as solid curves. The resolution of the artificial image is indicated by the ratio of galaxy half-light radius (R50) to PSF FWHM, denoted at the top of the panel. The arrow denotes the disk break seen in the intrinsic profile. |
We identified bars by searching local peaks in the isophotal ellipcity profile (e.g., Erwin & Sparke 2003; Yu et al. 2022; Liang et al. 2023), leading to a bar fraction of 42%, and then measured their bar radius (Rbar). The ellipticity-drop method is deprecated for high-redshift galaxies due to the smoothing of drops into peaks by PSF (Liang et al. 2023). Following the classification scheme of Pohlen & Trujillo (2006) and Erwin et al. (2008), we classify the surface brightness profiles using three main types: type I (exponential), type II (down-bending), and type III (up-bending), with a combination of type II and III (mixed types) in case of multiple breaks. The process involved manually determining the disk regions above the surface brightness limit, generally above 28 mag arcsec−2, and fitting one or more exponential functions to the profile; disk breaks were identified if the scale length ratio of two adjacent exponentials was greater than 1.1 or less than 0.9 (Wang et al. 2018), and the break radius (Rbrk) was determined at the intersection point of these exponentials, with its uncertainty estimated by assigning a 20% uncertainty to the selected regions and re-fitting. In barred galaxies, type II profiles are further divided into inner break type II.i and outer break type II.o, depending on whether the disk break radius is beyond the bar radius. For simplicity, we classify the type II.o profiles as type II, the same class as the type II profiles in unbarred galaxies. Examples of three CEERS disk galaxies at z > 2, showcasing type I, II, and III profiles are illustrated in the top, middle, and bottom panels of Fig. 2.
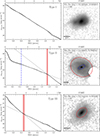 |
Fig. 2. Classification of the deconvolved disk profiles into three types: type I (exponential; top), type II (down-bending; middle), and type III (up-bending; bottom). The left panels plot the deconvolved surface brightness profiles as a function of semi-major axis (SMA) extracted from deconvolved images. In these, the blue dashed-point line marks the measured bar radius (if present), and the solid red line indicates the identified disk break radius. The dashed lines represent the best-fit exponential functions. On the right, the panels display the deconvolved F356W-band images, with overplotted ellipses corresponding to the bar radius (if present) and disk break radius in the same line styles as in the left panels. |
4. Results
4.1. Statistics of disk profile types
For the whole sample within 1 ≤ z ≤ 3, our analysis reveals that the fraction of type I disks is fI = 12.6%, the fraction of type II disks is fII = 56.7%, the fraction of type II.i disks is fII.i = 4.9%, and the fraction of type III disk is fIII = 34.8%. These fractions do not change significantly when the sample is divided into redshift bins of 1 ≤ z < 2 and 2 ≤ z ≤ 3. Our derived fractions, together with those reported in previous studies, are plotted as a function of redshift in Fig. 3. The fractions derived from optical images of nearby galaxies, calculated on the basis of on an aggregation of data from several studies within the same series, specifically those conducted by Pohlen & Trujillo (2006), Erwin et al. (2008), and Gutiérrez et al. (2011), are represented by blue squares. We also include classification results derived from NIR images of nearby galaxies, as reported by Laine et al. (2016), but only focus on galaxies with log M*/M⊙ ≥ 10, same with the mass cut used in this study. The fractions of profile types calculated in this manner are denoted by purple triangles. These galaxies span a wide range of environment from field to cluster (Laine et al. 2016). Our derived fractions for high-redshift CEERS galaxies are broadly consistent with those obtained from optical image or NIR images of nearby galaxies. Nevertheless, we note that there is a minor increase in fII or a decrease in fI, which may be caused by minor cosmic evolution or the difference in the sample properties. Compared to the findings obtained from intermediate-redshift (z ≤ 1) galaxies reported by Azzollini et al. (2008), which are marked with grey crosses, our fIII values are higher. This difference is likely attributed to the classification approach we adopted from Erwin et al. (2008), particularly in how we handle mixed-type profiles. While Azzollini et al. (2008) tended to classify these mixed types into a single type II type, our methodology allows for a more detailed classification, leading to discrepancies between our results and those reported by Azzollini et al. (2008).
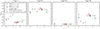 |
Fig. 3. Comparison of our derived fractions of type I, type II, type II.i, and type III profiles with those in previous studies. Our results are calculated in three redshift bins and are marked by points positioned at the median redshift. Results derived from the combined data of studies Pohlen & Trujillo (2006), Erwin et al. (2008), and Gutiérrez et al. (2011) in the same series are marked as blue squares; those reported in Laine et al. (2014) are marked by purple triangles. Results based on HST reported in Azzollini et al. (2008) are shown by grey crosses. Error bars associated with the symbols denote the statistical uncertainties. |
4.2. Dependence of disk profile types on physical properties
We explored the dependence of the fractions of disk profile types on stellar mass, concentration index, and rest-frame U − V color in Fig. 4. We found the most pronounced correlation with the concentration index. As the concentration index increases, the fraction of type II decreases while the fraction of type III increases, and the fraction of type I remains nearly unchanged. Such a strong dependence for type III fraction on stellar concentration is in good agreement with that for nearby galaxies, as shown in Wang et al. (2018). Although the correlation with stellar mass and that with color index are not as pronounced, there is a weak trend that more massive or redder galaxies tend to show lower type II fractions and higher type III fractions. There was no clear trend found for type I profiles. Our results are consistent with previous studies on nearby galaxies (e.g., Gutiérrez et al. 2011; Tang et al. 2020), which showed that type III profiles are more prevalent in early-type galaxies, while type II profiles are more common in late-types.
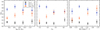 |
Fig. 4. Dependence of the factions of profile types on stellar mass (left), concentration index C82 (middle), and rest-frame color U − V (right). |
4.3. Connection between break radius with bar radius and disk size
In Fig. 5, we present the distribution of the ratio of type II break radius (Rbrk) to bar radius (Rbar) on the left, and the ratio of Rbrk to R90 (a measure of disk size that encloses 90% of galaxy flux) on the right. We show that the distribution of Rbrk/Rbar ratios peaks at approximately 2.25, displaying an asymmetric shape with a skewness towards higher values; the distribution of Rbrk/R90 ratios peak at approximately 0.8. To estimate which of these two quantities exhibits a stronger correlation with Rbrk, we compute the Pearson correlation coefficient (ρ) for both. This yields ρ(Rbrk, Rbar) = 0.52 and ρ(Rbrk, R90) = 0.66. Therefore, there is no significant evidence to suggest that the break radius is more closely related to the bar radius than it is to the disk size.
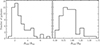 |
Fig. 5. Distribution of the ratio of type II break radius (Rbrk) to bar radius (Rbar) on the left and the ratio of Rbrk to R90 on the right. |
5. Discussion and conclusion
A significant proportion of nearby disk galaxies exhibit breaks in their surface brightness profiles, mainly categorized as type I, type II, and type III. Studying the potential cosmic evolution of the fraction of these disk break types could provide insights into the origin of disk breaks and the process of galaxy evolution. Through the analysis of deconvolved surface brightness profiles of 247 CEERS disk galaxies at 1 ≤ z ≤ 3, we found that not only are their fraction of break types comparable with those observed in the Local Universe (Pohlen & Trujillo 2006; Erwin et al. 2008; Gutiérrez et al. 2011; Laine et al. 2014), but that the dependence of fractions on galaxy properties is similar to previous results based on nearby galaxies (Gutiérrez et al. 2011; Wang et al. 2018; Tang et al. 2020). This consistency implies that despite galaxies being intrinsically more luminous (e.g., Yu et al. 2023) and more compact (e.g., van der Wel et al. 2014) at the earlier cosmic time, the phenomenon of disk breaks had already been firmly established in the early Universe. Moreover, our findings are in good agreement with recent observations by the JWST, which reveal that regular stellar structures such as bars and spirals, closely resembling their nearby counterparts, are present in these high-redshift galaxies (e.g., Chen et al. 2022; Fudamoto et al. 2022; Guo et al. 2023).
Environment may play a role in sculpting the surface brightness profiles. Clusters are rarer at higher redshifts (Gladders & Yee 2005; Pacaud et al. 2007; Hasselfield et al. 2013), reducing the likelihood of type II profile suppression within cluster environments (Erwin et al. 2012; Roediger et al. 2012; Raj et al. 2019; Pfeffer et al. 2022). This potentially contributes to an increase in the fraction of type II profiles at higher redshifts and leads to the observed modest elevation in our reported type II fraction compared to those identified in the Local Universe (Fig. 3). In contrast, given that type III profiles are more frequent in denser environment (Watkins et al. 2019; Pfeffer et al. 2022), the type III fraction at higher redshifts may decrease. Nonetheless, the increased merger rates (Rodriguez-Gomez et al. 2015) and gas fractions (Geach et al. 2011; Magdis et al. 2012) observed at higher redshifts may promote the formation of type III profiles through mergers (Bekki 1998) and in situ star formation fuelled by gas accretion (Wang et al. 2018), respectively, compensating for the aforementioned decline.
Previous observational studies have suggested a connection of type II disk break to the outer Lindblad resonance (OLR) of the bar structure (e.g., Pohlen & Trujillo 2006; Erwin et al. 2008; Muñoz-Mateos et al. 2013; Laine et al. 2014). Simulations have shown that bars are effective drivers of radial migration through their corotation resonance (CR), making stars travel several kiloparsecs radially both inwards and outwards, leading to the formation of a down-bending break roughly at the OLR (e.g., Debattista et al. 2006; Minchev et al. 2012). Given the position of the OLR being about two to three times the bar radius (Erwin et al. 2008; Muñoz-Mateos et al. 2013), the bar-driven radial migration leads to Rbrk/Rbar ≈ 2–3 (on average), which could potentially explain our reported distribution of Rbrk/Rbar. The observation of this peak from the high-redshift Universe (1 ≤ z ≤ 3), as reported in this study, persisting into the Local Universe (z ≈ 0), which was explored in Muñoz-Mateos et al. (2013), implies that these disk breaks are likely long-lived structures and evolve in conjunction with the bars. For unbarred galaxies, type II breaks could be a result of radial migration driven solely by spirals (Martínez-Bautista et al. 2021), particularly in grand-design spiral galaxies with density-wave arms.
However, we note that the distribution of Rbrk/Rbar spans a wide range and that the breaks do not show a stronger correlation with bar than disk, thereby suggesting that bars might not predominantly influence the observed patterns. Furthermore, since the scenario of bar-driven radial migration operates over a few Gyr (Roškar et al. 2008; Minchev et al. 2012), the disks at z = 3 may not have time to experience such secular evolution processes. Rather, the dynamical evolution of high-redshifts disks could be primarily governed by more violent disk instabilities (e.g., Dekel et al. 2009). This process is fast and can rapidly generate type II disk breaks by flinging out materials through spiral arms and clump torques in less than 1 Gyr (Bournaud et al. 2007).
Our study reveals a high fraction of disk breaks in galaxies at redshifts 1 ≤ z ≤ 3 in the JWST CEERS field, supporting the findings of Ferreira et al. (2023) and Kartaltepe et al. (2023), which state that the Hubble sequence was already in place at these higher redshifts. While the exact mechanisms behind the formation of these breaks remain uncertain, future studies focusing on their color profiles could provide deeper insights into their origins. Such investigations may be crucial for understanding the interplay between galaxy structure and evolution across cosmic time, potentially revealing how high-redshift galaxies evolved into the structures we now observe in the Local Universe.
https://dawn-cph.github.io/dja; version 7 is used.
Acknowledgments
We thank the referee for his insightful and constructive feedback, which significantly enhanced the quality and clarity of this letter. We thank the fruitful discussion with Cheng Cheng. S.Y.Y. thanks Prof. Karl Menten for his support. This work is based on observations taken by the 3D-HST Treasury Program (GO 12177 and 12328) with the NASA/ESA HST, which is operated by the Association of Universities for Research in Astronomy, Inc., under NASA contract NAS5-26555. (Some of) The data products presented herein were retrieved from the Dawn JWST Archive (DJA). DJA is an initiative of the Cosmic Dawn Center, which is funded by the Danish National Research Foundation under grant No. 140.
References
- Azzollini, R., Trujillo, I., & Beckman, J. E. 2008, ApJ, 684, 1026 [NASA ADS] [CrossRef] [Google Scholar]
- Bakos, J., Trujillo, I., & Pohlen, M. 2008, ApJ, 683, L103 [NASA ADS] [CrossRef] [Google Scholar]
- Barbary, K. 2016, J. Open Source Software, 1, 58 [NASA ADS] [CrossRef] [Google Scholar]
- Bekki, K. 1998, ApJ, 502, L133 [NASA ADS] [CrossRef] [Google Scholar]
- Borlaff, A., Eliche-Moral, M. C., Beckman, J. E., et al. 2018, A&A, 615, A26 [NASA ADS] [EDP Sciences] [Google Scholar]
- Bournaud, F., Elmegreen, B. G., & Elmegreen, D. M. 2007, ApJ, 670, 237 [Google Scholar]
- Bradley, L., Sipőcz, B., Robitaille, T., et al. 2020, https://doi.org/10.5281/zenodo.4044744 [Google Scholar]
- Brammer, G. B., van Dokkum, P. G., Franx, M., et al. 2012, ApJS, 200, 13 [Google Scholar]
- Chen, C.-C., Gao, Z.-K., Hsu, Q.-N., et al. 2022, ApJ, 939, L7 [NASA ADS] [CrossRef] [Google Scholar]
- Conselice, C. J., Rajgor, S., & Myers, R. 2008, MNRAS, 386, 909 [CrossRef] [Google Scholar]
- de Vaucouleurs, G. 1958, ApJ, 128, 465 [NASA ADS] [CrossRef] [Google Scholar]
- de Vaucouleurs, G. 1959, Handbuch Phys., 53, 311 [NASA ADS] [Google Scholar]
- Debattista, V. P., Mayer, L., Carollo, C. M., et al. 2006, ApJ, 645, 209 [Google Scholar]
- Dekel, A., Sari, R., & Ceverino, D. 2009, ApJ, 703, 785 [Google Scholar]
- Di Matteo, P., Haywood, M., Combes, F., Semelin, B., & Snaith, O. N. 2013, A&A, 553, A102 [NASA ADS] [CrossRef] [EDP Sciences] [Google Scholar]
- Elmegreen, B. G., & Hunter, D. A. 2006, ApJ, 636, 712 [NASA ADS] [CrossRef] [Google Scholar]
- Erwin, P., & Sparke, L. S. 2003, ApJS, 146, 299 [NASA ADS] [CrossRef] [Google Scholar]
- Erwin, P., Beckman, J. E., & Pohlen, M. 2005, ApJ, 626, L81 [Google Scholar]
- Erwin, P., Gutiérrez, L., & Beckman, J. E. 2012, ApJ, 744, L11 [NASA ADS] [CrossRef] [Google Scholar]
- Erwin, P., Pohlen, M., & Beckman, J. E. 2008, AJ, 135, 20 [Google Scholar]
- Ferreira, L., Adams, N., Conselice, C. J., et al. 2022, ApJ, 938, L2 [NASA ADS] [CrossRef] [Google Scholar]
- Ferreira, L., Conselice, C. J., Sazonova, E., et al. 2023, ApJ, 955, 94 [NASA ADS] [CrossRef] [Google Scholar]
- Finkelstein, S. L., Bagley, M. B., Haro, P. A., et al. 2022, ApJ, 940, L55 [NASA ADS] [CrossRef] [Google Scholar]
- Freeman, K. C. 1970, ApJ, 160, 811 [Google Scholar]
- Fudamoto, Y., Inoue, A. K., & Sugahara, Y. 2022, ApJ, 938, L24 [NASA ADS] [CrossRef] [Google Scholar]
- Geach, J. E., Smail, I., Moran, S. M., et al. 2011, ApJ, 730, L19 [NASA ADS] [CrossRef] [Google Scholar]
- Gladders, M. D., & Yee, H. K. C. 2005, ApJS, 157, 1 [NASA ADS] [CrossRef] [Google Scholar]
- Guo, Y., Jogee, S., Finkelstein, S. L., et al. 2023, ApJ, 945, L10 [NASA ADS] [CrossRef] [Google Scholar]
- Gutiérrez, L., Erwin, P., Aladro, R., & Beckman, J. E. 2011, AJ, 142, 145 [CrossRef] [Google Scholar]
- Hasselfield, M., Hilton, M., Marriage, T. A., et al. 2013, JCAP, 2013, 008 [Google Scholar]
- Kartaltepe, J. S., Rose, C., Vanderhoof, B. N., et al. 2023, ApJ, 946, L15 [NASA ADS] [CrossRef] [Google Scholar]
- Kennicutt, R. C., Jr 1989, ApJ, 344, 685 [CrossRef] [Google Scholar]
- Laine, J., Laurikainen, E., Salo, H., et al. 2014, MNRAS, 441, 1992 [Google Scholar]
- Laine, J., Laurikainen, E., & Salo, H. 2016, A&A, 596, A25 [NASA ADS] [CrossRef] [EDP Sciences] [Google Scholar]
- Le Conte, Z. A., Gadotti, D. A., Ferreira, L., et al. 2023, MNRAS, submitted, [arXiv:2309.10038] [Google Scholar]
- Liang, X., Yu, S. Y., Fang, T., & Ho, L. C. 2023, A&A, submitted, [arXiv:2311.04019] [Google Scholar]
- Lin, D. N. C., & Pringle, J. E. 1987, ApJ, 320, L87 [NASA ADS] [CrossRef] [Google Scholar]
- Lucy, L. B. 1974, AJ, 79, 745 [Google Scholar]
- Magdis, G. E., Daddi, E., Sargent, M., et al. 2012, ApJ, 758, L9 [NASA ADS] [CrossRef] [Google Scholar]
- Martin, C. L., Kennicutt, Robert C. J., 2001, ApJ, 555, 301 [NASA ADS] [CrossRef] [Google Scholar]
- Martín-Navarro, I., Bakos, J., Trujillo, I., et al. 2012, MNRAS, 427, 1102 [Google Scholar]
- Martín-Navarro, I., Trujillo, I., Knapen, J. H., Bakos, J., & Fliri, J. 2014, MNRAS, 441, 2809 [CrossRef] [Google Scholar]
- Martínez-Bautista, G., Velázquez, H., Pérez-Villegas, A., & Moreno, E. 2021, MNRAS, 504, 5919 [CrossRef] [Google Scholar]
- Miller, T. B., & van Dokkum, P. 2021, ApJ, 923, 124 [NASA ADS] [CrossRef] [Google Scholar]
- Minchev, I., Famaey, B., Quillen, A. C., et al. 2012, A&A, 548, A126 [NASA ADS] [CrossRef] [EDP Sciences] [Google Scholar]
- Mortlock, A., Conselice, C. J., Hartley, W. G., et al. 2013, MNRAS, 433, 1185 [NASA ADS] [CrossRef] [Google Scholar]
- Muñoz-Mateos, J. C., Sheth, K., Gil de Paz, A., et al. 2013, ApJ, 771, 59 [Google Scholar]
- Pacaud, F., Pierre, M., Adami, C., et al. 2007, MNRAS, 382, 1289 [Google Scholar]
- Pérez, I. 2004, A&A, 427, L17 [NASA ADS] [CrossRef] [EDP Sciences] [Google Scholar]
- Perrin, M. D., Sivaramakrishnan, A., Lajoie, C. P., et al. 2014, in Space Telescopes and Instrumentation 2014: Optical, Infrared, and Millimeter Wave, eds. J. Oschmann, M. Jacobus, M. Clampin, G. G. Fazio, & H. A. MacEwen, SPIE Conf. Ser., 9143, 91433X [CrossRef] [Google Scholar]
- Peters, S. P. C., van der Kruit, P. C., Knapen, J. H., et al. 2017, MNRAS, 470, 427 [NASA ADS] [CrossRef] [Google Scholar]
- Pfeffer, J. L., Bekki, K., Forbes, D. A., Couch, W. J., & Koribalski, B. S. 2022, MNRAS, 509, 261 [Google Scholar]
- Pohlen, M., & Trujillo, I. 2006, A&A, 454, 759 [NASA ADS] [CrossRef] [EDP Sciences] [Google Scholar]
- Pranger, F., Trujillo, I., Kelvin, L. S., & Cebrián, M. 2017, MNRAS, 467, 2127 [NASA ADS] [CrossRef] [Google Scholar]
- Raj, M. A., Iodice, E., Napolitano, N. R., et al. 2019, A&A, 628, A4 [NASA ADS] [CrossRef] [EDP Sciences] [Google Scholar]
- Richardson, W. H. 1972, J. Opt. Soc. Am. (1917-1983), 62, 55 [CrossRef] [Google Scholar]
- Rodriguez-Gomez, V., Genel, S., Vogelsberger, M., et al. 2015, MNRAS, 449, 49 [Google Scholar]
- Roediger, J. C., Courteau, S., Sánchez-Blázquez, P., & McDonald, M. 2012, ApJ, 758, 41 [NASA ADS] [CrossRef] [Google Scholar]
- Roškar, R., Debattista, V. P., Stinson, G. S., et al. 2008, ApJ, 675, L65 [Google Scholar]
- Schaye, J. 2004, ApJ, 609, 667 [NASA ADS] [CrossRef] [Google Scholar]
- Sellwood, J. A., & Binney, J. J. 2002, MNRAS, 336, 785 [Google Scholar]
- Skelton, R. E., Whitaker, K. E., Momcheva, I. G., et al. 2014, ApJS, 214, 24 [Google Scholar]
- Tang, Y., Chen, Q., Zhang, H.-X., et al. 2020, ApJ, 897, 79 [NASA ADS] [CrossRef] [Google Scholar]
- Trujillo, I., & Fliri, J. 2016, ApJ, 823, 123 [Google Scholar]
- Trujillo, I., & Pohlen, M. 2005, ApJ, 630, L17 [NASA ADS] [CrossRef] [Google Scholar]
- Valentino, F., Brammer, G., Gould, K. M. L., et al. 2023, ApJ, 947, 20 [NASA ADS] [CrossRef] [Google Scholar]
- van der Wel, A., Franx, M., van Dokkum, P. G., et al. 2014, ApJ, 788, 28 [Google Scholar]
- Wang, J., Zheng, Z., D’Souza, R., et al. 2018, MNRAS, 479, 4292 [NASA ADS] [CrossRef] [Google Scholar]
- Watkins, A. E., Laine, J., Comerón, S., Janz, J., & Salo, H. 2019, A&A, 625, A36 [NASA ADS] [CrossRef] [EDP Sciences] [Google Scholar]
- Williams, R. J., Quadri, R. F., Franx, M., van Dokkum, P., & Labbé, I. 2009, ApJ, 691, 1879 [NASA ADS] [CrossRef] [Google Scholar]
- Yu, S.-Y., Kalinova, V., Colombo, D., et al. 2022, A&A, 666, A175 [NASA ADS] [CrossRef] [EDP Sciences] [Google Scholar]
- Yu, S.-Y., Cheng, C., Pan, Y., Sun, F., & Li, Y. A. 2023, A&A, 676, A74 [NASA ADS] [CrossRef] [EDP Sciences] [Google Scholar]
All Figures
|
Fig. 1. Illustration of the deconvolved surface brightness profiles. The left two panels illustrate the intrinsic profiles obtained from high-resolution images of nearby galaxies, featuring ESO 112-005 at the top and NGC 12 at the bottom, respectively. The panels in the subsequent columns present the profiles extracted from artificial downsized images convolved with the JWST F356W PSF, indicated by dashed curves, and present the deconvolved profiles, shown as solid curves. The resolution of the artificial image is indicated by the ratio of galaxy half-light radius (R50) to PSF FWHM, denoted at the top of the panel. The arrow denotes the disk break seen in the intrinsic profile. |
| In the text | |
|
Fig. 2. Classification of the deconvolved disk profiles into three types: type I (exponential; top), type II (down-bending; middle), and type III (up-bending; bottom). The left panels plot the deconvolved surface brightness profiles as a function of semi-major axis (SMA) extracted from deconvolved images. In these, the blue dashed-point line marks the measured bar radius (if present), and the solid red line indicates the identified disk break radius. The dashed lines represent the best-fit exponential functions. On the right, the panels display the deconvolved F356W-band images, with overplotted ellipses corresponding to the bar radius (if present) and disk break radius in the same line styles as in the left panels. |
| In the text | |
|
Fig. 3. Comparison of our derived fractions of type I, type II, type II.i, and type III profiles with those in previous studies. Our results are calculated in three redshift bins and are marked by points positioned at the median redshift. Results derived from the combined data of studies Pohlen & Trujillo (2006), Erwin et al. (2008), and Gutiérrez et al. (2011) in the same series are marked as blue squares; those reported in Laine et al. (2014) are marked by purple triangles. Results based on HST reported in Azzollini et al. (2008) are shown by grey crosses. Error bars associated with the symbols denote the statistical uncertainties. |
| In the text | |
|
Fig. 4. Dependence of the factions of profile types on stellar mass (left), concentration index C82 (middle), and rest-frame color U − V (right). |
| In the text | |
|
Fig. 5. Distribution of the ratio of type II break radius (Rbrk) to bar radius (Rbar) on the left and the ratio of Rbrk to R90 on the right. |
| In the text | |
Current usage metrics show cumulative count of Article Views (full-text article views including HTML views, PDF and ePub downloads, according to the available data) and Abstracts Views on Vision4Press platform.
Data correspond to usage on the plateform after 2015. The current usage metrics is available 48-96 hours after online publication and is updated daily on week days.
Initial download of the metrics may take a while.