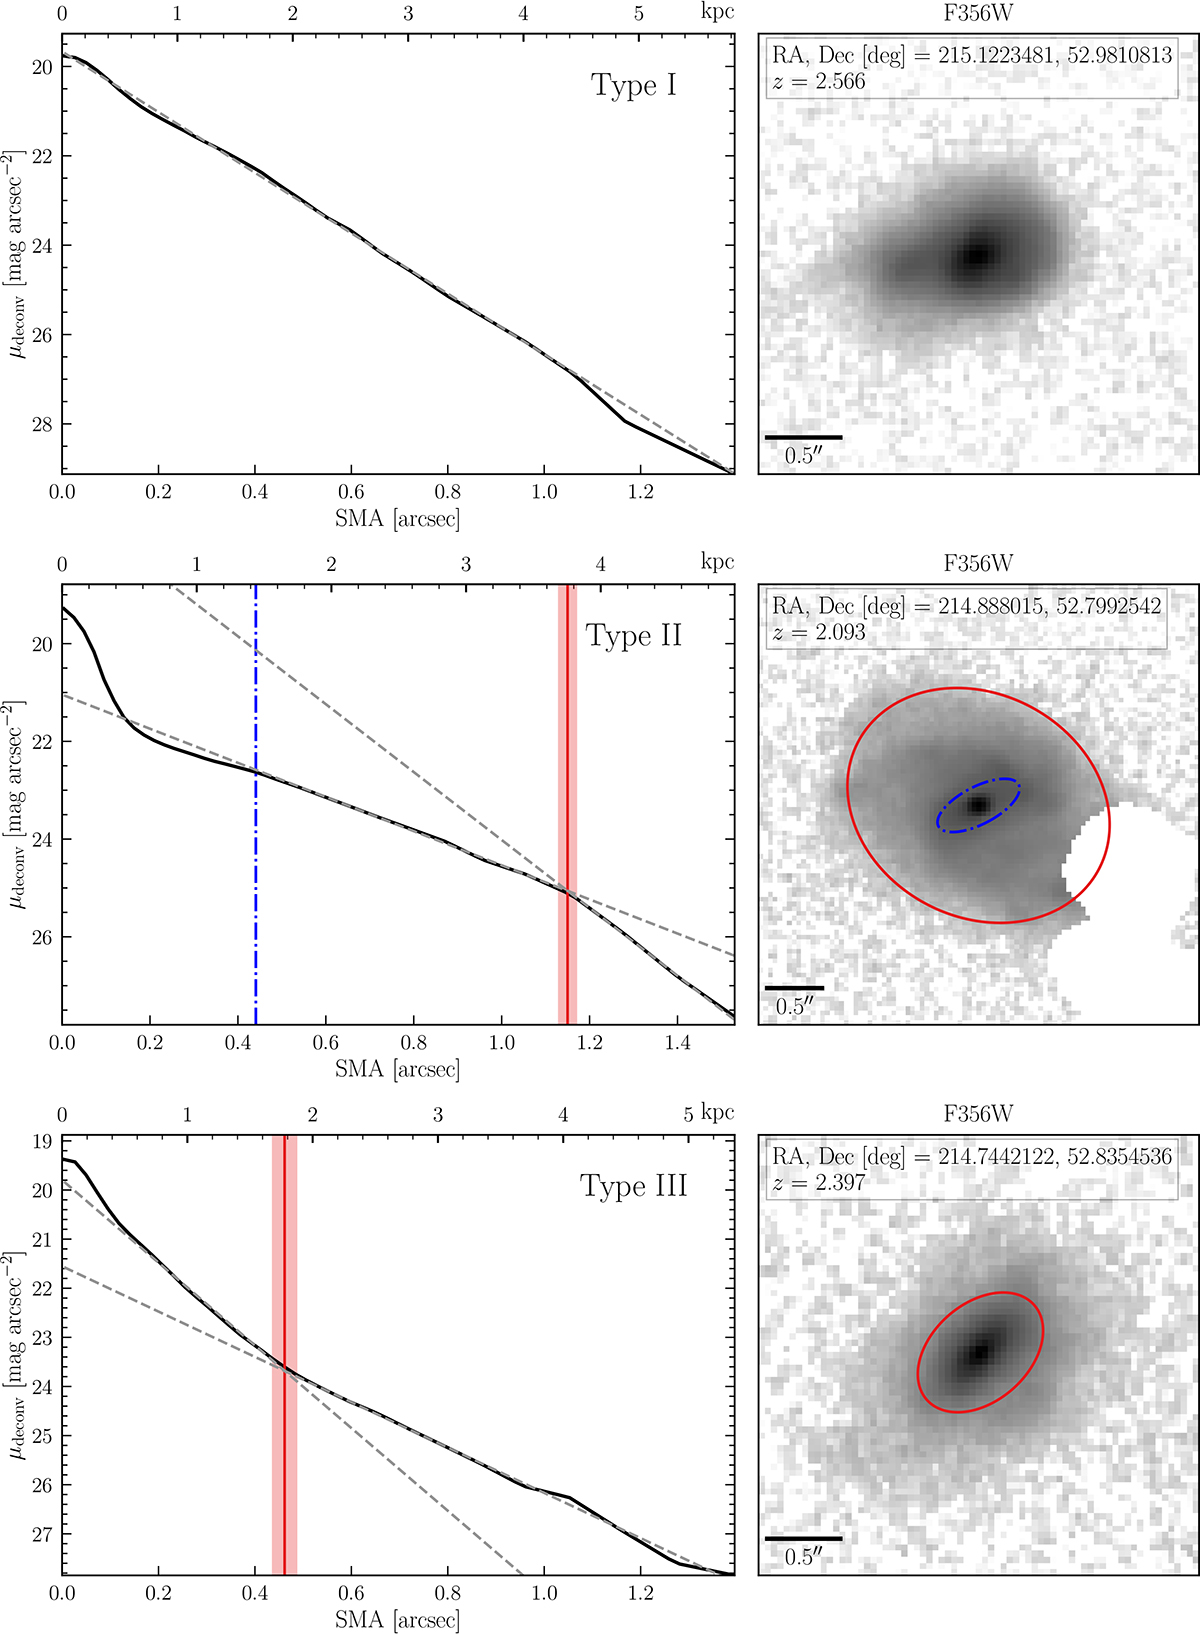
Fig. 2.
Download original image
Classification of the deconvolved disk profiles into three types: type I (exponential; top), type II (down-bending; middle), and type III (up-bending; bottom). The left panels plot the deconvolved surface brightness profiles as a function of semi-major axis (SMA) extracted from deconvolved images. In these, the blue dashed-point line marks the measured bar radius (if present), and the solid red line indicates the identified disk break radius. The dashed lines represent the best-fit exponential functions. On the right, the panels display the deconvolved F356W-band images, with overplotted ellipses corresponding to the bar radius (if present) and disk break radius in the same line styles as in the left panels.
Current usage metrics show cumulative count of Article Views (full-text article views including HTML views, PDF and ePub downloads, according to the available data) and Abstracts Views on Vision4Press platform.
Data correspond to usage on the plateform after 2015. The current usage metrics is available 48-96 hours after online publication and is updated daily on week days.
Initial download of the metrics may take a while.