| Issue |
A&A
Volume 693, January 2025
|
|
|---|---|---|
| Article Number | L9 | |
| Number of page(s) | 5 | |
| Section | Letters to the Editor | |
| DOI | https://doi.org/10.1051/0004-6361/202452752 | |
| Published online | 08 January 2025 | |
Letter to the Editor
Color profiles of disk galaxies at z = 1–3 observed with JWST: Implications for outer-disk formation histories
1
Kavli Institute for the Physics and Mathematics of the Universe (Kavli IPMU, WPI), UTIAS, Tokyo Institutes for Advanced Study, University of Tokyo, Chiba, 277-8583, Japan
2
Department of Astronomy, Peking University, 5 Yiheyuan Road, Haidian District, Beijing, 100871, China
3
Kavli Institute for Astronomy and Astrophysics, Peking University, Beijing, 100871, PR China
4
Center for Data-Driven Discovery, Kavli IPMU (WPI), UTIAS, The University of Tokyo, Kashiwa, Chiba, 277-8583, Japan
5
Department of Astronomy, Xiamen University, Xiamen, Fujian, 361005, PR China
6
School of Astronomy and Space Science, University of Chinese Academy of Sciences (UCAS), Beijing, 100049, China
7
Department of Astronomy, School of Science, The University of Tokyo, 7-3-1 Hongo, Bunkyo, Tokyo, 113-0033, Japan
⋆ Corresponding authors; si-yue.yu@ipmu.jp, dwxu.astro@gmail.com
Received:
25
October
2024
Accepted:
17
December
2024
We investigate the deconvolved color profiles of 223 disk galaxies at redshifts of z = 1–3 observed by the James Webb Space Telescope (JWST) as part of the Cosmic Evolution Early Release Science survey (CEERS). The filters were selected to approximate the rest-frame B − Y color, which is used to identify U-shaped color profiles –those becoming progressively bluer with increasing radius, then turning redder beyond a specific point. We find that 36% of Type II (down-bending) disks exhibit U-shaped color profiles with a minimum at or near the disk break. In contrast, no Type I (single-exponential) disks and only 9% of Type III (up-bending) disks show such a profile. The presence of U-shaped color profiles in Type II disks likely arises from the interplay between a star-formation threshold and spiral- or bar-driven secular radial migration of older stars outward. The fraction of Type II disks exhibiting a U-shaped color profile remains almost consistent across two redshift bins, z = 1–2 and z = 2–3, but is significantly lower than that observed in the local Universe, likely because the secular process of radial migration at high redshift may not have had sufficient time to significantly influence the disk structure. The absence of U-shaped color profiles in Type II disks could point to rapid rather than secular radial star migration potentially caused by violent clump instabilities, transporting both younger and older stars to the outer disk. Our results provide useful constraints on the formation and evolution models of disk galaxies in the early Universe.
Key words: galaxies: evolution / galaxies: formation / galaxies: high-redshift / galaxies: photometry / galaxies: structure
© The Authors 2025
 Open Access article, published by EDP Sciences, under the terms of the Creative Commons Attribution License (https://creativecommons.org/licenses/by/4.0), which permits unrestricted use, distribution, and reproduction in any medium, provided the original work is properly cited.
This article is published in open access under the Subscribe to Open model. Subscribe to A&A to support open access publication.
1. Introduction
Since the seminal work by van der Kruit (1979), it has been established that the radial-surface-brightness profile of disk galaxies does not always decline exponentially but instead exhibits a sharp change after several radial scale lengths. Pohlen & Trujillo (2006) and Erwin et al. (2008) identified three main categories of surface brightness profiles: (1) Type I, classical single exponential; (2) Type II, down-bending double exponential; and (3) Type III, up-bending double exponential. The transition between the two exponential segments is referred to as the disk break. In the local Universe, approximately 20%, 50%, and 30% of disk galaxies observed in the optical display Type I, Type II, and Type III surface-brightness profiles, respectively (Pohlen & Trujillo 2006; Erwin et al. 2008; Gutiérrez et al. 2011). Consistent fractions have been obtained in the near-infrared (Laine et al. 2014). These fractions remain largely unchanged at intermediate redshifts (z = 0.1–1.1) (Azzollini et al. 2008b). Leveraging the superior near-infrared imaging capabilities of JWST NIRCam, Xu & Yu (2024) study high-redshift disk galaxies observed in the Cosmic Evolution Early Release Science survey (CEERS) (PI: Finkelstein, ID=1345, Finkelstein et al. 2022) and report fractions of 12.6%, 56.7%, and 34.8% for the three types at z = 1–3, respectively.
Simulations by Roškar et al. (2008) suggested that the Type II disks result from a combination of star formation cut-off in the outer disk and secular radial star migration, and predicted a U-shape in their color profiles. Consistently, observations at redshift z < 1 reveal that most Type II disks exhibit a U-shaped color profile, with the minimum typically located at or near the disk break (Azzollini et al. 2008a; Bakos et al. 2008; Zheng et al. 2015; Marino et al. 2016). In contrast, Type I disks, possibly formed via protogalactic cloud collapse (e.g., Freeman 1970) or viscous redistribution (e.g., Ferguson & Clarke 2001), and Type III disks, possibly formed via interaction with intergalactic environment (e.g., Younger et al. 2007), rarely show U-shaped color profiles.
At high redshifts z ≳ 1, as the timescale for secular processes to exert significant influence is several gigayears (Roškar et al. 2008), spiral- or bar-driven radial migration may not have had sufficient time to make Type II disks. Additionally, the evolution of bar fractions over cosmic time (Kraljic et al. 2012; Rosas-Guevara et al. 2022) and the potential underdevelopment of spiral structures due to turbulence (Elmegreen & Elmegreen 2014) may further limit the impact of secular radial migration during this epoch. These considerations suggest that the fraction of Type II disks at high redshift might decrease; however, this fraction remains comparable to that in the local Universe (Xu & Yu 2024). Therefore, it is suggested that, alongside secular radial migration, a much more rapid mechanism – likely driven by clump instabilities (Bournaud et al. 2007; Bournaud 2016) – could be responsible for the formation of Type II disks at high redshift. Such rapid processes do not necessarily lead to U-shaped color profiles. This dichotomy between secular and rapid mechanisms raises questions about the formation mechanism of the high-redshift Type II disks.
Studying the color profiles of high-redshift disks could significantly enhance our understanding of the physical processes that dominate disk evolution in the early Universe. However, the color profiles of these high-redshift disks remain unexplored. In this Letter, we investigate the color profiles of disk galaxies at redshifts of z = 1–3 using the JWST sample from Xu & Yu (2024) and discuss their implications for the formation and evolution of disk galaxies.
2. Observation material
Xu & Yu (2024) define a sample of 247 face-on disk galaxies at redshifts of z = 1–3 from CEERS, excluding those with tidal features and selecting galaxies with an inclination of i ≤ 60°, stellar mass of M* > 1010 M⊙, and a half-light radius of Re > 2 × F356W full width at half maximum (FWHM). Although the sample may still include galaxies that have undergone minor mergers in the past, these events typically produce Type III profiles rather than Type II. Our analysis focuses on the color profiles of Type II disks, reducing concerns over the potential effects of past minor mergers. The size criterion ensures robust extraction of deconvolved surface-brightness profiles, with the point spread function (PSF) effects removed. Eliminating the PSF smoothing effect is crucial to study galaxy morphology (Yu et al. 2023; Liang et al. 2024). The classification into Type I, II, and III disks was based on the exponential-function fitting to the deconvolved F356W-band profiles (Xu & Yu 2024). The deconvolution process involves subtracting a PSF-convolved multi-Gaussian model from the original image and subsequently adding the model without PSF convolution back to the residual; for details, see Xu & Yu (2024). Adopting this method, we extracted the F115W- and F150W-band surface-brightness profiles that are not available in Xu & Yu (2024). The extraction robustness is automatically ensured due to the narrower PSFs of the F115W- and F150W-band images. Galaxies lacking these two-band images were excluded, leaving 223 galaxies. In these galaxies, there are 41 Type I, 135 Type II, and 83 Type III profiles. Some galaxies exhibit both Type II and Type III breaks. Scale lengths, hs, and break radii, Rbreak, were adopted from Xu & Yu (2024).
Our construction of the color profiles to study these disks is based on the principle that one band traces young stars and another traces older stars. Consequently, we selected F115W or F150W as the blue band, and F356W as the red band. We avoid using F444W, as this would significantly reduce the number of galaxies due to the wider F444W PSF and the requirement of Re > 2 × FWHM for robust deconvolution. To facilitate optimal comparisons of color profiles across different redshift ranges, we selected filters that closely approximate rest-frame B − Y: for z = 1–2, we used F115W − F356W, and for z = 2–3 we used F150W − F356W. To analyze the radial color gradient, we first normalized the profile radius by the characteristic radius, which is set as 2 × hs for Type I disks and Rbreak for Type II and III disks. We then fitted linear functions to the color profile on both sides of the characteristic radius. The fitting regions are selected as the nearly monotonically increasing or decreasing intervals of data. The U-shape in the color profile is identified if the slope of the best-fit linear function at the low-radius side is less than zero, while that at the high radius side is greater than zero. The U-shape position is estimated as the radius where the two best-fit functions intersect.
Figure 1 presents an example of color-profile extraction for a CEERS galaxy at  and
and  . The upper panels display the F356W- and F115W-band images with the dashed ellipse marking the break location, while the middle panel shows the extracted deconvolved surface brightness profiles in F356W (red) and F115W (blue). The calculated color profile, clearly exhibiting a U-shape, is shown in the bottom panel.
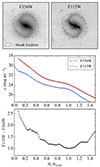 |
Fig. 1. Illustration of the calculation of color profiles. The upper panels display the F356W- and F115W-band images of the CEERS galaxy at |


3. Results
Figure 2 plots the color profiles of Type I, II, and III disks in the left, middle, and right panels, respectively. The gray curves represent individual profiles. The variation in color is primarily due to stellar mass (Azzollini et al. 2008a; Bakos et al. 2008). The large red diamonds indicate the average color profiles for each type. The average color profiles exhibit a systematic decrease with increasing radius, regardless of disk type. In particular, the average color profiles of all the high-redshift Type II disks in the sample do not show the U-shape. This result differs significantly from the average color profiles observed at redshift z < 1, where a U-shape is evident.
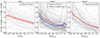 |
Fig. 2. Color profiles of the galaxies at z = 1–3 with JWST/NIRCam. The left, middle, and right panels show the results for Type I, II, and III disks, respectively. The color index is chosen as the best proxy to the rest-frame B − Y color. The radii are scaled to 2 × hs for Type I disks –where hs is the scale length–, and to the break radius Rbreak for Types II and III. Gray curves are individual color profiles. Large red diamonds are the mean color profile for each subsample, and the error bars give the error. The large blue squares in the middle panel show the average color profile for U-shaped Type II disks, with a minimum color of 0.67 dex. |
Previous analyses of disk galaxies at z ≈ 0 from the Sloan Digital Sky Survey and disk galaxies at z = 0.1–1.1 from HST ACS imaging both revealed that the average color profiles of all the Type II disks in their sample exhibit a U-shape near the disk break (Bakos et al. 2008; Marino et al. 2016; Azzollini et al. 2008a). The apparent reason is that most of the low- and intermediate-redshift type II disks have the U-shape.
We analyzed the color gradients to determine the shape of each color profile (Sect. 2) and present the distribution of disk galaxies by type and color profile shape in Fig. 3 to show how many of our high-redshift disks exhibit a U-shape. We find that 36% (49 out of 135) of Type II disks exhibit a U-shape at or near the disk break. The ratio of the break position to the U-shape position yields a mean value of 0.97 with a scatter of 0.13. The fraction of U-shaped color profiles in Type II disks is significantly lower than the 70–90% observed at redshift z ≲ 1. In contrast, none and only 9% (8 out of 83) of Type I and Type III disks, respectively, exhibit a U-shaped profile. As a result, the average color profile of both Type I and Type III disks also lacks a U-shape, which is consistent with previous studies of galaxies at low and intermediate redshifts (Azzollini et al. 2008a; Bakos et al. 2008).
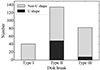 |
Fig. 3. Distribution of disk galaxies by type and color profile shape. The black portion of each bar represents the number of galaxies with a U-shaped color profile, while the gray portion indicates those with a non-U shape. Specifically, 36% of Type II disks and 9% of Type III disks exhibit a U-shaped color profile. |
To better illustrate the U-shape in high-redshift disks, we plot the average color profile for the 49 Type II disks with a detected U-shape as blue squares in the middle panel of Fig. 2, where a clear U-shape is evident near the disk break. The average U-shape color profile exhibits a minimum value of 0.62 dex. Additionally, we separate our galaxies into two redshift bins, z = 1–2 and z = 2–3, yielding fractions of U-shaped color profiles in Type II disks of  and 34.2
 , respectively (Fig. 4). The uncertainties are calculated using the Wilson interval. These fractions do not show significant evolution across the redshift range considered.
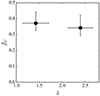 |
Fig. 4. Fraction of Type II disks exhibiting U-shaped color profiles as a function of redshift z. The data points represent the observed fractions in two redshift bins: |


4. Implication
Several models have been proposed to explain the different types of disk profiles. Type I disks may form through the collapse of a uniformly rotating protogalactic cloud (Freeman 1970; Fall & Efstathiou 1980) or via viscous redistribution (e.g., Ferguson & Clarke 2001). Consequently, a U-shaped color profile is not expected in these disks.
Type II profiles are genuine features of underlying older stellar disks (Muñoz-Mateos et al. 2013; Laine et al. 2014). The models proposed to explain the occurrence of the Type II profile in stellar disks can be categorized into three branches: (1) protogalactic cloud collapse with angular-momentum conservation and a sharp cut-off in angular momentum (van der Kruit 1987; 2) a star-formation threshold (Kennicutt 1989; Schaye 2004; Elmegreen & Hunter 2006); and (3) radial star migration (e.g., Debattista et al. 2006; Bournaud et al. 2007; Roškar et al. 2008; Minchev et al. 2012; Martínez-Bautista et al. 2021).
The collapse scenario is embedded within the inside-out galaxy-formation process (e.g., Guo et al. 2011). In this scenario, a galaxy forms in a cold dark matter halo and continues to accrete cold gas from the circumgalactic medium. The gas accreted initially has lower angular momentum, causing it to settle in the inner regions, while gas accreted later has higher angular momentum, leading it to fall into the outer regions. As a result, a sharp cut-off in the angular momentum of the accreted gas cloud can cause a truncation in the disk. However, this collapse scenario predicts a break radius at approximately 4.5 times the disk scale length, which is significantly larger than the observed break radii of 2–2.5 times the scale length (Elmegreen & Hunter 2006), making it an unlikely driver of the Type II disk break. The star-formation threshold scenario suggests a suppression of star-formation activity in the outer region, where the molecular gas surface density falls below a threshold value, leading to a truncation in the disk. However, this scenario fails to produce a sufficiently large disk with an exponential profile extending into the outer region (Schaye 2004), and thus does not fully account for the observed disk break. In addition to the star-formation threshold, a complementary mechanism, which relaxes the assumption that most stars currently in the outer disk were formed in situ, is also necessary. Radial star migration, which relocates stars from the inner to outer disk, plays a critical role in making the outer down-bending disk.
Radial star migration can be driven by several mechanisms. Sellwood & Binney (2002) proposed that transient spiral arms cause a dynamical churning effect, resulting in radial migration. Roškar et al. (2008) suggested that migration is primarily driven by the scattering effects of the bar and/or spiral corotation resonance, a secular process that unfolds over a few gigayears (see also Debattista et al. 2006 and Minchev et al. 2012). Khoperskov et al. (2020) and Haywood et al. (2024) propose that bar structures can induce more rapid migration. Their results indicate that young stars trapped by resonances may be displaced outward within ∼1 Gyr as the bar slows down. Additionally, gravitational torques from clumps, as demonstrated by Bournaud et al. (2007), can effectively fling stars outward into the outer disk. This process is highly rapid, with timescales of 300–500 Myr. Despite these complexities, the radial migration is crucial to the formation of Type II disks. Roškar et al. (2008) concluded that Type II disks form through the interplay between secular radial star migration and a star-formation cut-off in the outer disk, predicting an age profile with a U-shape at the break radius. The U-shape arises because secular migration moves old stars from the inner to the outer disk, while star formation in the outer regions has ceased. As young massive stars in the inner regions evolve rapidly and cease their main sequence phase before the secular radial migration takes effect, the stars transported outward are typically older. This scenario likely explains the 36% of Type II disks exhibiting U-shaped color profiles in our sample. We note that while variations in radial dust thickness may contribute to bluer colors at larger radii, they do not explain the U-shaped color profile or the break in the surface-brightness profile (see Fig. 4).
However, 64% of Type II disks do not show U-shaped color profiles and thus cannot be explained by the scenario involving secular radial migration. This is not entirely surprising, because secular processes require several gigayears to operate, and, additionally, the stellar structures that drive secular evolution, such as bars and spirals, might be only just forming at cosmic noon (z ≈ 1–3; e.g., Kraljic et al. 2012; Elmegreen & Elmegreen 2014). These structures may not have had sufficient time for secular evolution to significantly impact the disk. The faster migration mechanism associated with de-acceleration of the bar, as proposed by Khoperskov et al. (2020) and Haywood et al. (2024), may contribute to the formation of these disks. As this process is relatively fast, stars – including young stars – can be transferred outward within 1 Gyr, potentially forming a break in the surface-brightness profile without producing a U-shape color profile. The absence of U-shaped color profiles in some Type II disks could also be explained by radial migration driven by violent clump instabilities at high redshift, which can efficiently move stars outward on much shorter timescales (Bournaud et al. 2007; Bournaud 2016; Wu et al. 2020). A clump induces a kinematic response in the disk, creating over-densities that exchange angular momentum with the clump itself (Bournaud 2010). The gravity torques in clump instabilities are 10–20 times stronger than in secular processes, enabling efficient angular-momentum transfer (Bournaud et al. 2011). As clumps lose angular momentum and move inward, stars in the disk gain angular momentum and migrate outward (Bournaud et al. 2007). Clumps in high-redshift galaxies are now detected in near-infrared using JWST (Kalita et al. 2024a, 2024a). Although clump-instability models (e.g., Bournaud et al. 2007) do not provide any prediction of the age distribution of stars across the radial range, we infer that, in addition to old stars, young massive stars born in the inner regions could be transported to the outer regions in such a rapid process. If the disk break is driven by a combination of a star-formation threshold and rapid radial migration via violent clump instabilities, then Type II disks without U-shaped color profiles could form under these conditions.
For Type III galaxies, the formation mechanisms are less well understood. Minor mergers, gas accretion, and interactions with the intergalactic or circumgalactic environment may all contribute to their formation (Bekki 1998; Younger et al. 2007; Minchev et al. 2012; Watkins et al. 2019; Peters et al. 2017; Wang et al. 2018). Bakos & Trujillo (2012) suggests that some previously identified Type III profiles might be contaminated by stellar halos, arguing that true Type III disks may not exist. Nevertheless, combining these mechanisms, the truncation of recent star formation in the outer disk could account for the few observed Type III disks with U-shaped color profiles.
5. Conclusion
We analyzed the approximate rest-frame B − Y color profiles of 223 disk galaxies at redshifts of z = 1–3 observed by JWST, focusing on their relation to disk breaks. We find that 36% of Type II disks exhibit U-shaped color profiles with a minimum at or near the disk break, suggesting the influence of secular radial migration of old stars combined with a star formation threshold in these systems. The fraction of U-shaped color in Type II disks remains almost consistent across the redshift range z = 1–3, but is significantly lower than that observed in the local Universe. These results indicate that while secular processes are important, they may not have had sufficient time – a few gigayears – to fully shape disk galaxies at high redshifts. In contrast, Type II disks without U-shaped color profiles may suggest rapid rather than secular radial star migration. This may partly align with the scenario proposed by Khoperskov et al. (2020) and Haywood et al. (2024), wherein stars are captured by resonances and are subsequently transferred outward within ∼1 Gyr. Additionally, rapid star migration is also potentially driven by violent clump instabilities (Roškar et al. 2008), which can transport both young and old stars outward on timescales of 300–500 Myr, forming the secondary down-bending outer disk. These findings may offer critical insights into the formation and evolution of disk structures in the early Universe.
Acknowledgments
We are grateful to the anonymous referee for helpful feedback. TF and XL acknowledge support from the National Science Foundation of China (11890692, 12133008, 12221003) and the China Manned Space Project (CMSCSST-2021-A04). Kavli IPMU is supported by World Premier International Research Center Initiative (WPI), MEXT, Japan.
References
- Azzollini, R., Trujillo, I., & Beckman, J. E. 2008a, ApJ, 679, L69 [NASA ADS] [CrossRef] [Google Scholar]
- Azzollini, R., Trujillo, I., & Beckman, J. E. 2008b, ApJ, 684, 1026 [NASA ADS] [CrossRef] [Google Scholar]
- Bakos, J., & Trujillo, I. 2012, ArXiv e-prints [arXiv:1204.3082] [Google Scholar]
- Bakos, J., Trujillo, I., & Pohlen, M. 2008, ApJ, 683, L103 [NASA ADS] [CrossRef] [Google Scholar]
- Bekki, K. 1998, ApJ, 502, L133 [NASA ADS] [CrossRef] [Google Scholar]
- Bournaud, F. 2010, ASP Conf. Ser., 423, 177 [NASA ADS] [Google Scholar]
- Bournaud, F. 2016, Astrophys. Space Sci. Libr., 418, 355 [NASA ADS] [CrossRef] [Google Scholar]
- Bournaud, F., Elmegreen, B. G., & Elmegreen, D. M. 2007, ApJ, 670, 237 [Google Scholar]
- Bournaud, F., Dekel, A., Teyssier, R., et al. 2011, ApJ, 741, L33 [NASA ADS] [CrossRef] [Google Scholar]
- Debattista, V. P., Mayer, L., Carollo, C. M., et al. 2006, ApJ, 645, 209 [Google Scholar]
- Elmegreen, B. G., & Hunter, D. A. 2006, ApJ, 636, 712 [NASA ADS] [CrossRef] [Google Scholar]
- Elmegreen, D. M., & Elmegreen, B. G. 2014, ApJ, 781, 11 [Google Scholar]
- Erwin, P., Pohlen, M., & Beckman, J. E. 2008, AJ, 135, 20 [Google Scholar]
- Fall, S. M., & Efstathiou, G. 1980, MNRAS, 193, 189 [NASA ADS] [CrossRef] [Google Scholar]
- Ferguson, A. M. N., & Clarke, C. J. 2001, MNRAS, 325, 781 [Google Scholar]
- Finkelstein, S. L., Bagley, M. B., Haro, P. A., et al. 2022, ApJ, 940, L55 [NASA ADS] [CrossRef] [Google Scholar]
- Freeman, K. C. 1970, ApJ, 160, 811 [Google Scholar]
- Guo, Q., White, S., Boylan-Kolchin, M., et al. 2011, MNRAS, 413, 101 [Google Scholar]
- Gutiérrez, L., Erwin, P., Aladro, R., & Beckman, J. E. 2011, AJ, 142, 145 [CrossRef] [Google Scholar]
- Haywood, M., Khoperskov, S., Cerqui, V., et al. 2024, A&A, 690, A147 [NASA ADS] [CrossRef] [EDP Sciences] [Google Scholar]
- Kalita, B. S., Silverman, J. D., Daddi, E., et al. 2024a, ApJ, 960, 25 [NASA ADS] [CrossRef] [Google Scholar]
- Kalita, B. S., Silverman, J. D., Daddi, E., et al. 2024b, MNRAS, submitted [Google Scholar]
- Kennicutt, R. C., Jr 1989, ApJ, 344, 685 [CrossRef] [Google Scholar]
- Khoperskov, S., Di Matteo, P., Haywood, M., Gómez, A., & Snaith, O. N. 2020, A&A, 638, A144 [NASA ADS] [CrossRef] [EDP Sciences] [Google Scholar]
- Kraljic, K., Bournaud, F., & Martig, M. 2012, ApJ, 757, 60 [Google Scholar]
- Laine, J., Laurikainen, E., Salo, H., et al. 2014, MNRAS, 441, 1992 [Google Scholar]
- Liang, X., Yu, S.-Y., Fang, T., & Ho, L. C. 2024, A&A, 688, A158 [NASA ADS] [CrossRef] [EDP Sciences] [Google Scholar]
- Marino, R. A., Gil de Paz, A., Sánchez, S. F., et al. 2016, A&A, 585, A47 [NASA ADS] [CrossRef] [EDP Sciences] [Google Scholar]
- Martínez-Bautista, G., Velázquez, H., Pérez-Villegas, A., & Moreno, E. 2021, MNRAS, 504, 5919 [CrossRef] [Google Scholar]
- Minchev, I., Famaey, B., Quillen, A. C., et al. 2012, A&A, 548, A126 [NASA ADS] [CrossRef] [EDP Sciences] [Google Scholar]
- Muñoz-Mateos, J. C., Sheth, K., Gil de Paz, A., et al. 2013, ApJ, 771, 59 [Google Scholar]
- Peters, S. P. C., van der Kruit, P. C., Knapen, J. H., et al. 2017, MNRAS, 470, 427 [NASA ADS] [CrossRef] [Google Scholar]
- Pohlen, M., & Trujillo, I. 2006, A&A, 454, 759 [NASA ADS] [CrossRef] [EDP Sciences] [Google Scholar]
- Rosas-Guevara, Y., Bonoli, S., Dotti, M., et al. 2022, MNRAS, 512, 5339 [NASA ADS] [CrossRef] [Google Scholar]
- Roškar, R., Debattista, V. P., Stinson, G. S., et al. 2008, ApJ, 675, L65 [Google Scholar]
- Schaye, J. 2004, ApJ, 609, 667 [NASA ADS] [CrossRef] [Google Scholar]
- Sellwood, J. A., & Binney, J. J. 2002, MNRAS, 336, 785 [Google Scholar]
- van der Kruit, P. C. 1979, A&AS, 38, 15 [NASA ADS] [Google Scholar]
- van der Kruit, P. C. 1987, A&A, 173, 59 [NASA ADS] [Google Scholar]
- Wang, J., Zheng, Z., D’Souza, R., et al. 2018, MNRAS, 479, 4292 [NASA ADS] [CrossRef] [Google Scholar]
- Watkins, A. E., Laine, J., Comerón, S., Janz, J., & Salo, H. 2019, A&A, 625, A36 [NASA ADS] [CrossRef] [EDP Sciences] [Google Scholar]
- Wu, J., Struck, C., D’Onghia, E., & Elmegreen, B. G. 2020, MNRAS, 499, 2672 [NASA ADS] [CrossRef] [Google Scholar]
- Xu, D., & Yu, S.-Y. 2024, A&A, 682, L17 [NASA ADS] [CrossRef] [EDP Sciences] [Google Scholar]
- Younger, J. D., Cox, T. J., Seth, A. C., & Hernquist, L. 2007, ApJ, 670, 269 [NASA ADS] [CrossRef] [Google Scholar]
- Yu, S.-Y., Cheng, C., Pan, Y., Sun, F., & Li, Y. A. 2023, A&A, 676, A74 [NASA ADS] [CrossRef] [EDP Sciences] [Google Scholar]
- Zheng, Z., Thilker, D. A., Heckman, T. M., et al. 2015, ApJ, 800, 120 [NASA ADS] [CrossRef] [Google Scholar]
All Figures
|
Fig. 1. Illustration of the calculation of color profiles. The upper panels display the F356W- and F115W-band images of the CEERS galaxy at |
| In the text | |
|
Fig. 2. Color profiles of the galaxies at z = 1–3 with JWST/NIRCam. The left, middle, and right panels show the results for Type I, II, and III disks, respectively. The color index is chosen as the best proxy to the rest-frame B − Y color. The radii are scaled to 2 × hs for Type I disks –where hs is the scale length–, and to the break radius Rbreak for Types II and III. Gray curves are individual color profiles. Large red diamonds are the mean color profile for each subsample, and the error bars give the error. The large blue squares in the middle panel show the average color profile for U-shaped Type II disks, with a minimum color of 0.67 dex. |
| In the text | |
|
Fig. 3. Distribution of disk galaxies by type and color profile shape. The black portion of each bar represents the number of galaxies with a U-shaped color profile, while the gray portion indicates those with a non-U shape. Specifically, 36% of Type II disks and 9% of Type III disks exhibit a U-shaped color profile. |
| In the text | |
|
Fig. 4. Fraction of Type II disks exhibiting U-shaped color profiles as a function of redshift z. The data points represent the observed fractions in two redshift bins: |
| In the text | |
Current usage metrics show cumulative count of Article Views (full-text article views including HTML views, PDF and ePub downloads, according to the available data) and Abstracts Views on Vision4Press platform.
Data correspond to usage on the plateform after 2015. The current usage metrics is available 48-96 hours after online publication and is updated daily on week days.
Initial download of the metrics may take a while.