Fig. 1.
Download original image
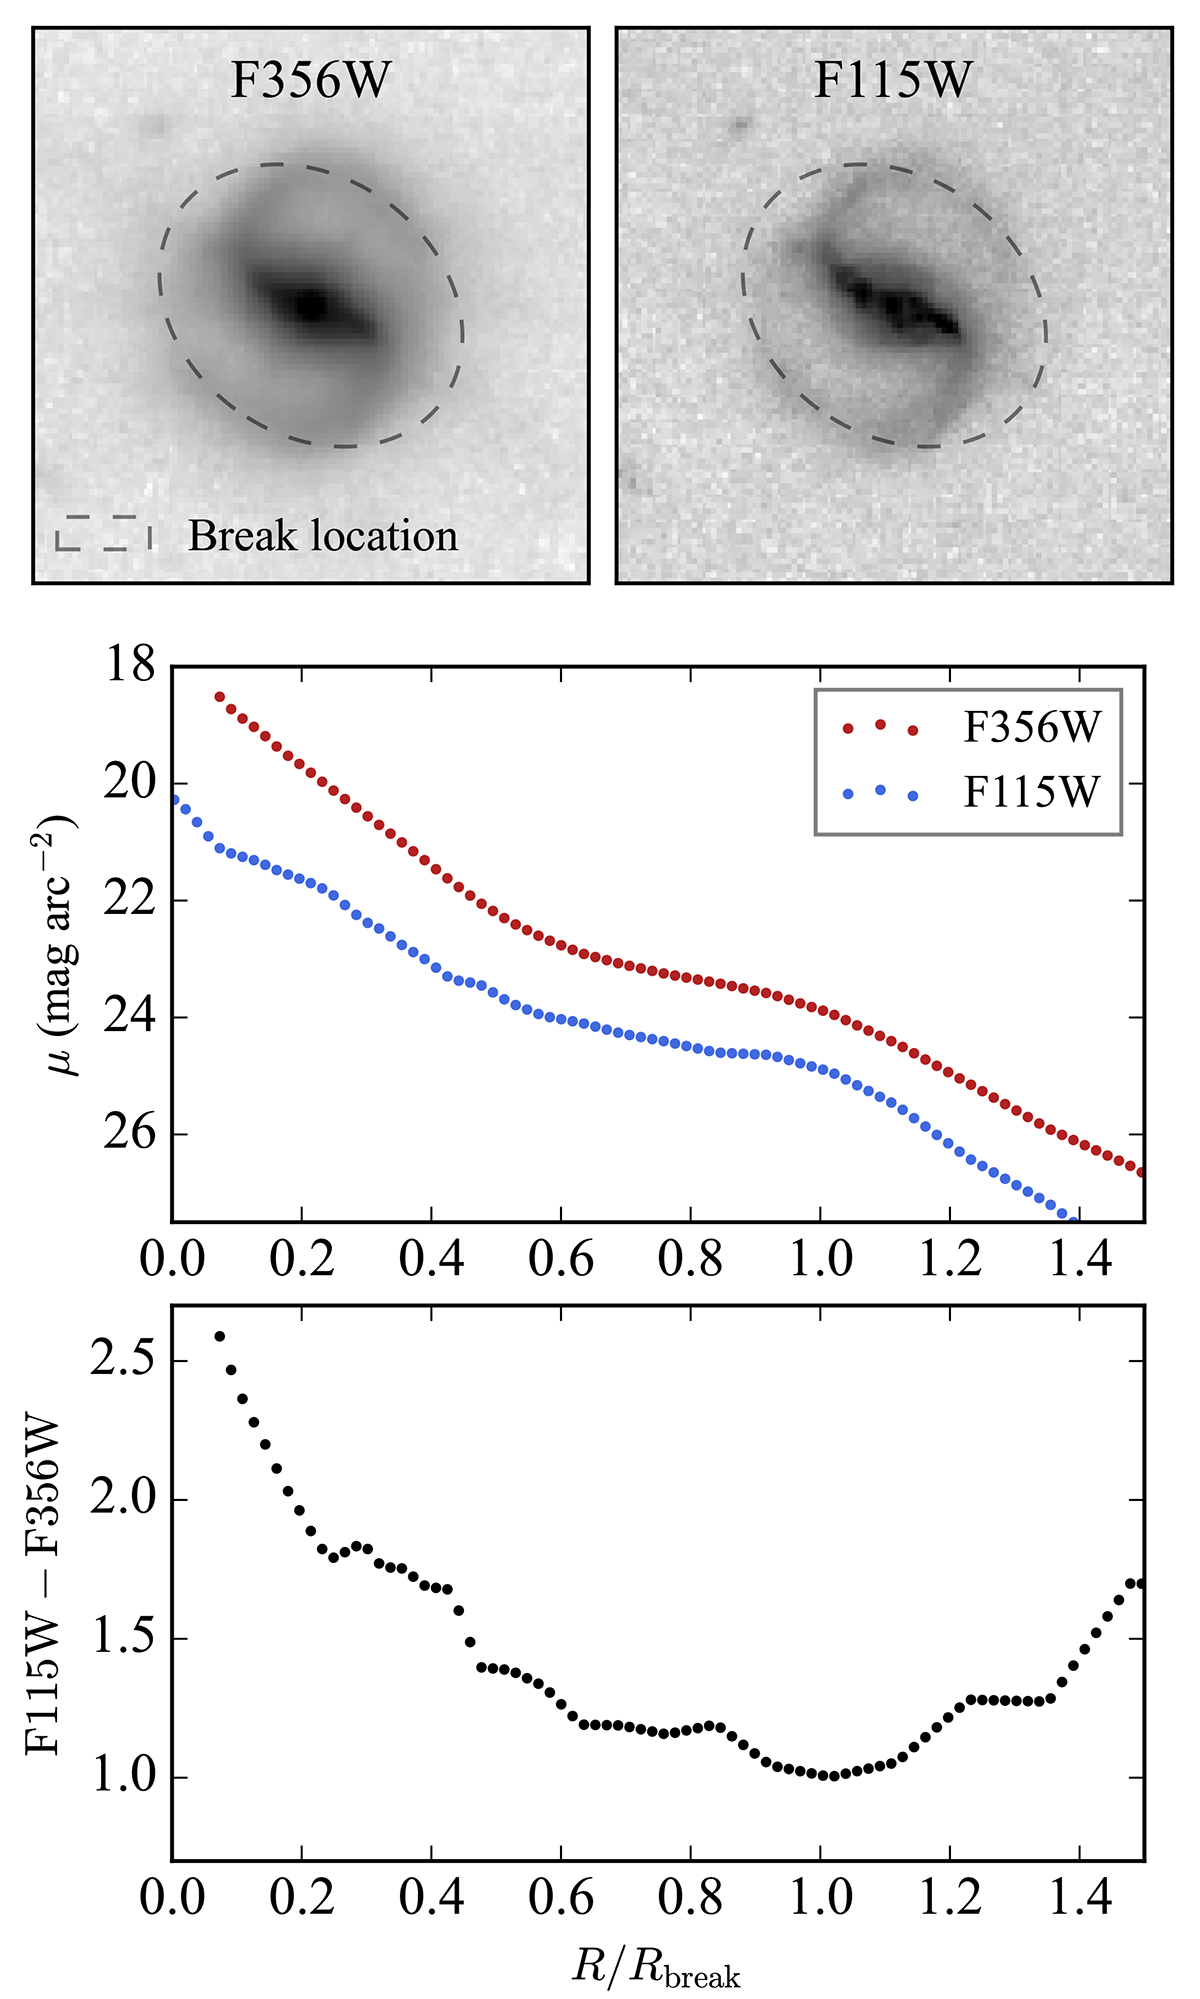
Illustration of the calculation of color profiles. The upper panels display the F356W- and F115W-band images of the CEERS galaxy at ![]() and
and ![]() . The dashed ellipse marks the break location. The middle panel shows the extracted deconvolved surface-brightness profiles for F115W band, marked in blue, and for F356W band, marked in red. The calculated color profile, exhibiting a clear U-shape, is shown in the bottom panel.
. The dashed ellipse marks the break location. The middle panel shows the extracted deconvolved surface-brightness profiles for F115W band, marked in blue, and for F356W band, marked in red. The calculated color profile, exhibiting a clear U-shape, is shown in the bottom panel.
Current usage metrics show cumulative count of Article Views (full-text article views including HTML views, PDF and ePub downloads, according to the available data) and Abstracts Views on Vision4Press platform.
Data correspond to usage on the plateform after 2015. The current usage metrics is available 48-96 hours after online publication and is updated daily on week days.
Initial download of the metrics may take a while.