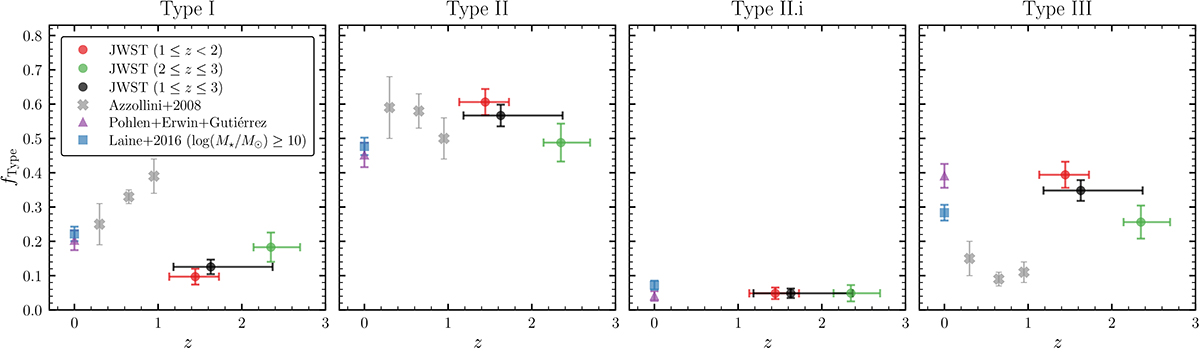
Fig. 3.
Download original image
Comparison of our derived fractions of type I, type II, type II.i, and type III profiles with those in previous studies. Our results are calculated in three redshift bins and are marked by points positioned at the median redshift. Results derived from the combined data of studies Pohlen & Trujillo (2006), Erwin et al. (2008), and Gutiérrez et al. (2011) in the same series are marked as blue squares; those reported in Laine et al. (2014) are marked by purple triangles. Results based on HST reported in Azzollini et al. (2008) are shown by grey crosses. Error bars associated with the symbols denote the statistical uncertainties.
Current usage metrics show cumulative count of Article Views (full-text article views including HTML views, PDF and ePub downloads, according to the available data) and Abstracts Views on Vision4Press platform.
Data correspond to usage on the plateform after 2015. The current usage metrics is available 48-96 hours after online publication and is updated daily on week days.
Initial download of the metrics may take a while.