| Issue |
A&A
Volume 682, February 2024
|
|
|---|---|---|
| Article Number | L4 | |
| Number of page(s) | 9 | |
| Section | Letters to the Editor | |
| DOI | https://doi.org/10.1051/0004-6361/202349105 | |
| Published online | 31 January 2024 | |
Letter to the Editor
Discovery of thiofulminic acid with the QUIJOTE line survey: A study of the isomers of HNCS and HNCO in TMC-1⋆
1
Dept. de Astrofísica Molecular, Instituto de Física Fundamental (IFF-CSIC), C/ Serrano 121, 28006 Madrid, Spain
e-mail: jose.cernicharo@csic.es
2
Observatorio Astronómico Nacional (OAN, IGN), C/ Alfonso XII, 3, 28014 Madrid, Spain
3
Centro de Desarrollos Tecnológicos, Observatorio de Yebes (IGN), 19141 Yebes, Guadalajara, Spain
Received:
26
December
2023
Accepted:
9
January
2024
We present the first detection of HCNS (thiofulminic acid) in space with the QUIJOTE line survey in the direction of TMC-1. We performed a complete study of the isomers of CHNS and CHNO, including NCO and NCS. The derived column densities for HCNS, HNCS, and HSCN are (9.0 ± 0.5) × 109, (3.2 ± 0.1) × 1011, and (8.3 ± 0.4) × 1011 cm−2, respectively. The HNCS/HSCN abundance ratio is 0.38. The abundance ratios HNCO/HNCS, HCNO/HCNS, HOCN/HSCN, and NCO/NCS are 34 ± 4, 8.3 ± 0.7, 0.18 ± 0.03, and 0.78 ± 0.07, respectively. These ratios cannot be correctly reproduced by our gas-phase chemical models, which suggests that formation paths for these species are missing, and/or that the adopted dissociative recombination rates for their protonated precursors have to be revised. The isotopologues H15NCO, DNCO, HN13CO, DCNO, H34SCN, and DSCN have also been detected with the ultrasensitive QUIJOTE line survey.
Key words: astrochemistry / line: identification / molecular data / ISM: molecules / ISM: individual objects
Based on observations with the Yebes 40 m radio telescope (projects 19A003, 20A014, 20D023, 21A011, 21D005, 22A007, 22B029, and 23A024) and the IRAM 30m radiotelescope. The 40 m radiotelescope at Yebes Observatory is operated by the Spanish Geographic Institute (IGN, Ministerio de Transportes y Movilidad Sostenible). IRAM is supported by INSU/CNRS (France), MPG (Germany), and IGN (Spain).
© The Authors 2024
 Open Access article, published by EDP Sciences, under the terms of the Creative Commons Attribution License (https://creativecommons.org/licenses/by/4.0), which permits unrestricted use, distribution, and reproduction in any medium, provided the original work is properly cited.
This article is published in open access under the Subscribe to Open model. Subscribe to A&A to support open access publication.
1. Introduction
Among the new species discovered in recent years with the QUIJOTE1 line survey of TMC-1 (Cernicharo et al. 2021a, 2023a,b, and references therein), it is worth noting that 11 of them are S-bearing species: NCS, HCCS, H2CCS, H2CCCS, C4S, HCSCN, HCSCCH, HC4S, HC3S+, HCCS+, and HSO (Cernicharo et al. 2021b,c,d; Cabezas et al. 2022a; Fuentetaja et al. 2022; Marcelino et al. 2023). The chemical models for S-bearing molecules in interstellar clouds poorly reproduce the observed abundances and the results are strongly dependent on the adopted depletion of sulfur (Vidal et al. 2017). Moreover, many reactions involving S+ with neutrals, as well as radicals with S and CS, are missing in the chemical networks and further study is required in order to achieve better agreement between chemical models and observations of sulfur-bearing species (Petrie 1996; Bulut et al. 2021). In addition to these new species, other S-bearing molecules such as CS, SO, NS, NS+, HCS+, HSC, HCS, CCS, C3S, C5S, H2CS, HSCN, and HNCS are present in TMC-1 (see Table 1 in Cernicharo et al. 2021b). Despite the high depletion of sulphur in molecular clouds, most of these species are the counterpart of the same molecular structure but replacing sulphur with oxygen. Only C4O, HCCO+, and HC4O have not yet been detected in TMC-1, or indeed in any other source. HNCS (Frerking et al. 1979) and HSCN (Halfen et al. 2009) are isomers of the CHNS family, and obvious counterparts of the isomers of CHNO. For the latter family, HNCO (Snyder & Buhl 1972), HCNO (Marcelino et al. 2009), and HOCN (Brünken et al. 2009a; Marcelino et al. 2010) have been detected in space in a broad sample of cold and warm molecular clouds.
The study of isomers of the same molecule provides clues as to the formation mechanism of these species, as often they are produced from a common precursor. The recent detection of five cyano derivatives of propene, which have energies ranging from 0 to 19.6 kJ mol−1 (0–2357 K) but similar abundances, indicates that kinetics, and not energetics, is dominating the production of these different isomers (Cernicharo et al. 2022a). The most relevant isomers in space are HCN and HNC, which are assumed to be produced from the dissociative electronic recombination (DR) of HCNH+. In cold dark clouds, these isomers have an abundance ratio of ∼1 in spite of the much higher energy of HNC of 55 kJ mol−1 (Baulch et al. 2005; Mendes et al. 2012, and references therein). Their chemistry in interstellar clouds was analysed in detail by Loison et al. (2014).
Concerning the CHNS and CHNO isomers, it is assumed that the first are mainly formed from DR of H2NCS+ and HNCSH+ (Adande et al. 2010; Gronowski & Kolos 2014), and the second from DR of H2NCO+ and HNCOH+ (Marcelino et al. 2010; Quan et al. 2010). In the present work, we present the first detection of HCNS (thiofulminic acid) in space (TMC-1) and a coherent and precise study of the abundances of the isomers of CHNS and CHNO. The isotopologues H34SCN, DSCN, H15NCO, HN13CO, DNCO, and DCNO are also detected in TMC-1. The derived abundances for the CHNS and CHNO isomers, together with those of NCS and NCO, are compared with the results of state-of-the-art chemical models for S-bearing species.
2. Observations
The observational data used in this work are part of QUIJOTE (Cernicharo et al. 2021a), a spectral line survey of TMC-1 in the Q-band carried out with the Yebes 40 m telescope at the position αJ2000 = 4h41m41.9s and δJ2000 = +25° 41′27.0″, corresponding to the cyanopolyyne peak (CP) in TMC-1. A detailed description of the system is given by Tercero et al. (2021), and details on the QUIJOTE line survey are provided by Cernicharo et al. (2021a, 2023a,b). The data analysis procedure is described by Cernicharo et al. (2022b). The total observing time on source is 1202 hours and the measured sensitivity varies between 0.07 mK at 32 GHz and 0.2 mK at 49.5 GHz.
The main beam efficiency can be given across the Q-band by Beff = 0.797 exp[−(ν(GHz)/71.1)2]. The forward telescope efficiency is 0.95 and the beam size at half power intensity is 54.4″ and 36.4″ at 32.4 and 48.4 GHz, respectively.
In addition to the Q-band data, the isomers of HNCO and HNCS were observed in the millimetre domain with the IRAM 30 m telescope and consist of a 3 mm line survey that covers the 71.6–116 GHz domain (Cernicharo et al. 2012, 2023b; Agúndez et al. 2022; Cabezas et al. 2022a). The final 3 mm line survey has a sensitivity of 2–10 mK. However, at some selected frequencies, the sensitivity is as low as 0.6 mK. The IRAM 30 m beam varies between 34″ and 21″ at 72 GHz and 117 GHz, respectively, while the beam efficiency takes values of 0.83 and 0.78 at the same frequencies (Beff = 0.871 exp[−(ν(GHz)/359)2]). The forward efficiency at 3 mm is 0.95.
The absolute intensity calibration uncertainty is 10%. However, the relative calibration between lines within the QUIJOTE survey is certainly better because all them are observed simultaneously and have the same calibration uncertainties. The data were analysed with the GILDAS package2.
3. Results
Line identification in this work was performed using the MADEX code (Cernicharo 2012), and the CDMS and JPL catalogues (Müller et al. 2005; Pickett et al. 1998). The references for the laboratory data used by MADEX in its spectroscopic predictions are described below. The intensity scale used in this study is the antenna temperature ( ). Consequently, the telescope parameters and source properties were used when modelling the emission of the different species in order to produce synthetic spectra in this temperature scale. The permanent dipolar moments of the molecular species studied in this work are given in Table 1. In this work, we assumed a velocity for the source relative to the local standard of rest of 5.83 km s−1 (Cernicharo et al. 2020). The source is assumed to be circular with a uniform brightness temperature and a radius of 40″ (Fossé et al. 2001). The procedure to derive line parameters is described in Appendix A. The observed line intensities were modelled using a local thermodynamical equilibrium hypothesis (LTE), or a large velocity gradient approach (LVG). In the latter case, MADEX uses the formalism described by Goldreich & Kwan (1974).
Derived column densities for the isomers of HNCO and HNCS.
3.1. The HCNS, HSCN, and HNCS isomers
The HCNS, HNCS, and HSCN isomers were observed with high spectral resolution in the laboratory (Brünken et al. 2009b; McGuire et al. 2016). The frequencies measured in these studies were fitted using the adapted Hamiltonian for each species and the resulting rotational constants were implemented into the MADEX code to predict transition frequencies and to model the observed emission line profiles.
HNCS and HSCN are well-known molecular components of interstellar clouds (Frerking et al. 1979; Halfen et al. 2009; Adande et al. 2010; Vastel et al. 2018). They harbour strong lines in our line survey. However, the isomer HCNS has not been detected yet in space. It is the thio-form of HCNO, an isomer of HNCO and a molecule detected in several interstellar clouds (Marcelino et al. 2009). Thanks to the sensitivity of QUIJOTE, we report in this work the first detection of its two lines in the Q-band (J = 3 − 2 and J = 4 − 3) in space, namely towards TMC-1. The lines are detected with a signal-to-noise ratio (S/N) of ∼12 and match the predicted frequencies within 3 kHz (see Fig. 1). The derived line parameters are given in Table A.1. The sensitivity of our line survey at 3 mm with the IRAM 30 m telescope is not as high as that of QUIJOTE. Nevertheless, the J = 6 − 5 line of HCNS at 73 815.849 MHz is detected at a 3σ level in the data (see Fig. A.1). We also observed this line with the Yebes 40 m telescope using the W-band receiver described by Tercero et al. (2021). Near the frequency of the HCNS J = 6 − 5 transition, there is a line of CCC13CH that is detected with good S/N with both telescopes. It has an intensity of 10 mK and has been used to scale the data of the Yebes 40 m and the IRAM 30 m telescopes. The two sets of data were merged, weighting them as 1/σ2. The resulting data allow us to detect the J = 6 − 5 line of HCNS at 4σ. The results are shown in Fig. A.1. We conclude that HCNS is convincingly detected in TMC-1. A fit to the laboratory and astronomical frequencies for this species provides the following new molecular constants: B = 6151.44367 ± 0.00027 MHz, D = 1.712 ± 0.016 kHz, and eQq = −0.7227 ± 0.0018 MHz.
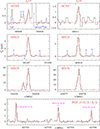 |
Fig. 1. Observed Ju = 3 and 4 (Ka = 0) transitions of the isomers of HCNS. The bottom panel shows the hyperfine components of the J = 5/2 − 3/2 transition of NCS in its 2Π3/2 ground state. The abscissa corresponds to the rest frequency. The ordinate is the antenna temperature corrected for atmospheric and telescope losses, in mK. Blanked channels correspond to negative features produced when folding the frequency-switched data. The red line shows the computed synthetic spectra for these lines (see Sect. 3). The derived line parameters are given in Table A.1. |
From the observed intensities of these three lines of HCNS, and using a line profile fit method (Cernicharo et al. 2021d), we obtain Trot = 7.0 ± 0.5 K and N(HCNS) = (9.0 ± 0.5) × 109 cm−2. The synthetic spectra are shown in Figs. 1 and A.1, and are in excellent agreement with the observations. No collisional rates are available for HCNS, but with the aim to estimate the excitation conditions that could be expected for this molecule in the LVG approximation, we adopted the collisional rates of OCS with H2 calculated by Green & Chapman (1978). OCS has a rotational constant similar to that of HCNS, and therefore we consider that these rates provide a better approximation to those of HCNS than the rates of HCNO (Naindouba et al. 2015), which has a rotational constant twice that of HCNS. For the typical volume densities of TMC-1 of 1 × 104 cm−3 (Agúndez et al. 2023; Fuentetaja et al., in prep.), we obtain that the excitation temperatures of the observed lines could vary between 8.2 K for the J = 3 − 2 line down to 6.2 K for the J = 6 − 5 transition, in good agreement with the derived averaged rotational temperature of 7 K.
The Ju = 3, 4 with Ka = 0 transitions of HNCS and HSCN appear in our QUIJOTE data as features exhibiting all their hyperfine components with a very high S/N. These transitions are shown in Fig. 1. The corresponding Ka = 1 lines of HNCS have upper energy levels of 66 (Ju = 3) and 68 K (Ju = 4) and are not detected in our data. However, the corresponding energies for HSCN are only at 16.9 and 19.2 K, respectively. We detected these latter; they are shown in Fig. A.2. Moreover, the Ju = 7, 8 transitions with Ka = 0 of both isomers were detected with the IRAM 30 m telescope (see Fig. A.2). The derived line parameters for all these lines are given in Table A.1. No collisional rates are available for either of the two isomers. We used all observed lines using the line profile fitting procedure (Cernicharo et al. 2021d) to derive their rotational temperature and column densities. For HNCS, we obtain Trot = 6.0 ± 0.5 K and N(HNCS) = (3.2 ± 0.1) × 1011 cm−2. For HSCN, we derived Trot = 5.2 ± 0.3 K and N(HSCN, Ka = 0) = (6.9 ± 0.2)×1011 cm−2, and N(HSCN, Ka = 1) = (1.4±0.3)×1011 cm−2. The interladder temperature between Ka = 0 and 1 lines could be thermalised by collisions at the kinetic temperature of the cloud. For an energy separation between these ladders of 14.5 K, we derive a kinetic temperature for TMC-1 of 9.1±1.5 K, which is in excellent agreement with the result obtained by Agúndez et al. (2023).
The isomer HSNC has been characterised in the laboratory (McGuire et al. 2016) and we searched for its lines in our survey. However, we only obtained an upper limit of 4 × 109 cm−2 for its column density. Of particular interest for the chemistry of the CHNS isomers, it is worth deriving the column density of NCS as it could participate in their formation. NCS was discovered in TMC-1 with previous QUIJOTE line data (Cernicharo et al. 2021b). The new data are shown in Fig. 1. Adopting a rotational temperature of 5.5 K, the derived column density is (9.5 ± 0.2) × 1011 cm−2. The NCS to HNCS abundance ratio is 3.0 ± 0.16.
Among the isomers of the CHNS family, the most abundant is HSCN. Its lines are strong enough to allow a search for its isotopologues. We observed two rotational transitions exhibiting hyperfine structure for H34SCN and DSCN (see Fig. A.3). Adopting the same rotational temperature as for the main isotopologue, we derive the column densities given in Table 1. The 32S/34S abundance ratio is 33 ± 5, which agrees with previous determinations using other molecular species (see e.g., Cernicharo et al. 2021b and Fuentetaja et al., in prep., and references therein). The H/D abundance ratio is also 33 ± 5 and represents a considerable single deuterium enhancement in HSCN, in line with that observed in other molecules in TMC-1 (Cabezas et al. 2021, 2022b, and references therein).
3.2. The HNCO, HCNO, and HOCN isomers
HNCO was one of the first molecules detected in the early years of millimetre radio astronomy by Snyder & Buhl (1972). Its isomer HCNO (fulminic acid) was detected by Marcelino et al. (2009) towards B1, L1544, and L183, but not in TMC-1. Another isomer, HOCN, was detected towards SgrB2, B1-b, L1544, L1527, L183, and IRAS 16293−2422 (Brünken et al. 2009a, 2010; Marcelino et al. 2010). Therefore, these isomers have been detected in space in a broad sample of cold and warm molecular clouds. The level energies, transition frequencies, and intensities for HNCO and its isotopologues, as well as for HOCN, are from the JPL and CDMS catalogues, respectively. HCNO is a quasi-linear molecule and its rotational frequencies were obtained from a fit to available laboratory data (Winnewisser & Winnewisser 1971). The three isomers and the isotopologues 15N, 13C, and D of HNCO have been detected with QUIJOTE in TMC-1. The data are shown in Fig. A.4 and the derived line parameters are given in Table A.2. We note that for HN13CO and DNCO, our measured frequencies have a significant lower uncertainty than those in the entries of the JPL catalogue.
The HNCO lines are the strongest among those of all its isomers. We also detected the 404 − 303 and 505 − 404 lines at 3 mm with the IRAM 30 m radio telescope. These lines are shown in Fig. A.5. Collisional rates for HNCO with He (TK ≥ 30 K; Green 1986) and H2 (TK ≥ 7 K; Sahnoun et al. 2018) are available. For a volume density of 1–2 × 10⁴, our LVG calculations using the p–H2 collisional rates provide excitation temperatures for the 20, 2 − 10, 1 line of HNCO of 8–9 K, decreasing to ∼5 K for the 505 − 404 transition. We therefore adopted a rotational temperature of 8 K for HNCO and its isotopologues in the Q-band, and of 4.8 K in the 3 mm domain. The derived column densities are given in Table 1 and the computed synthetic spectra are shown in red in Figs. A.4 and A.5. The HNCO/HN13CO, HNCO/DNCO, and HNCO/H15NCO abundance ratios are 52 ± 8, 44 ± 8, and 333 ± 60.
The isomers HCNO and HOCN have dipolar moments of 3.1 and 3.7 D, respectively (see Table 1). For HCNO we used the LVG approximation using the collisional rates of HCNO with He calculated by Naindouba et al. (2015). For a density of 1–2 × 104 cm−3, we obtain rotational temperatures in the range of 4.9–5.5 K. HCNO is detected for the first time in TMC-1. We also observed its J = 4 − 3 transition at 3 mm (see Fig. A.2). The estimated column density for this isomer of HNCO is (7.8 ± 0.2) × 1010 cm−2. We also observed the J = 2 − 1 of DCNO in the Q-band (see Fig. A.5). The derived HCNO/DCNO abundance ratio is 25 ± 4. For HOCN, we observed the 20, 2 − 10, 1 with QUIJOTE and its 404 − 303 and 505 − 404 lines at 3 mm (see Fig. A.5). All the observed lines are well reproduced by the models with a rotational temperature similar to that of HCNO (Trot = 5.5 K) as shown by the computed synthetic spectra shown in Figs. A.4 and A.5. The derived column densities for HCNO and HOCN are given in Table 1. The fundamental transition of HOCN at 20.9 GHz was tentatively observed in TMC-1 by Brünken et al. (2009b).
We detected the four strongest hyperfine components of the J = 7/2 − 5/2 transition of NCO in its 2Π3/2 ground state at 3 mm. This species was recently detected towards L483 by Marcelino et al. (2018) with an NCO/HNCO abundance ratio of ∼0.2. Due to the modest dipole moment of this species (μ = 0.64 D; Saito & Amano 1970), we modelled the TMC-1 data adopting Trot(NCO) = 8 K. The derived column density is (7.4 ± 0.5) × 1011 cm−2 and the NCO/HNCO abundance ratio is 0.067, which is three times lower than towards L483. However, in TMC-1 the NCS/HNCS ratio is 45 times larger than the NCO/HNCO one. We also searched for the isomer HONC (Mladenovic et al. 2009), but only obtained upper limits (see Table 1). Finally, three lines of H2NCO+ were observed in the Q-band. These are shown in Fig. A.6 and their line parameters are given in Table A.2. Adopting a rotational temperature of 5.5 K and a o/p abundance ratio of 3:1, the derived total column density for this species is (1.8 ± 0.4) × 1010 cm−2.
4. Discussion
The most energetically stable isomer of the CHNS family is HNCS, followed by HSCN, HCNS, and HSNC at 3171, 17 317, and 18 120 K above, respectively (Wierzejewska & Moc 2003; McGuire et al. 2016). The energy ordering in the oxygen family is similar, with HNCO being the most stable isomer, and HOCN, HCNO, and HONC lying at 12 330, 34 480, and 42 235 K above, respectively (Schuurman et al. 2003). In spite of the similarities in the energetics, the CHNO and CHNS families show a very different behaviour in TMC-1. While HNCO is far more abundant than HOCN, the abundance of HNCS is only half of that of HSCN (see Table 2).
Derived abundance ratios for the isomers of HNCO and HNCS in TMC-1.
The chemistry of HNCS and its isomers has been discussed by Adande et al. (2010), Gronowski & Kolos (2014), and Vidal et al. (2017). Here, we revisit the subject by running a gas-phase chemical model of a cold dense cloud (see details in Cernicharo et al. 2021b and Fuentetaja et al. 2022). The chemical scheme of synthesis of HNCS and HSCN can be summarized as
where the scheme begins with the protonation of NCS by abundant proton donors XH+, such as HCO+, H3O+, and  . This scheme, replacing sulfur by oxygen, is the same one that describes the formation of the oxygen analogues HNCO and HOCN (Marcelino et al. 2010; Quan et al. 2010; Lattanzi et al. 2012). The chemical schema start with the radicals NCO and NCS, which are mostly formed through neutral–neutral reactions. According to the chemical model, the main reactions forming NCO are N + HCO and CN + O2, while NCS is mainly formed through the analogous reactions N + HCS and CN + SO.
The abundances calculated with the chemical model are shown in Fig. 2. We focus on times around a few 105 yr, when most molecules reach their peak abundances. The abundances calculated for NCO and HNCO are in line with the observed values. In the case of HOCN, the calculated abundance is close to that of HNCO, while observations indicate that HOCN is much less abundant than HNCO. It is likely that the dissociative recombination of HNCOH+ favours HNCO over HOCN (the model assumes equal branching ratios) or that the reaction between HNCO+ and H2 favours H2NCO+ over HNCOH+ (equal yields are assumed at present). Investigation into these two reactions would allow us to understand the high observed HNCO/HOCN ratio. Grain surface chemistry may also be responsible for this. Indeed, the gas-grain model of Quan et al. (2010) predicted HNCO to be somewhat more abundant than HCNO. The detection of the precursors H2NCO+ and HNCOH+ would also be very useful to shed light on this. While the H2NCO+ cation has been detected in interstellar clouds (Gupta et al. 2013; Marcelino et al. 2018), its isomer HNCOH+ is still awaiting detection in space (laboratory frequencies are available from Mladenovic et al. 2009). Only the H2NCO+ cation is detected in our TMC-1 data.
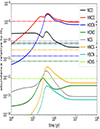 |
Fig. 2. Abundances calculated with the chemical model for molecules of the families of HNCO and HNCS. The peak calculated abundance of HCNS is around 10−15 relative to H2 and therefore lies outside the abundance range shown. Horizontal dashed lines correspond to the abundances observed in TMC-1. |
In the case of the sulfur analogues NCS, HNCS, and HSCN, the model severely underestimates their abundances. It is likely that the model lacks efficient routes to NCS, hampering the subsequent formation of HNCS and HSCN. A similar situation was encountered in previous chemical models, with abundances relative to H2 ≲ 10−12 for HNCS and HSCN (Adande et al. 2010; Gronowski & Kolos 2014; Vidal et al. 2017). Apart from the general problem of abundance underestimation, the fact that HSCN is observed to be more abundant than HNCS, in contrast to the oxygen case, indicates that the branching ratios of reactions (2) and (4) must be markedly different to those of the analogous oxygen reactions. Identification of the precursor cations H2NCS+ and HNCSH+ would also help to constrain the chemistry of HNCS and HSCN, although their rotational spectrum has not yet been characterised in the laboratory.
The third observed species of the family of HNCO isomers, namely HCNO, has a different skeleton to the other two isomers and is therefore formed in a different way. According to the chemical model, the neutral–neutral reaction CH2 + NO (Marcelino et al. 2009) is the main source of HCNO. The analogous molecule with sulfur, HCNS (the one reported here), is severely underestimated by the chemical model. The analogous reaction CH2 + NS cannot account for HCNS because in TMC-1, NS is 160 times less abundant than NO, while HCNS is just 9 times less abundant than HCNO (see Table 2). Among the potential missing routes to HCNS, we could consider the neutral–neutral reactions HCN + SH, CN + H2S, N + H2CS, NH + HCS, and NH2 + CS. To our knowledge, these reactions have not been studied either theoretically or experimentally, and therefore we do not know whether or not they are fast at low temperatures and produce HCNS as a product. Among these reactions, the most efficient by far is N + H2CS, which would provide an HCNS abundance of the order of the observed one assuming that it has a rate coefficient of the order of 1 × 10⁻¹⁰ cm3 s−1 at low temperature.
We conclude that further experimental and theoretical work is needed to understand the chemistry of the HNCS and HNCO isomers. In particular, the enhancement of the abundance of HSCN relative to HNCS and HOCN, as well as the behaviour of the NCS/HNCS and NCO/HNCO abundance ratios, are not well reproduced by the present chemical models.
Acknowledgments
We thank Ministerio de Ciencia e Innovación of Spain (MICIU) for funding support through projects PID2019-106110GB-I00, and PID2019-106235GB-I00. We also thank ERC for funding through grant ERC-2013-Syg-610256-NANOCOSMOS.
References
- Adande, G. R., Halfen, D. T., Ziurys, L. M., et al. 2010, ApJ, 725, 561 [NASA ADS] [CrossRef] [Google Scholar]
- Agúndez, M., Cabezas, C., Marcelino, N., et al. 2022, A&A, 659, L9 [NASA ADS] [CrossRef] [EDP Sciences] [Google Scholar]
- Agúndez, M., Marcelino, N., Tercero, B., et al. 2023, A&A, 677, A106 [NASA ADS] [CrossRef] [EDP Sciences] [Google Scholar]
- Baulch, D. L., Bowman, C. T., Cobos, C. J., et al. 2005, J. Phys. Chem. Ref. Data, 34, 757 [Google Scholar]
- Brünken, S., Gottlieb, C. A., McCarthy, M. C., & Thaddeus, P. 2009a, ApJ, 697, 880 [CrossRef] [Google Scholar]
- Brünken, S., Yu, Z., Gottlieb, C. A., et al. 2009b, ApJ, 706, 1588 [CrossRef] [Google Scholar]
- Brünken, S., Belloche, A., Martín, S., et al. 2010, A&A, 516, A109 [NASA ADS] [CrossRef] [EDP Sciences] [Google Scholar]
- Bulut, N., Roncero, O., Aguado, A., et al. 2021, A&A, 646, A5 [NASA ADS] [CrossRef] [EDP Sciences] [Google Scholar]
- Cabezas, C., Roueff, E., Tercero, B., et al. 2021, A&A, 650, L15 [NASA ADS] [CrossRef] [EDP Sciences] [Google Scholar]
- Cabezas, C., Agúndez, M., Marcelino, N., et al. 2022a, A&A, 657, L4 [NASA ADS] [CrossRef] [EDP Sciences] [Google Scholar]
- Cabezas, C., Agúndez, M., Marcelino, N., et al. 2022b, A&A, 657, L5 [NASA ADS] [CrossRef] [EDP Sciences] [Google Scholar]
- Cernicharo, J. 2012, EAS Publ. Ser., 251 [NASA ADS] [CrossRef] [EDP Sciences] [Google Scholar]
- Cernicharo, J., Marcelino, N., Rouef, E., et al. 2012, ApJ, 759, L43 [Google Scholar]
- Cernicharo, J., Lefloch, B., Agúndez, M., et al. 2018, ApJ, 853, L22 [CrossRef] [Google Scholar]
- Cernicharo, J., Marcelino, N., Agúndez, M., et al. 2020, A&A, 642, L8 [NASA ADS] [CrossRef] [EDP Sciences] [Google Scholar]
- Cernicharo, J., Agúndez, M., Kaiser, R., et al. 2021a, A&A, 652, L9 [NASA ADS] [CrossRef] [EDP Sciences] [Google Scholar]
- Cernicharo, J., Cabezas, C., Agúndez, M., et al. 2021b, A&A, 648, L3 [EDP Sciences] [Google Scholar]
- Cernicharo, J., Cabezas, C., Endo, Y., et al. 2021c, A&A, 650, L14 [NASA ADS] [CrossRef] [EDP Sciences] [Google Scholar]
- Cernicharo, J., Cabezas, C., Endo, Y., et al. 2021d, A&A, 646, L3 [EDP Sciences] [Google Scholar]
- Cernicharo, J., Fuentetaja, R., Cabezas, C., et al. 2022a, A&A, 663, L5 [NASA ADS] [CrossRef] [EDP Sciences] [Google Scholar]
- Cernicharo, J., Fuentetaja, R., Agúndez, M., et al. 2022b, A&A, 663, L9 [NASA ADS] [CrossRef] [EDP Sciences] [Google Scholar]
- Cernicharo, J., Pardo, J. R., Cabezas, C., et al. 2023a, A&A, 670, L19 [NASA ADS] [CrossRef] [EDP Sciences] [Google Scholar]
- Cernicharo, J., Tercero, B., Cabezas, C., et al. 2023b, A&A, submitted [Google Scholar]
- Fossé, D., Cernicharo, J., Gerin, M., & Cox, P. 2001, ApJ, 552, 168 [Google Scholar]
- Frerking, M. A., Linke, R. A., & Thaddeus, P. 1979, ApJ, 234, L143 [NASA ADS] [CrossRef] [Google Scholar]
- Fuentetaja, R., Agúndez, M., Cabezas, C., et al. 2022, A&A, 667, L4 [NASA ADS] [CrossRef] [EDP Sciences] [Google Scholar]
- Gerin, M., Viala, Y., & Casoli, F. 1993, A&A, 268, 212 [NASA ADS] [Google Scholar]
- Goldreich, P., & Kwan, J. 1974, ApJ, 189, 441 [CrossRef] [Google Scholar]
- Green, S., & Chapman, S. 1978, ApJS, 37, 169 [Google Scholar]
- Green, S. 1986, NASA Technical Memorandum, NASA TM 87791 [Google Scholar]
- Gronowski, M., & Kolos, R. 2014, ApJ, 792, 89 [NASA ADS] [CrossRef] [Google Scholar]
- Gupta, H., Gottlieb, C. A., Lattanzi, V., et al. 2013, ApJ, 778, L1 [NASA ADS] [CrossRef] [Google Scholar]
- Halfen, D. T., Ziurys, L. M., Brünken, S., et al. 2009, ApJ, 702, L124 [NASA ADS] [CrossRef] [Google Scholar]
- Lattanzi, V., Thorwirth, S., Gottlieb, C. A., & McCarthy, M. C. 2012, J. Phys. Chem. Lett., 3, 3420 [NASA ADS] [CrossRef] [Google Scholar]
- Loison, J.-C., Wakelam, V., & Hickson, K. M. 2014, MNRAS, 443, 398 [Google Scholar]
- McGuire, B. A., Martin-Drumel, M.-A., Thorwirth, S., et al. 2016, PCCP, 18, 22693 [NASA ADS] [CrossRef] [Google Scholar]
- Marcelino, N., Cernicharo, J., Tercero, B., & Roueff, E. 2009, ApJ, 690, L27 [CrossRef] [Google Scholar]
- Marcelino, N., Brünken, S., Cernicharo, J., et al. 2010, A&A, 516, A105 [NASA ADS] [CrossRef] [EDP Sciences] [Google Scholar]
- Marcelino, N., Agúndez, M., Cernicharo, J., et al. 2018, A&A, 612, L10 [NASA ADS] [CrossRef] [EDP Sciences] [Google Scholar]
- Marcelino, N., Puzzarini, C., Agúndez, M., et al. 2023, A&A, 674, L13 [NASA ADS] [CrossRef] [EDP Sciences] [Google Scholar]
- Mendes, M., Buhr, H., & Berg, M. 2012, ApJ, 746, L8 [NASA ADS] [CrossRef] [Google Scholar]
- Mladenovic, M., Lewerenz, M., McCarthy, M. C., & Thaddeus, P. 2009, J. Chem. Phys., 131, 174308 [NASA ADS] [CrossRef] [Google Scholar]
- Müller, H. S. P., Schlöder, F., Stutzki, J., & Winnewisser, G. 2005, J. Mol. Struct., 742, 215 [Google Scholar]
- Naindouba, A., Nkem, C., Ajili, Y., et al. 2015, Chem. Phys. Lett., 636, 67 [NASA ADS] [CrossRef] [Google Scholar]
- Petrie, S. 1996, MNRAS, 281, 666 [NASA ADS] [Google Scholar]
- Pickett, H. M., Poynter, R. L., Cohen, E. A., et al. 1998, J. Quant. Spectrosc. Radiat. Transf., 60, 883 [Google Scholar]
- Quan, D., Herbst, E., Osamura, Y., et al. 2010, ApJ, 725, 2101 [NASA ADS] [CrossRef] [Google Scholar]
- Sahnoun, E., Wiesenfeld, L., Hammami, K., & Jadane, N. 2018, J. Phys. Chem. A, 122, 3004 [NASA ADS] [CrossRef] [Google Scholar]
- Saito, S., & Amano, T. 1970, J. Mol. Spectrosc., 34, 383 [NASA ADS] [CrossRef] [Google Scholar]
- Schuurman, M. S., Muir, S. R., Allen, W. D., & Schaefer, H. F. III 2003, J. Chem. Phys., 120, 11586 [Google Scholar]
- Snyder, L. E., & Buhl, D. 1972, ApJ, 177, 619 [Google Scholar]
- Szalanski, L. B., Gerry, M. C. L., Winnewisser, G., et al. 1978, Can. J. Phys., 56, 1297 [NASA ADS] [CrossRef] [Google Scholar]
- Takashi, R., Tanaka, K., & Tanaka, T. 1989, J. Mol. Spectrosc., 138, 450 [NASA ADS] [CrossRef] [Google Scholar]
- Tercero, F., López-Pérez, J. A., Gallego, J. D., et al. 2021, A&A, 645, A37 [EDP Sciences] [Google Scholar]
- Vastel, C., Quénard, D., Le Gal, R., et al. 2018, MNRAS, 4778, 5514 [CrossRef] [Google Scholar]
- Vidal, T. H. G., Loison, J.-C., Jaziri, A. Y., et al. 2017, MNRAS, 469, 435 [Google Scholar]
- Wierzejewska, M., & Moc, J. 2003, J. Chem. Phys. A, 107, 11209 [NASA ADS] [CrossRef] [Google Scholar]
- Winnewisser, M., & Winnewisser, B. P. 1971, Z. Naturfosch, 26a, 128 [NASA ADS] [CrossRef] [Google Scholar]
- Woon, D. E., & Herbst, E. 2009, ApJS, 185, 273 [Google Scholar]
Appendix A: Line parameters
Line parameters for all observed transitions with the Yebes 40m and IRAM 30m radio telescopes were derived by fitting a Gaussian line profile to them using the GILDAS package. A velocity range of ±20 km s−1 around each feature was considered for the fit after a polynomial baseline was removed. Negative features produced in the folding of the frequency switching data were blanked before baseline removal.
The derived line parameters for all observed lines of the CHNS and CHNO families are given in Tables A.1 and A.2, respectively. The differences between the measured frequencies and the predicted ones are always of a few kHz. However, for some isotopologues, several hyperfine components are blended in the laboratory data (measurements with uncertainties ≥30 kHz), while in our observations the lines are well resolved and have an uncertainty of 10 kHz.
Observed line parameters for the isomers and isotopologues of HNCS.
Observed line parameters for the isomers and isotopologues of HNCO.
The lines of HCNS, HNCS, HSCN, and NCS are shown in Figs. 1 and A.2. The observations of the J = 6 − 5 line of HCNS with the IRAM 30 m and the Yebes 40 m radio telescopes, together with the resulting merged data, are shown in Fig. A.1. Finally, the lines of the isotopologues H34SCN and DSCN are shown in Fig. A.3. The lines of HNCO, HCNO, HOCN, and NCO are shown in Fig. A.4 and those of H2NCO+ in Fig. A.6
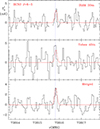 |
Fig. A.1. Observed J = 6 − 5 line of HCNS with the IRAM 30m (top panel) and Yebes 40m (middle panel) radio telescopes. The data of the Yebes telescope have been scaled to those of IRAM using the line N = 8 − 7 J = 15/2 − 13/2 of CCC13CH at 73819.18 MHz that appears in both sets of data with a S/N of ∼10 in the IRAM data and of ∼5 in the Yebes data. The merged spectrum was obtained by averaging both sets of data weighted as 1/σ2 and has a sensitivity of 1 mK. The derived line parameters for this transition of HCNS are given in Table A.1. The red line corresponds to the computed synthetic spectra (see Sect. 3). The vertical blue line corresponds to the measured frequency for a vLSR of 5.83 km s−1. |
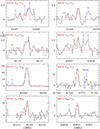 |
Fig. A.2. Observed lines of HSCN and HNCS. The two upper rows show the observed lines of HSCN with Ka = 1. The two lower rows show the 707 − 606 and 808 − 707 lines of HSCN (third row) and HNCS (fourth row) observed at 3 mm with the IRAM 30 m radio telescope. The red line shows the computed synthetic spectra for these lines (see Sect. 3). The derived line parameters are given in Table A.1. |
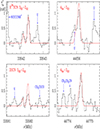 |
Fig. A.3. Observed 303 − 202 and 404 − 303 transitions of the isotopologues H34SCN (top panels) and DSCN (bottom panels) of HSCN. The red line shows the computed synthetic spectra for these lines (see Sect. 3). The derived line parameters are given in Table A.1. |
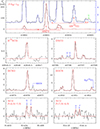 |
Fig. A.4. Same as Fig. 1 but for the J = 202 − 101 transition of HNCO (isocyanic acid) and its isotopologues HN13CO, H15NCO, and DCNO (upper and second raw panels). The upper panel also shows a zoom to the data to exhibit the hyperfine lines of HN13CO. The scale of the zoom is indicated in blue on the right-Y axis. The third row shows the J = 2 − 1 line of HCNO (the J = 4 − 3 is shown in Fig. A.2) and the J = 202 − 101 line of HOCN (cyanic acid). Finally, the bottom panels show two hyperfine components of the J = 7/2 − 5/2 line of NCO in its 2Π3/2 ground state. The lambda-type doubling components, e and f, are indicated. The derived line parameters are given in Table A.2. The hyperfine structure was considered in the modelling of the lines (shown by the red lines). |
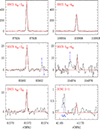 |
Fig. A.5. Observed lines of HNCO and HOCN at 3 mm with the IRAM 30 m radio telescope. The red line shows the synthetic spectra computed with the models described in Sect. 3. The column densities are the same as those derived from the lines observed in the Q-band. The bottom panels show the DNCO 404 − 303 and DCNO J = 2 − 1 lines. The derived line parameters are given in Table A.2. |
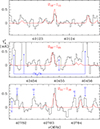 |
Fig. A.6. Observed Ju = 2 lines of H2NCO+ towards TMC-1. The red line shows the computed synthetic spectra for these lines (see Sect. 3). The derived line parameters are given in Table A.2. |
All Tables
All Figures
 |
Fig. 1. Observed Ju = 3 and 4 (Ka = 0) transitions of the isomers of HCNS. The bottom panel shows the hyperfine components of the J = 5/2 − 3/2 transition of NCS in its 2Π3/2 ground state. The abscissa corresponds to the rest frequency. The ordinate is the antenna temperature corrected for atmospheric and telescope losses, in mK. Blanked channels correspond to negative features produced when folding the frequency-switched data. The red line shows the computed synthetic spectra for these lines (see Sect. 3). The derived line parameters are given in Table A.1. |
| In the text | |
 |
Fig. 2. Abundances calculated with the chemical model for molecules of the families of HNCO and HNCS. The peak calculated abundance of HCNS is around 10−15 relative to H2 and therefore lies outside the abundance range shown. Horizontal dashed lines correspond to the abundances observed in TMC-1. |
| In the text | |
 |
Fig. A.1. Observed J = 6 − 5 line of HCNS with the IRAM 30m (top panel) and Yebes 40m (middle panel) radio telescopes. The data of the Yebes telescope have been scaled to those of IRAM using the line N = 8 − 7 J = 15/2 − 13/2 of CCC13CH at 73819.18 MHz that appears in both sets of data with a S/N of ∼10 in the IRAM data and of ∼5 in the Yebes data. The merged spectrum was obtained by averaging both sets of data weighted as 1/σ2 and has a sensitivity of 1 mK. The derived line parameters for this transition of HCNS are given in Table A.1. The red line corresponds to the computed synthetic spectra (see Sect. 3). The vertical blue line corresponds to the measured frequency for a vLSR of 5.83 km s−1. |
| In the text | |
 |
Fig. A.2. Observed lines of HSCN and HNCS. The two upper rows show the observed lines of HSCN with Ka = 1. The two lower rows show the 707 − 606 and 808 − 707 lines of HSCN (third row) and HNCS (fourth row) observed at 3 mm with the IRAM 30 m radio telescope. The red line shows the computed synthetic spectra for these lines (see Sect. 3). The derived line parameters are given in Table A.1. |
| In the text | |
 |
Fig. A.3. Observed 303 − 202 and 404 − 303 transitions of the isotopologues H34SCN (top panels) and DSCN (bottom panels) of HSCN. The red line shows the computed synthetic spectra for these lines (see Sect. 3). The derived line parameters are given in Table A.1. |
| In the text | |
 |
Fig. A.4. Same as Fig. 1 but for the J = 202 − 101 transition of HNCO (isocyanic acid) and its isotopologues HN13CO, H15NCO, and DCNO (upper and second raw panels). The upper panel also shows a zoom to the data to exhibit the hyperfine lines of HN13CO. The scale of the zoom is indicated in blue on the right-Y axis. The third row shows the J = 2 − 1 line of HCNO (the J = 4 − 3 is shown in Fig. A.2) and the J = 202 − 101 line of HOCN (cyanic acid). Finally, the bottom panels show two hyperfine components of the J = 7/2 − 5/2 line of NCO in its 2Π3/2 ground state. The lambda-type doubling components, e and f, are indicated. The derived line parameters are given in Table A.2. The hyperfine structure was considered in the modelling of the lines (shown by the red lines). |
| In the text | |
 |
Fig. A.5. Observed lines of HNCO and HOCN at 3 mm with the IRAM 30 m radio telescope. The red line shows the synthetic spectra computed with the models described in Sect. 3. The column densities are the same as those derived from the lines observed in the Q-band. The bottom panels show the DNCO 404 − 303 and DCNO J = 2 − 1 lines. The derived line parameters are given in Table A.2. |
| In the text | |
 |
Fig. A.6. Observed Ju = 2 lines of H2NCO+ towards TMC-1. The red line shows the computed synthetic spectra for these lines (see Sect. 3). The derived line parameters are given in Table A.2. |
| In the text | |
Current usage metrics show cumulative count of Article Views (full-text article views including HTML views, PDF and ePub downloads, according to the available data) and Abstracts Views on Vision4Press platform.
Data correspond to usage on the plateform after 2015. The current usage metrics is available 48-96 hours after online publication and is updated daily on week days.
Initial download of the metrics may take a while.


