| Issue |
A&A
Volume 682, February 2024
|
|
|---|---|---|
| Article Number | A19 | |
| Number of page(s) | 13 | |
| Section | Astrophysical processes | |
| DOI | https://doi.org/10.1051/0004-6361/202347955 | |
| Published online | 26 January 2024 | |
The omnipresent flux-dependent optical dips of the black hole transient Swift J1357.2−0933
1
Instituto de Astrofísica de Canarias (IAC), Vía Láctea, La Laguna, 38205 Santa Cruz de Tenerife, Spain
e-mail: guayente.panizo@gmail.com
2
Departamento de Astrofísica, Universidad de La Laguna, 38206 Santa Cruz de Tenerife, Spain
3
School of Physics and Astronomy, Monash University, Clayton, Victoria 3800, Australia
4
Center for Astrophysics and Space Science (CASS), New York University Abu Dhabi, PO Box 129188, Abu Dhabi, UAE
5
New York University Abu Dhabi, PO Box 129188, Abu Dhabi, UAE
6
INAF, Osservatorio Astronomico di Brera, Via E. Bianchi 46, 23807 Merate, (LC), Italy
7
Anton Pannekoek Institute for Astronomy, University of Amsterdam, Science Park 904, 1098 XH Amsterdam, The Netherlands
8
European Southern Observatory, Alonso de Córdova 3107, Vitacura, Casilla, 19001 Santiago de Chile, Chile
9
Faulkes Telescope Project, School of Physics and Astronomy, Cardiff University, The Parade, Cardiff, CF24 3AA Wales, UK
10
Astrophysics Research Institute, Liverpool John Moores University, 146 Brownlow Hill, Liverpool L3 5RF, UK
Received:
13
September
2023
Accepted:
3
November
2023
Swift J1357.2-0933 is a black hole transient that is of particular interest due to the optical recurrent dips found during its first two outbursts (in 2011 and 2017), which lack an obvious X-ray equivalent. We present a study based on fast optical photometry during its two most recent outbursts, in 2019 and 2021. Our observations reveal that the optical dips were present in every observed outburst of the source, although they were shallower and showed longer recurrence periods in the two most recent and fainter events. We performed a global study of the dips properties in the four outbursts and found that they do not follow a common temporal evolution. In addition, we discovered a correlation with the X-ray and optical fluxes, with the dips being more profound and showing shorter recurrence periods for brighter stages. This trend seems to extend even to the faintest, quiescent states of the source. We discuss these results in the context of the possible connection between optical dips and outflows found in previous works.
Key words: stars: black holes / accretion / accretion disks / stars: individual: Swift J1357.2−0933 / binaries: close / X-rays: binaries
© The Authors 2024
 Open Access article, published by EDP Sciences, under the terms of the Creative Commons Attribution License (https://creativecommons.org/licenses/by/4.0), which permits unrestricted use, distribution, and reproduction in any medium, provided the original work is properly cited.
This article is published in open access under the Subscribe to Open model. Subscribe to A&A to support open access publication.
1. Introduction
Low-mass X-ray binaries (LMXBs) are stellar systems comprised of either a black hole (BH) or a neutron star and a ≲1 M⊙ mass donor (e.g. Casares et al. 2017; Bahramian & Degenaar 2023). The companion star transfers gas via Roche-lobe overflow, originating an accretion disc where matter can reach temperatures that are high enough (∼107 K) to emit in X-rays. Most of these systems, known as X-ray transients, spend the majority of their lives in a quiescent, dim state, displaying only occasional episodes of enhanced accretion. During these outbursts, which usually last from a few weeks to months, their X-ray luminosities can increase from ∼1031 − 34 erg s−1 to ∼1036 − 39 erg s−1 and a complex phenomenology of different accretion states and associated outflows is typically observed (e.g. Wijnands et al. 2006; Belloni et al. 2011; Fender & Muñoz-Darias 2016).
Swift J1357.2−0933 (J1357 hereafter) is a LMXB discovered during an outburst in 2011 (Krimm et al. 2011; Rau et al. 2011; Armas Padilla et al. 2013). It is thought to contain a relatively massive BH (12.4 ± 3.6 M⊙, Casares 2016) in a 2.6 ± 0.9 h orbit, one of the shortest periods reported for a BH LMXB (Mata Sánchez et al. 2015; Corral-Santana et al. 2016; see also Armas Padilla et al. 2023). Its distance is estimated to be 2.3–6.3 kpc (Mata Sánchez et al. 2015; Shahbaz et al. 2013; but see also Charles et al. 2019a), which implies a peak outburst luminosity of Lx ∼ 1035 − 36 erg s−1 (Armas Padilla et al. 2013). This would make J1357 a candidate for very faint X-ray binary transient, a group of LMXBs reaching peak luminosities of < 1036 erg s−1 (Wijnands et al. 2006).
During its discovery outburst, profound dips (∼0.8 mag, 50% flux) were observed in optical wavelengths, with increasing recurrence times of ∼2 to ∼8 min as the outburst evolved (Corral-Santana et al. 2013, hereafter CS13). These dips were suggested to be caused by vertically extended irregularities within the (outer) accretion disc, producing obscurations of the inner parts if the system is seen at high inclination (i =  deg, Casares et al. 2022). If that were the case, an outwards migration of the irregularities as the outburst declined may explain the increasing dip recurrence period (DRP) with time, assuming they are locked at the Keplerian frequency of a particular disc annulus (CS13).
Analogous ∼0.5 mag recurrent dips were reported during the similarly bright 2017 outburst (Drake et al. 2017; Paice et al. 2019, Jiménez-Ibarra et al. 2019b, hereafter JI19b). The DRP showed a temporal evolution remarkably similar to that of the discovery outburst, increasing from ∼2 to ∼5 min as the event progressed. In this occasion, a possible connection between the dips and the presence of outflows was found based on the observation of deep and broad blue-shifted absorption components in the Balmer and helium lines, concurrent with the dips (Charles et al. 2019a; JI19b). Despite the high inclination of the system, no X-ray dips have been observed. Quasi-periodic oscillations at frequencies similar to those of the optical DRPs have been reported (Armas Padilla et al. 2014a; Beri et al. 2023). However, it has not been conclusively determined whether they are produced by the same physical phenomena.
J1357 also showed renewed outburst activity in 2019 and 2021 (van Velzen et al. 2019; Bellm 2021), although at significantly lower luminosities (I ∼ 16.6–16.8, compared to peak magnitudes of I ∼ 16.2–16.1 in the first two events, Caruso et al. 2021). To date, there are no studies of the optical dips during the 2021 outburst, while preliminary results were only briefly reported for the 2019 event dips (∼0.4 mag and DRP ∼ 11 min, Jiménez-Ibarra et al. 2019a).
In this paper, we present time-resolved photometry of J1357 during its two most recent outbursts, 2019 and 2021, with particular emphasis on the search and characterization of optical dips. We also perform a comprehensive analysis of the dips and their observational properties over the four outbursts. We complement this work with a global X-ray study, including the first analysis of the 2021 data set.
2. Observations and data reduction
2.1. Optical photometry
We performed high-time resolution photometric observations of J1357 using the Rapid Imager for Surveys of Exoplanets (RISE, Steele et al. 2008) at the Liverpool Telescope (LT, Steele et al. 2004) in the Observatorio del Roque de los Muchachos. Table 1 presents our two data sets: five epochs in 2019 (between May 26 and June 10), using a 720 nm longpass filter (∼I + Z); and seven in 2021 (between April 19 and June 27), using the OG515 and KG3 filters (∼V + R). Several hundred exposures of 5–15 s were obtained during each epoch (see Table 1). The basic data reduction (bias subtraction, trimming overscan regions, and flat fielding) was performed using the automatic LT reduction pipeline1.
2019 and 2021 LT observing log.
To perform the global analysis, we also use the DRPs and magnitude results for the 2017 outburst, presented in JI19b. As this data set was obtained with the same telescope and instrument than ours (OG515 and KG3 filters), we re-analysed the reduced data set to obtain the DRP uncertainties, which were not reported in the original paper. We also use the published DRP and magnitude results of the 2011 outburst obtained by CS13 with other facilities.
2.2. X-ray spectra
We analysed the observations obtained during the 2021 outburst with the X-Ray Telescope (XRT, Burrows et al. 2005) onboard the Neil Gehrels Swift Observatory (Swift, Gehrels et al. 2004). Out of the 27 available observations, we used the 21 with a source detection. All of them were obtained in photon counting (PC) mode from MJDs 59319 to 59390 (0.6–1.6 ks each, see Table A.1).
The spectra were reduced using the HEASOFT v. 6.29 package with the XRTPIPELINE (v. 0.13.6). Following the criteria of Armas Padilla et al. (2013), the source spectra and light curves were extracted with XSELECT (v. 2.4), using a circular region of 23.6 arcsec (10 pixels), while the background was extracted from three nearby circular regions of the same size. The response matrix files (RMFs) were obtained from the HEASARC database, while the exposure maps and ancillary response files (ARFs) were created using Swift standard analysis threads2. Finally, we used grppha to group the spectra to a minimum of 5 photons per bin due to the low number of counts during this outburst. We note that the χ2 minimisation technique has still been found to be valid with so few photons (e.g. Wijnands & Wang 2002; Armas Padilla et al. 2013; Wijnands & Degenaar 2013). Our results using χ2 statistics are consistent with those obtained using C-statistics.
In addition, we make use of the Swift/XRT 0.5–10 keV X-ray fluxes already published for the 2011, 2017, and 2019 outbursts (Armas Padilla et al. 2013; Beri et al. 2019, 2023). We also use some published Neutron star Interior Composition Explore (NICER, Gendreau et al. 2012) X-ray fluxes from the 2019 outburst (Beri et al. 2023).
3. Analysis and results
Figure 1 presents the long-term I-band light curve of J1357 from Las Cumbres Observatory (LCO, Caruso et al., in prep.; see also Russell et al. 2018; Pirbhoy et al. 2019; Goodwin et al. 2020 for details). These observations are part of an on-going monitoring campaign of ∼50 LMXBs coordinated by the Faulkes Telescope Project (Lewis et al. 2008). The data set reveals that the most recent outbursts (2019 and 2021) were fainter and shorter than in 2011 and 2017. Our photometric observations and X-ray light curves, presented in Fig. 2, confirm this difference. The optical light curves (right panel) were obtained in I-band except for 2011 (R-band, Russell et al. 2018). For visual purposes, we re-scaled them by factors of 0.85, 0.65 and 0.81 for 2017, 2019, and 2021, respectively. The X-ray light curves (left panel in Fig. 2) were obtained with Swift (Armas Padilla et al. 2013; Beri et al. 2019, 2023; this work), except for the three first data points of the 2019 X-ray light curve, which were obtained with NICER (Beri et al. 2023).
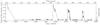 |
Fig. 1. Long-term I-band flux density light curve of J1357 (Caruso et al., in prep.), obtained with Las Cumbres Observatory. The 2011, 2017, 2019, and 2021 outbursts are clearly distinguished. |
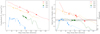 |
Fig. 2. X-ray (Swift and NICER, left panel) and optical (LCO, right panel) light curves of the four outbursts (solid lines). In both panels, the photometric epochs used in this work are indicated by symbols (crosses, dots, triangles and stars for 2011, 2017, 2019, and 2021 outbursts, respectively), with smaller markers for epochs with no significant DRPs (#1 and #7 in 2021, see Sect. 3.3). The dates of first detections are given in Table 2. The grey band indicates an optical magnitude interval (17.1–17.3) with peculiar DRP evolution (see Fig. 8, and Sect. 4.2.1). |
3.1. X-ray light curve analysis
We fit the X-ray spectra using XSPEC (v.12.0), assuming a constant column density of NH = 1.2 × 1020 cm−2 (Armas Padilla et al. 2014b; Krimm et al. 2011). All 2021 observations were fitted with a simple power law (powerlaw) affected by photoelectric absorption (phabs). In observations with not enough counts to perform spectral fits, we computed the 95% confidence upper limits on the flux following Gehrels (1986) and using WebPIMMS (Mukai 1993). In those cases, we fix the photon index (Γ) to that obtained in the closest observation with a valid fit, and compute the X-ray fluxes in the 0.5–10 keV band (see Table A.1).
3.2. Optical light curve analysis
Our optical data sets were obtained during a brief period of the 2019 outburst (∼15 days), while covering most of the 2021 episode (∼68 days from the rising phase to the end of the event, plus a later epoch following a short rebrightening, Baglio et al. 2021).
We carried out aperture photometry using the HIPERCAM pipeline (Dhillon et al. 2018). We performed the flux calibration against nearby stars from the PanSTARRS DR2 catalogue (Chambers et al. 2016) in the most similar filters (i and r for 2019 and 2021, respectively), following the criteria of JI19b.
We used these high cadence observations to construct detailed light curves of each epoch and found a ∼0.5 mag variability level and a standard deviation of ∼0.05 mag during both outbursts. A visual, qualitative inspection revealed dips in both events, producing drops of ∼0.2–0.3 mag during ∼2–3 min. Some examples are shown in Figs. 3 and 4, while the complete light curves of each epoch are presented in the left panels of Figs. 5 and 6.
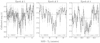 |
Fig. 3. Detail of three optical dips observed during the 2019 outburst. The horizontal dashed line indicates the mean magnitude of each epoch. The starting MJD and mean i-mag of each epoch are indicated in lower left and right boxes, respectively. |
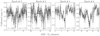 |
Fig. 4. Detail of four optical dips observed during the 2021 outburst. The horizontal dashed line indicates the mean magnitude of each epoch. The starting MJD and mean r-mag of each epoch are indicated in lower left and right boxes, respectively. |
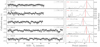 |
Fig. 5. Optical light curves (left) and periodograms (right) for the 2019 outburst, from top (epoch #1) to bottom (#5). Light curves averaged into 20 s bins are superimposed for clarity (black). The starting MJD and mean magnitude of each epoch are shown in upper left and right boxes, respectively. The 0.2 FAP (80% significance) and the highest significant peak are indicated in the periodograms with a horizontal, dashed line and a vertical red line, respectively. |
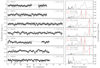 |
Fig. 6. Optical light curves (left) and periodograms (right) for the 2021 outburst, using the same colour and line codes than Fig. 5, from top (#1) to bottom (#7). We note that epochs #1 and #7 do not show significant peaks in the LSPs. When the favoured DRP does not correspond to the peak with the highest power (see Sect. 3.3.1), the last one is indicated with a vertical dashed line (#2, #5 and #6). Epoch #7 is not averaged into 20 s bins, as the exposure time was 15 s. |
3.3. Periodogram analysis
The right panels of Figs. 5 and 6 show the Lomb-Scargle Periodograms (LSP) for the 2019 and 2021 data sets, respectively. We used the LOMB-SCARGLE PYTHON class (VanderPlas 2018) as described in JI19b. Both data sets were detrended before the analysis using a linear fit to avoid low–frequency components. We consider only frequencies between 1.5 and 15 min in order to reduce contamination effects from the observational window (5–15 s exposures for 70–90 min). As the main periodic features of this source were associated to optical dips in previous outbursts (CS13; JI19b), we assume that periodicities in our LSPs would also be produced by similar optical dips (see Figs. 3 and 4), that is, the peaks of our LSPs are tracking the DRP.
We estimated the DRP uncertainty as the sigma of a Gaussian fit to the peak in the LSP (VanderPlas 2018). However, this estimation is based on the assumption that the chosen peak is the correct one, which could introduce additional errors in some cases. In order to study the validity of detected peaks, we estimated their significance by calculating the false alarm probability (FAP) at a given level of significance. The FAP of a peak is the probability that a data set with no periodic signal produces a peak with similar intensity (VanderPlas 2018). Thus, given a chosen FAP, we can compute the required peak height to reach such value and use it as a significance limit for our periodogram: peaks higher than the limit would be true with 1-FAP confidence. We computed FAPs of 0.2 (80% confidence) by the bootstrap method3. Despite being arguably the most robust method for FAP estimations, it can be computationally expensive. We tried 100, 1000, and 10 000 resamplings and found 1000 to be a good compromise. Although we present the results of this analysis for every epoch (Figs. 5 and 6), we will only discuss those with significant peaks, which excludes two epochs of the 2021 data set (#1 and #7). Adopting a more strict FAP threshold of 90% would exclude one additional epoch (#3 in 2021, see Sect. 3.3.1). However, as visual inspection reveals clear dips in this epoch (see Fig. 4), we decided to keep the 80% threshold.
We also re-analysed the 2017 data set presented in JI19b to estimate the DRPs uncertainties (see Appendix B for details). Our DRPs are in agreement with those reported by JI19b in every epoch, and all of them are significant according to our 0.2 FAP criteria. We note that a FAP threshold of 90% would exclude epochs #1 and #6.
3.3.1. DRP evolution
All the epochs in the 2019 data set show significant frequency peaks in the LSP (Fig. 5): 11.2 ± 1.0 min, 10.5 ± 1.1 min, 9.3 ± 0.7 min, 11.1 ± 0.6 min, and 12.6 ± 0.9 min in epochs #1 to #5, respectively. Our analysis does not reveal a clear DRP trend with time in this data set, which was obtained in a very short window (15 days) compared to that of previous studies (70 and 60 days during the 2011 and 2017 outbursts, respectively; see Fig. 2).
Our 2021 data set, on the other hand, was obtained over a much more extended timeframe, comparable to that of the first two outbursts. Moreover, our earliest observation was performed during the rising phase of the outburst (10 days after the initial detection) and, hence, comparatively earlier than in 2011 and 2017 (54 and 25 days after their first X-ray detections, respectively; Krimm et al. 2011; Drake et al. 2017). Five of the seven 2021 epochs show significant frequency peaks in the LSPs (all but epochs #1 and #74, see Fig. 6). Two of them, epochs #3 and #4, show clear maximum peaks at 13 min. These strong LSP peaks can be confidently associated with DRPs due to the long coverage available for these epochs (∼85 min). However, the other three (#2, #5, and #6) show pairs of significant, close peaks of similar power: 8.6 ± 0.4 min and 11.1 ± 1.1 min in epoch #2, 8.6 ± 0.3 min and 10.4 ± 0.5 min in #5 and 10.0 ± 0.6 min, and 13.1 ± 1.4 min in #6. As their shorter coverage (≤65 min) could bias our method towards lower DRPs, we discuss both peaks, but favouring frequencies closer to those found in the epochs with longer coverages (#3, #4) instead of simply choosing the peaks with the highest power. We note that a similar discussion is not necessary in 2017 and 2019 data sets, as other significant peaks show considerably less power or can be interpreted as aliases of the peak with highest power (see epochs #2–5 and #7 in 2017 and #1 and #5 in 2019; Figs. B.1 and 5, respectively).
Given that some of the observed optical dips are considerably less prominent that those of the 2011 and 2017 outbursts, we performed an additional test of their reliability. We studied the light curves of a field star of similar brightness and performed the same LSP analysis. We found no similar optical dips in the light curves, nor significant recurrent periods in the periodograms according to our FAP criteria.
Overall, the 2019 and 2021 DRPs are considerably longer than those of the 2011 and 2017 outbursts (CS13; JI19b). Furthermore, they do not show the clear and unique increasing trend with time observed in the first two outbursts (see Sect. 4.1 and Fig. 7).
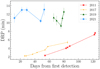 |
Fig. 7. DRP evolution with time during the four outbursts of J1357. Colours and symbols are the same than in Fig. 2. |
3.3.2. DRP dependence with flux
To explore a possible dependence between the DRP and X-ray and optical fluxes, we plotted both variables for every outburst in Fig. 8. The DRP-Fx plot (left panel of Fig. 8) suggests two main results: (i) the DRPs are longer for fainter outbursts and (ii) in general, they seem to increase as the outburst decays and the flux drops. Therefore, a DRP-flux dependence seems probable. We performed a Pearson correlation to test this possible linear correlation and found a −0.86 coefficient, which supports its existence (p-value 2 × 10⁻⁸).
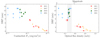 |
Fig. 8. DRP evolution with X-ray (left) and optical (right) fluxes for the four outbursts of J1357. The X-ray flux for each DRP was interpolated between those of the closest X-ray observations (0–3 days). The 2017, 2019 and 2021 LT data sets only include epochs with significant peaks in the LSPs (see Figs. 5, 6 and B.1). Open markers (epochs #2, #5 and #6 of 2021) indicate the DRPs corresponding to the LSP peaks with the highest power (Sect. 3.3.1). The grey band indicates an optical magnitude interval (17.1–17.3) with a peculiar DRP evolution (also marked in Fig. 2, see Sect. 4.2.1). |
It is relevant to note the case of epochs #2, #5, and #6 in the 2021 data set, where the peaks with the highest LSP power (open stars in Fig. 8) point to lower DRPs than the overall trend might suggest. As discussed above (Sect. 3.3.1), for these epochs we favour the significant peaks found at longer DRPs and slightly less LSP power (coloured stars), which produce a significantly less scattered (i.e. better defined) correlation at low fluxes. In any case, the scatter of the correlation increases as we move to lower fluxes and longer DRPs. This is expected as the signal-to-noise becomes lower, the dips shallower and the DRPs approach values closer to our observing window (∼15 min DRPs for 60 min windows). A Pearson correlation test using the peaks of highest power for those epochs (#2, #5 and #6) results in a coefficient of −0.82 (p-value 9 × 10⁻⁷).
This general correlation of DRPs increasing as flux decreases seems to hold also when we use optical instead of X-ray fluxes (right panel of Fig. 8), with a Pearson coefficient of −0.89 with p-value 1 × 10⁻⁸ (−0.88 when using the values corresponding to open markers for epochs #2, #5 and #6, with p-value 1 × 10⁻⁷). However, we note that the scatter is particularly noticeable within a narrow flux band (17.1–17.3 mag, grey region in Fig. 8). This band coincides with the optical peaks of the 2019 and 2021 outbursts, while the rest of the points of the correlation occur during the final decay (see Fig. 2).
Finally, we stress that the correlation would hold even if we chose a FAP threshold of 90% (see Sect. 3.3).
4. Discussion
Since its discovery, J1357 has gone into an outburst four times in ten years. The first two, in 2011 and 2017, were first noticed in X-rays and showed very similar luminosity peaks, temporal evolution, and optical dips. The following outbursts, in 2019 and 2021, were discovered at earlier stages by optical facilities. Thus, earlier observations and better coverage of their optical peaks were possible. Our analysis reveals optical, recurrent dips during these two fainter and shorter outbursts, demonstrating that they have been present in every observed outburst of the source. Thus, regardless of the luminosity and duration of the outburst, these optical, recurrent dips are most likely characteristic of this system. Table 2 summarises the properties of the dips, which are shallower and show longer DRPs in fainter outbursts despite showing a similar duration (∼2 min).
Dip properties as a function of the J1357 outburst.
4.1. The DRP evolution with time
Previous studies pointed to the existence of a common increasing DRP trend with time in every outburst of the source (CS13; JI19b; Jiménez-Ibarra et al. 2019a; Paice et al. 2019). As shown in Fig. 7, this hypothesis was based on the remarkably similar DRP evolution during the decay of the 2011 and 2017 outbursts (red crosses and orange dots). However, this trend (i.e. steady increase of the DRP with time as the outburst evolves) was not observed in the 2019 and 2021 events (green triangles and blue stars). This is most likely due to the fact that the 2011 and 2017 monitoring covered the decay of the system during two very similar outbursts. The coverage of the 2019 and 2021 events was different, including the final part of the rise (2021) and the outburst peak. Also, the luminosity range that these events sample is rather different. In summary, the results presented in this work show that new variables need to be considered to characterise the evolution of the DRP across the outbursts of J1357.
4.2. A global correlation between the DRP and the observed X-ray flux
Our results reveal that bright outbursts (Fx, unabs ∼10−11–10−10 erg cm−2 s−1) show clear dips with short DRPs (∼2–8 min), while fainter ones (Fx, unabs ∼10−12–10−11 erg cm−2 s−1) produce dips with shallower depths and higher DRPs (∼9–13 min). Furthermore, as the X-ray flux changes through each event, the DRPs also change, increasing (in general) with fainter flux. We note that an independent optical data set obtained during the 2017 outburst (Paice et al. 2019) reported very similar DRPs that also lie in this general trend. In Fig. 9 (left panel), we include all the published DRP values of the source (see also Sect. 4.2.2). In summary, as shown in Fig. 8, an overall correlation of the DRP with the X-ray flux is observed, with more prominent and frequent optical dips seen at brighter stages.
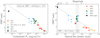 |
Fig. 9. Same figure as Fig. 8, now including data from 2012 quiescence (black square) and an independent data set from the 2017 outburst (Paice et al. 2019, small black dots in the left panel). In the DRP-Fx plot (left panel) the quiescent Fx value was obtained with XMM-Newton 422 days after the DRP measurement (Armas Padilla et al. 2014b), which could affect its position on the diagram. The coefficients of a linear fit to all the data sets (excluding 2021 open markers) are shown in a text box. |
As previously explained, the scatter of this correlation increases as the X-ray flux decreases and the DRP rises (see Sect. 3.3.2). Thus, while the optical dips were easily detected in the first two outbursts, the fainter events on 2019 and 2021 would have benefited from longer coverage to reduce the uncertainties in the DRP measurement. This might be taken into account in future observations.
4.2.1. DRP evolution with the optical flux
A similar DRP trend is observed with the optical flux (right panel of Fig. 8), reinforcing the hypothesis of a correlation between both variables. However, in this case the scatter seems to be even higher in a narrow band of optical flux during the 2019 and 2021 outbursts. This might be related to the fact that those data points were obtained during a plateau of the optical light curve (grey bands in Figs. 2, 8 and 9), while the DRPs show less scatter again during the decaying phase of the 2021 outburst. It is worth noticing that although this band also contains the two last 2011 epochs, they correspond to the outburst decay and do not seem to deviate from the regular trend.
Such region of increased scatter (i.e. grey band in Figs. 2 and 8) is not evident in the DRP-Fx plot (left panel of Fig. 8). Assuming that the DRP-Fx is the primary correlation, this additional scatter might be due to the change of the slope of the optical–X-ray flux correlation at different outburst stages observed in other systems (e.g. López-Navas et al. 2020). This was not observed in the optical databases of the 2011 and 2017 outbursts, obtained during outburst decays. However, we note that Paice et al. (2019) reported a 2017 epoch with higher DRP than expected from the general DRP-time trend found for the 2011 and 2017 data sets (CS13, JI19b). This epoch was observed only one week after detecting the outburst (i.e. 20 days before our first epoch and possibly during the outburst peak, see Fig. 9). In light of our results, this epoch might be affected by the same issue than those of the 2019 and 2021 events during the optical plateau at the outburst peaks.
4.2.2. Dips in quiescence
Optical dips with a possible recurrence time around ∼30 min were reported in 2012, when the system was back in quiescence eight months after the discovery outburst (Shahbaz et al. 2013). The presence of optical dips during these dim stages (r′ ∼ 22) allows us to explore a new, different region in the DRP-flux plot. We analysed the available data (see details in Appendix C) and obtained a DRP of 21.5 ± 0.5 min in r′ and g′ bands, which is considerably longer than those found in outburst (see Table 2). In Fig. 9, we show how this longer recurrence time might be consistent with the main, overall correlation seen in outburst, suggesting a common physical origin for both the quiescent and outburst dips (Pearson coefficients of −0.82 and −0.92 for the DRP correlation with X-ray and optical fluxes, respectively). In this plot, we associate the quiescent DRP with the quiescent XMM-Newton X-ray flux reported in Armas Padilla et al. (2014b). We further discuss this in Sect. 4.3.
A linear fit to all the available data sets (including quiescence) was performed for the DRP correlation with X-ray and optical fluxes (see Fig. 9). This linear fit might be useful for future observations of J1357, providing a general idea of the expected range of DRPs at a given flux.
4.2.3. Further considerations on DRP-flux dependence
Our results must be seen with caution, as our method and data sets have some caveats. First, the photometric filters of the LT do not have a direct correspondence with the PanSTARRS filters. Thus, our calibration might be affected by a systematic bias, which would be different in the 2019 data set (720 nm longpass filter) with respect to 2017 and 2021 (OG515 and KG3 filters). We have estimated this bias by comparing the magnitudes obtained for 10 field stars with those reported by PanSTARRS. We find differences < 0.1 mags, with a mean offset of ∼0.002 in the r-like filter (2017 and 2021 data sets) and ∼−0.05 in i-like filter (2019 data set). This would have no effect in the timing, but it might artificially change the scatter of the DRP-flux diagrams. In any case, as this would not affect the DRP-Fx (left panels of Figs. 8 and 9), which show very similar results to DRP-flux plots (right panels of Figs. 8 and 9), such a systematic bias does not seem to significantly affect our conclusions.
Second, although most observations were performed using r/r′/R filters, the 2019 data set was obtained with a filter closer to i/z. Previous works seem to suggest that i-mags might be ∼0.1–0.2 mag brighter than r-mags for this source (Baglio et al. 2021). Thus, when comparing outbursts in Figs. 2, 8 and 9 we must be aware that the 2019 epochs might be slightly displaced with respect to the r-band. This might alter the width of the region of increased scatter (grey band in Figs. 2 and 8). However, even if our data suffer from such offset, it would be small enough to keep our conclusions unaltered. It is also relevant to note the dip-wavelength dependence found by previous studies, with deeper dips at longer wavelengths (Paice et al. 2019, see also JI19b). This might be particularly relevant for dip detection at fainter outbursts (such as those of 2019 and 2021), where we find them to be less prominent (see Table 2). Shallower dips might thus be even harder to detect in observations performed at shorter wavelengths (such as the 2021 r-like data set) in comparison to longer wavelengths (e.g. the 2019 i-like data set). However, we note that the dips are in fact detected even in our 2021 data set, so this effect might not be particularly important in this source.
Other possible caveats are related to the periodogram analysis. Although we were cautious in estimating uncertainties and choosing only peaks over a certain FAP, an incorrect peak choice in the LSPs would easily introduce larger errors and more scatter in the DRP-flux diagrams. This would particularly affect those periodograms with more than one peak over the FAP rate, which is the reason why we decided to include them in Figs. 8 and 9. However, we note that as previously discussed, they do not change our conclusions.
Finally, we note that there is only one quiescent DRP measurement available. Although relevant for our analysis and being consistent with our results, it might not be representative of the system behaviour during the dimmest stages.
4.3. Origin of the optical dips and their connection to outflows
The first studies of J1357’s optical dips suggested that they might be produced by irregularities in the accretion disc. These would be formed in a region that would move outwards as the outbursts evolve to fainter stages (CS13; JI19b). If we assume the same origin for the 2019 and 2021 optical dips, such irregularities might originate at outer locations for fainter events, as we found higher Keplerian frequencies (0.3–0.4 R⊙, assuming a canonical BH of ∼10 M⊙) than those of 2011 and 2017 events (0.12–0.27 R⊙ and 0.16–0.18 R⊙).
Previous studies during the 2017 outburst indicated a possible connection between dips and optical outflows. These claims were based on the discovery of blue-shifted absorptions in high-time resolution optical spectra simultaneous with optical dips. These blue-shifted absorptions were not found in spectra taken outside of the dips (JI19b; Charles et al. 2019a). We note that optical winds are commonly seen in high inclination BH transients (e.g. Muñoz-Darias et al. 2016; Panizo-Espinar et al. 2022) and in some cases a multi-phase, clumpy structure has been proposed (Muñoz-Darias & Ponti 2022; see also Motta et al. 2017). Thus, we can attempt to qualitatively explain our results in the context of optical dips being a direct consequence of outflows seen at high orbital inclination. As a result of the strong irradiation during outbursts, the upper layers of the disc might develop irregularities, which could produce prominent dips (as those observed in 2011 and 2017 in J1357) and clumpy equatorial winds when expelled. On the other hand, fainter outbursts with consequently lower irradiation might yield smaller irregularities at larger radii, resulting in shallower optical dips (as those observed in 2019 and 2021).
If the dips observed in quiescence have the same physical origin as those in outburst, the possible connection between dips and outflows becomes even more puzzling. The irregularities would be located at more external radii (∼0.6 R⊙) than those observed in outburst, but still far from the edge of the disc, which was estimated to be ∼1.7 R⊙ in outburst (CS13). However, we note that accretion discs have been observed to be smaller during quiescence (∼0.5 RL1, Casares et al. 1995; Marsh et al. 1994, which for J1357 results in ∼0.95 R⊙, CS13). During quiescence, the accretion disc is weakly irradiated, which should in principle prevent the formation of outflows via radiation-related mechanisms (e.g. Higginbottom et al. 2020; Charles et al. 2019b). Nonetheless, other wind launching mechanisms might be invoked, such as magnetic driven winds (e.g. Waters & Proga 2018; Tetarenko et al. 2018). In any case, it is worth noting that to date there is no evidence of winds being launched in quiescence. Finally, one can always speculate with the possibility that more than one mechanism contribute to create the optical dips, with different contributions dominating at different luminosities and irradiation levels.
5. Conclusions
We have presented new photometric data of the X-ray binary transient Swift J1357.2−0933 during its most recent outbursts (2019 and 2021), including also the analysis of 2021 Swift/XRT data. Our results reveal that the optical, recurrent dips are a common phenomena in the transient, with a similar duration but different properties over different outbursts. In particular, we discover a general correlation between the dip recurrence period and the X-ray and optical fluxes, with shorter periods seen at brighter states, which might hold to some extent even in quiescence. Further optical observations of this transient during outburst to test these conclusions are encouraged. Additional quiescence data are also needed to confirm the presence of less recurrent dips at the faintest stages of the source.
Finally, it is relevant to note that this transient is singular in many aspects, with one of the highest orbital inclinations for a LMXB and a donor star whose small size would be comparable to that of the outer disc rim (CS13). This might be relevant for many observational features including optical dips visibility. As a matter of fact, they might be a common feature of LMXBs that is not observable at other combinations of inclination, disc thickness, and companion star’s relative size. High-time resolution optical photometry during outbursts of other transients is strongly encouraged to test these possibilities.
Acknowledgments
We are thankful to the anonymous referee for constructive comments that have improved this paper. This work is supported by the Spanish Ministry of Science via an Europa Excelencia grant (EUR2021-122010) and the Plan de Generacion de conocimiento: PID2020-120323GB-I00, PID2020-114822GB-I00 and PID2021-124879NB-I00. DMS acknowledges support from the Spanish Ministry of Science and Innovation via an Europa Excelencia grant (EUR2021-122010). TS acknowledges financial support from the Spanish Ministry of Science, Innovation and Universities under grant PID2020-114822GB-I00. FMV acknowledges support from the grant FJC2020-043334-I financed by MCIN/AEI/10.13039/501100011033 and Next Generation EU/PRTR. This article uses material based upon work supported by Tamkeen under the NYU Abu Dhabi Research Institute grant CASS. MOLLY software developed by Tom Marsh is gratefully acknowledged. We acknowledge the use of public data from the Swift data archive. The Liverpool Telescope is operated on the island of La Palma by Liverpool John Moores University in the Spanish Observatorio del Roque de los Muchachos of the Instituto de Astrofísica de Canarias with financial support from the UK Science and Technology Facilities Council. This work uses data from the Faulkes Telescope Project, which is an education partner of LCO. The Faulkes Telescopes are maintained and operated by LCO.
References
- Armas Padilla, M., Degenaar, N. D., Russell, D. M., & Wijnands, R. 2013, MNRAS, 428, 3083 [NASA ADS] [CrossRef] [Google Scholar]
- Armas Padilla, M., Wijnands, R., Altamirano, D., et al. 2014a, MNRAS, 439, 3908 [NASA ADS] [CrossRef] [Google Scholar]
- Armas Padilla, M., Wijnands, R., Degenaar, N. D., et al. 2014b, MNRAS, 444, 902 [CrossRef] [Google Scholar]
- Armas Padilla, M., Corral-Santana, J. M., Borghese, A., et al. 2023, A&A, 677, A186 [NASA ADS] [CrossRef] [EDP Sciences] [Google Scholar]
- Baglio, M. C., Caruso, E., Russell, D. M., et al. 2021, ATel, 14729, 1 [NASA ADS] [Google Scholar]
- Bahramian, A., & Degenaar, N. 2023, in Handb. X-ray Gamma-ray Astrophys., eds. C. Bambi, & A. Santangelo (Springer Living Reference Work) [Google Scholar]
- Bellm, E. C. 2021, ATel, 14539, 1 [NASA ADS] [Google Scholar]
- Belloni, T. M., Motta, S. E., & Muñoz-Darias, T. 2011, Bull. Astron. Soc. India, 39, 409 [Google Scholar]
- Beri, A., Tetarenko, B. E., Bahramian, A., et al. 2019, MNRAS, 485, 3064 [CrossRef] [Google Scholar]
- Beri, A., Gaur, V., Charles, P., et al. 2023, MNRAS, 522, 4598 [Google Scholar]
- Burrows, D. N., Hill, J. E., Nousek, J. A., et al. 2005, Sp. Sci. Rev., 120, 165 [NASA ADS] [CrossRef] [Google Scholar]
- Caruso, E., Russell, D. M., Baglio, M. C., et al. 2021, ATel, 14623, 1 [NASA ADS] [Google Scholar]
- Casares, J. 2016, ApJ, 822, 99 [NASA ADS] [CrossRef] [Google Scholar]
- Casares, J., Marsh, T. R., Charles, P. A., et al. 1995, MNRAS, 274, 565 [NASA ADS] [CrossRef] [Google Scholar]
- Casares, J., Jonker, P. G., & Israelian, G. 2017, in Handb. Supernovae, eds. A. W. Alsabti, & P. Murdin (Springer International Publishing), 1499 [CrossRef] [Google Scholar]
- Casares, J., Muñoz-Darias, T., Torres, M. A. P., et al. 2022, MNRAS, 516, 2023 [NASA ADS] [CrossRef] [Google Scholar]
- Chambers, K. C., Magnier, E. A., Metcalfe, N., et al. 2016, arXiv eprints [arXiv:1612.05560] [Google Scholar]
- Charles, P., Matthews, J. H., Buckley, D. A. H., et al. 2019a, MNRAS, 489, 47 [Google Scholar]
- Charles, P. A., Buckley, D. A. H., Kotze, E. S. B. P., et al. 2019b, ATel, 12480, 1 [NASA ADS] [Google Scholar]
- Corral-Santana, J. M., Casares, J., Muñoz-Darias, T., et al. 2013, Science, 339, 1048 [NASA ADS] [CrossRef] [Google Scholar]
- Corral-Santana, J. M., Casares, J., Muñoz-Darias, T., et al. 2016, A&A, 587, A61 [NASA ADS] [CrossRef] [EDP Sciences] [Google Scholar]
- Dhillon, V. S., Marsh, T. R., Stevenson, M. J., et al. 2007, MNRAS, 378, 825 [NASA ADS] [CrossRef] [Google Scholar]
- Dhillon, V. S., Dixon, S., Gamble, T., et al. 2018, Proc. SPIE, 10702, 107020L [Google Scholar]
- Drake, A. J., Djorgovski, S. G., Mahabal, A. A., et al. 2017, ATel, 10297, 1 [NASA ADS] [Google Scholar]
- Fender, R. P., & Muñoz-Darias, T. 2016, in Lect. Notes Phys., eds. F. Haardt, V. Gorini, U. Moschella, A. Treves, & M. Colpi (Cham: Springer International Publishing), 905, 65 [NASA ADS] [CrossRef] [Google Scholar]
- Gehrels, N. 1986, ApJ, 303, 336 [Google Scholar]
- Gehrels, N., Chincarini, G., Giommi, P., et al. 2004, ApJ, 611, 777 [Google Scholar]
- Gendreau, K. C., Arzoumanian, Z., & Okajima, T. 2012, Space Telescopes and Instrumentation 2012: Ultraviolet to Gamma Ray, Proc. SPIE, 8443 [Google Scholar]
- Goodwin, A. J., Russell, D. M., Galloway, D. K., et al. 2020, MNRAS, 498, 3429 [NASA ADS] [CrossRef] [Google Scholar]
- Higginbottom, N., Knigge, C., Sim, S. A., et al. 2020, MNRAS, 492, 5271 [Google Scholar]
- Jiménez-Ibarra, F., Muñoz-Darias, T., Casares, J., Armas Padilla, M., & Corral-Santana, J. M. 2019a, ATel, 12867, 1 [Google Scholar]
- Jiménez-Ibarra, F., Muñoz-Darias, T., Casares, J., Armas Padilla, M., & Corral-Santana, J. M. 2019b, MNRAS, 489, 3420 [Google Scholar]
- Jiménez-Ibarra, F., Muñoz-Darias, T., Armas Padilla, M., et al. 2019c, MNRAS, 484, 2078 [CrossRef] [Google Scholar]
- Krimm, H. A., Barthelmy, S. D., Baumgartner, W., et al. 2011, ATel, 3138, 1 [NASA ADS] [Google Scholar]
- Lewis, F., Russell, D. M., Fender, R. P., Roche, P., & Clark, J. S. 2008, in VII Microquasar Work. Microquasars Beyond [Google Scholar]
- López-Navas, E., Degenaar, N. D., Parikh, A. S., Hernández Santisteban, J. V., & van den Eijnden, J. 2020, MNRAS, 493, 940 [CrossRef] [Google Scholar]
- Marsh, T. R., Robinson, E. L., Wood, J. H., et al. 1994, MNRAS, 266, 137 [NASA ADS] [CrossRef] [Google Scholar]
- Mata Sánchez, D., Muñoz-Darias, T., Casares, J., Corral-Santana, J. M., & Shahbaz, T. 2015, MNRAS, 454, 2199 [CrossRef] [Google Scholar]
- Motta, S. E., Kajava, J. J. E., Sánchez-Fernández, C., et al. 2017, MNRAS, 471, 1797 [NASA ADS] [CrossRef] [Google Scholar]
- Mukai, K. 1993, Legacy, 3, 21 [Google Scholar]
- Muñoz-Darias, T., & Ponti, G. 2022, A&A, 664, A104 [NASA ADS] [CrossRef] [EDP Sciences] [Google Scholar]
- Muñoz-Darias, T., Casares, J., Mata Sánchez, D., et al. 2016, Nature, 534, 75 [Google Scholar]
- Paice, J. A., Gandhi, P., Charles, P. A., et al. 2019, MNRAS, 488, 512 [CrossRef] [Google Scholar]
- Panizo-Espinar, G., Armas Padilla, M., Muñoz-Darias, T., et al. 2022, A&A, 664, A100 [NASA ADS] [CrossRef] [EDP Sciences] [Google Scholar]
- Pirbhoy, S. F., Russell, D. M., Baglio, M. C., Lewis, F., & Saikia, P. 2019, ATel, 13120, 1 [NASA ADS] [Google Scholar]
- Rau, A., Greiner, J., & Filgas, R. 2011, ATel, 3140, 1 [NASA ADS] [Google Scholar]
- Russell, D. M., Qasim, A. A., Bernardini, F., et al. 2018, ApJ, 852, 90 [NASA ADS] [CrossRef] [Google Scholar]
- Russell, D. M., Lewis, F., Gandhi, P., et al. 2019, ATel, 12803, 1 [NASA ADS] [Google Scholar]
- Shahbaz, T., Russell, D. M., Zurita, C., et al. 2013, MNRAS, 434, 2696 [NASA ADS] [CrossRef] [Google Scholar]
- Steele, I. A., Smith, R. J., Rees, P. C., et al. 2004, SPIE, 5489, 679 [NASA ADS] [Google Scholar]
- Steele, I. A., Bates, S. D., Gibson, N., et al. 2008, SPIE, 7014, 70146J [NASA ADS] [Google Scholar]
- Tetarenko, B. E., Lasota, J.-P., Heinke, C. O., Dubus, G., & Sivakoff, G. R. 2018, Nat, 554, 69 [NASA ADS] [CrossRef] [Google Scholar]
- Torres, M. A. P., Jonker, P. G., Miller-Jones, J. C. A., et al. 2015, MNRAS, 450, 4292 [NASA ADS] [CrossRef] [Google Scholar]
- van Velzen, S., Bellm, E. C., & van Roestel, J. 2019, ATel, 12796, 1 [NASA ADS] [Google Scholar]
- VanderPlas, J. T. 2018, ApJS, 236, 16 [Google Scholar]
- Waters, T., & Proga, D. 2018, MNRAS, 481, 2628 [NASA ADS] [Google Scholar]
- Wijnands, R., & Degenaar, N. D. 2013, MNRAS, 434, 1599 [NASA ADS] [CrossRef] [Google Scholar]
- Wijnands, R., & Wang, Q. D. 2002, ApJ, 568, L93 [NASA ADS] [CrossRef] [Google Scholar]
- Wijnands, R., In ’t Zand, J. J., Rupen, M., et al. 2006, A&A, 449, 1117 [NASA ADS] [CrossRef] [EDP Sciences] [Google Scholar]
Appendix A: Analysis of the 2021 X-ray data set
We fit the 2021 Swift/XRT spectra of J1357 using a simple power law (powerlaw) affected by photoelectric absorption (phabs), assuming a constant column density of 1.2 × 1020 cm−2 (Armas Padilla et al. 2014b; Torres et al. 2015). The results of this analysis are presented in Table A.1.
Log and spectral results of Swift/XRT observations during the 2021 outburst of J1357.
Appendix B: Re-analysis of the 2017 LT data set
We re-analysed the 2017 data set presented in JI19b with the same method used for the 2019 and 2021 data sets (see Sect. 3.3). This data set consists of seven photometric epochs obtained with the LT between May 15 and July 13, using the OG515 and KG3 filters (∼V + R). As shown in Fig. B.1, we obtained the same DRPs found by JI19b, all of them significant at our 0.2 FAP criterium (i.e. 80% significance).
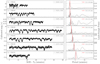 |
Fig. B.1. Optical light curves for 2017 data set (left) and the LSP for each epoch (right), from top (epoch #1) to bottom (#7). The 0.2 FAP and the highest, significant peak are indicated by a horizontal, dashed line and a vertical red line, respectively. |
Appendix C: Quiescence optical light curves and periodograms
We analysed the quiescent data with the same method used for the 2019 and 2021 data sets (see Sect. 3.3). This data set consists of two photometric epochs obtained with ULTRACAM (Dhillon et al. 2007) at the William Herschel Telescope (Observatorio del Roque de los Muchachos) in two consecutive nights in 2012 (April 24 and 25, with exposure times of ∼10 s and seeings of 1.2 and 1.4 arcsecs, respectively, Shahbaz et al. 2013). Optical dips are visible, as we show in Fig. C.1. Both r-band light curves and periodograms were analysed (left and middle panels of Fig. C.2), but only the first one revealed a significant peak, with DRP of 21.5±0.5 min. The second epoch maximum peak is significant at 79%. Due to their temporal proximity, we also performed an LSP on the two epochs together (right panel of Fig. C.2), which reveals a significant peak at 19.5±0.5 min.
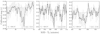 |
Fig. C.1. Detail of a selection of optical dips observed in epoch #1 of the 2012 data set obtained in quiescence. |
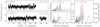 |
Fig. C.2. Optical r-band light curves for the 2012 quiescence data set (left). Original and combined (to 20 s) data sets are plotted in grey and black, respectively. The LSP is computed for the original data set in each epoch (middle) and for the whole data set (right). The 0.2 FAP (80% significance) and the highest, significant peak are indicated by a horizontal dashed line and a vertical red line, respectively. |
All Tables
Log and spectral results of Swift/XRT observations during the 2021 outburst of J1357.
All Figures
|
Fig. 1. Long-term I-band flux density light curve of J1357 (Caruso et al., in prep.), obtained with Las Cumbres Observatory. The 2011, 2017, 2019, and 2021 outbursts are clearly distinguished. |
| In the text | |
|
Fig. 2. X-ray (Swift and NICER, left panel) and optical (LCO, right panel) light curves of the four outbursts (solid lines). In both panels, the photometric epochs used in this work are indicated by symbols (crosses, dots, triangles and stars for 2011, 2017, 2019, and 2021 outbursts, respectively), with smaller markers for epochs with no significant DRPs (#1 and #7 in 2021, see Sect. 3.3). The dates of first detections are given in Table 2. The grey band indicates an optical magnitude interval (17.1–17.3) with peculiar DRP evolution (see Fig. 8, and Sect. 4.2.1). |
| In the text | |
|
Fig. 3. Detail of three optical dips observed during the 2019 outburst. The horizontal dashed line indicates the mean magnitude of each epoch. The starting MJD and mean i-mag of each epoch are indicated in lower left and right boxes, respectively. |
| In the text | |
|
Fig. 4. Detail of four optical dips observed during the 2021 outburst. The horizontal dashed line indicates the mean magnitude of each epoch. The starting MJD and mean r-mag of each epoch are indicated in lower left and right boxes, respectively. |
| In the text | |
|
Fig. 5. Optical light curves (left) and periodograms (right) for the 2019 outburst, from top (epoch #1) to bottom (#5). Light curves averaged into 20 s bins are superimposed for clarity (black). The starting MJD and mean magnitude of each epoch are shown in upper left and right boxes, respectively. The 0.2 FAP (80% significance) and the highest significant peak are indicated in the periodograms with a horizontal, dashed line and a vertical red line, respectively. |
| In the text | |
|
Fig. 6. Optical light curves (left) and periodograms (right) for the 2021 outburst, using the same colour and line codes than Fig. 5, from top (#1) to bottom (#7). We note that epochs #1 and #7 do not show significant peaks in the LSPs. When the favoured DRP does not correspond to the peak with the highest power (see Sect. 3.3.1), the last one is indicated with a vertical dashed line (#2, #5 and #6). Epoch #7 is not averaged into 20 s bins, as the exposure time was 15 s. |
| In the text | |
|
Fig. 7. DRP evolution with time during the four outbursts of J1357. Colours and symbols are the same than in Fig. 2. |
| In the text | |
|
Fig. 8. DRP evolution with X-ray (left) and optical (right) fluxes for the four outbursts of J1357. The X-ray flux for each DRP was interpolated between those of the closest X-ray observations (0–3 days). The 2017, 2019 and 2021 LT data sets only include epochs with significant peaks in the LSPs (see Figs. 5, 6 and B.1). Open markers (epochs #2, #5 and #6 of 2021) indicate the DRPs corresponding to the LSP peaks with the highest power (Sect. 3.3.1). The grey band indicates an optical magnitude interval (17.1–17.3) with a peculiar DRP evolution (also marked in Fig. 2, see Sect. 4.2.1). |
| In the text | |
|
Fig. 9. Same figure as Fig. 8, now including data from 2012 quiescence (black square) and an independent data set from the 2017 outburst (Paice et al. 2019, small black dots in the left panel). In the DRP-Fx plot (left panel) the quiescent Fx value was obtained with XMM-Newton 422 days after the DRP measurement (Armas Padilla et al. 2014b), which could affect its position on the diagram. The coefficients of a linear fit to all the data sets (excluding 2021 open markers) are shown in a text box. |
| In the text | |
|
Fig. B.1. Optical light curves for 2017 data set (left) and the LSP for each epoch (right), from top (epoch #1) to bottom (#7). The 0.2 FAP and the highest, significant peak are indicated by a horizontal, dashed line and a vertical red line, respectively. |
| In the text | |
|
Fig. C.1. Detail of a selection of optical dips observed in epoch #1 of the 2012 data set obtained in quiescence. |
| In the text | |
|
Fig. C.2. Optical r-band light curves for the 2012 quiescence data set (left). Original and combined (to 20 s) data sets are plotted in grey and black, respectively. The LSP is computed for the original data set in each epoch (middle) and for the whole data set (right). The 0.2 FAP (80% significance) and the highest, significant peak are indicated by a horizontal dashed line and a vertical red line, respectively. |
| In the text | |
Current usage metrics show cumulative count of Article Views (full-text article views including HTML views, PDF and ePub downloads, according to the available data) and Abstracts Views on Vision4Press platform.
Data correspond to usage on the plateform after 2015. The current usage metrics is available 48-96 hours after online publication and is updated daily on week days.
Initial download of the metrics may take a while.