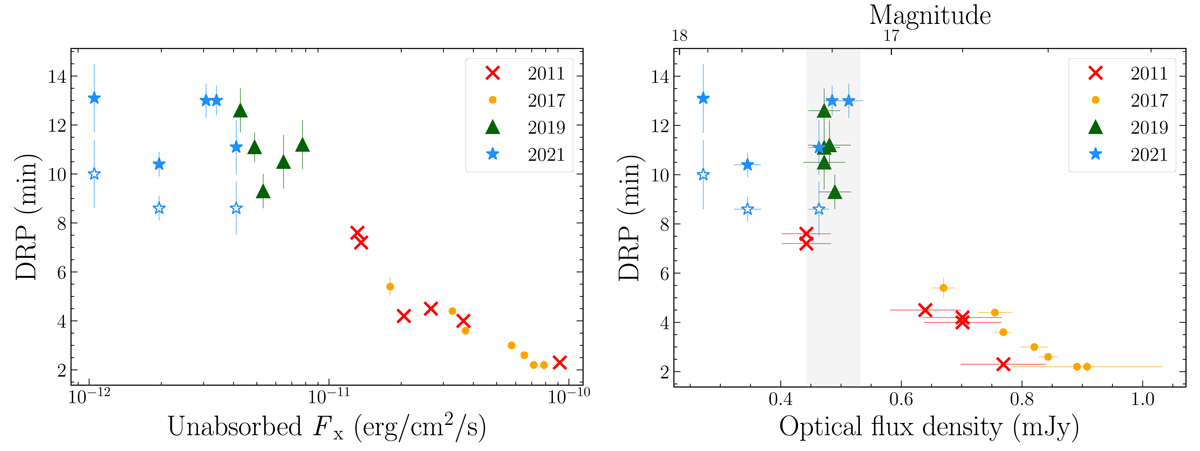
Fig. 8.
Download original image
DRP evolution with X-ray (left) and optical (right) fluxes for the four outbursts of J1357. The X-ray flux for each DRP was interpolated between those of the closest X-ray observations (0–3 days). The 2017, 2019 and 2021 LT data sets only include epochs with significant peaks in the LSPs (see Figs. 5, 6 and B.1). Open markers (epochs #2, #5 and #6 of 2021) indicate the DRPs corresponding to the LSP peaks with the highest power (Sect. 3.3.1). The grey band indicates an optical magnitude interval (17.1–17.3) with a peculiar DRP evolution (also marked in Fig. 2, see Sect. 4.2.1).
Current usage metrics show cumulative count of Article Views (full-text article views including HTML views, PDF and ePub downloads, according to the available data) and Abstracts Views on Vision4Press platform.
Data correspond to usage on the plateform after 2015. The current usage metrics is available 48-96 hours after online publication and is updated daily on week days.
Initial download of the metrics may take a while.